Transcription
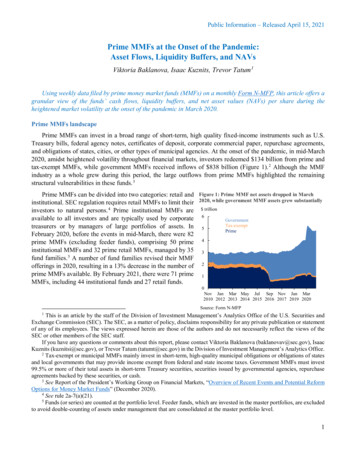
Public Information – Released April 15, 2021Prime MMFs at the Onset of the Pandemic:Asset Flows, Liquidity Buffers, and NAVsViktoria Baklanova, Isaac Kuznits, Trevor Tatum 1Using weekly data filed by prime money market funds (MMFs) on a monthly Form N-MFP, this article offers agranular view of the funds’ cash flows, liquidity buffers, and net asset values (NAVs) per share during theheightened market volatility at the onset of the pandemic in March 2020.Prime MMFs landscapePrime MMFs can invest in a broad range of short-term, high quality fixed-income instruments such as U.S.Treasury bills, federal agency notes, certificates of deposit, corporate commercial paper, repurchase agreements,and obligations of states, cities, or other types of municipal agencies. At the onset of the pandemic, in mid-March2020, amidst heightened volatility throughout financial markets, investors redeemed 134 billion from prime andtax-exempt MMFs, while government MMFs received inflows of 838 billion (Figure 1). 2 Although the MMFindustry as a whole grew during this period, the large outflows from prime MMFs highlighted the remainingstructural vulnerabilities in these funds. 3Prime MMFs can be divided into two categories: retail and Figure 1: Prime MMF net assets dropped in Marchinstitutional. SEC regulation requires retail MMFs to limit their 2020, while government MMF assets grew substantiallyinvestors to natural persons. 4 Prime institutional MMFs are trillionavailable to all investors and are typically used by corporate 6GovernmentTax-exempttreasurers or by managers of large portfolios of assets. In 5PrimeFebruary 2020, before the events in mid-March, there were 82prime MMFs (excluding feeder funds), comprising 50 prime 4institutional MMFs and 32 prime retail MMFs, managed by 35 3fund families. 5 A number of fund families revised their MMFofferings in 2020, resulting in a 13% decrease in the number of 2prime MMFs available. By February 2021, there were 71 prime 1MMFs, including 44 institutional funds and 27 retail funds.0Nov Jan Mar May Jul Sep Nov Jan Mar2010 2012 2013 2014 2015 2016 2017 2019 2020Source: Form N-MFPThis is an article by the staff of the Division of Investment Management’s Analytics Office of the U.S. Securities andExchange Commission (SEC). The SEC, as a matter of policy, disclaims responsibility for any private publication or statementof any of its employees. The views expressed herein are those of the authors and do not necessarily reflect the views of theSEC or other members of the SEC staff.If you have any questions or comments about this report, please contact Viktoria Baklanova (baklanovav@sec.gov), IsaacKuznits (kuznitsi@sec.gov), or Trevor Tatum (tatumt@sec.gov) in the Division of Investment Management’s Analytics Office.2Tax-exempt or municipal MMFs mainly invest in short-term, high-quality municipal obligations or obligations of statesand local governments that may provide income exempt from federal and state income taxes. Government MMFs must invest99.5% or more of their total assets in short-term Treasury securities, securities issued by governmental agencies, repurchaseagreements backed by these securities, or cash.3See Report of the President’s Working Group on Financial Markets, “Overview of Recent Events and Potential ReformOptions for Money Market Funds” (December 2020).4See rule 2a-7(a)(21).5Funds (or series) are counted at the portfolio level. Feeder funds, which are invested in the master portfolios, are excludedto avoid double-counting of assets under management that are consolidated at the master portfolio level.11
Public Information – Released April 15, 2021Prime institutional MMFs can be further divided into publicly offered funds and funds that are not offered tothe public. A few U.S. asset managers established non-public prime institutional MMFs that are used mainly forinternal cash management needs. These funds are sometimes referred to as “internal” or “central” MMFs. InFebruary 2020, there were seven “internal” prime institutional MMFs. This number did not change throughFebruary 2021.Publicly offered prime institutional MMFs had the most outflows in March 2020In March 2020, investors withdrew roughly 125 billion from prime MMFs, both institutional and retail, oraround 11% of their net assets (Figure 2). Prime institutional MMFs had the most outflows. In the last three weeksof March these funds lost around 95 billion, or roughly 14% of their total net assets, including around 88 billionin outflows in the third week of the month (Figure 3). 6Prime institutional MMFs offered to the public had significantly larger outflows than the “internal” funds in thelast three weeks of March. During this period, publicly offered funds lost nearly 99 billion, or around 21% of theirtotal net assets. Of this amount, close to 82 billion, or 19% of these funds’ total net assets, were the outflows inthe third week of the month alone. In the last three weeks of March, the “internal” funds had net inflows of close to 4 billion, or roughly 2% of their total net assets, but there were outflows of around 7 billion (or roughly 3% ofnet assets) in the third week. The inflows in the “internal” funds in the first and the second weeks of March 2020reflected increased overall cash balances across the asset management complex.Prime retail MMFs had outflows of around 48 billion in the last three weeks of March 2020, or roughly 11%of their total net assets, including a 27 billion outflow in the third week of the month (Figure 2). The outflowsfrom both institutional and retail prime MMFs reversed in April. Net assets of prime MMFs continued to grow untilJune 2020, when they reached 1,162 billion. Then the trend reversed and the net assets declined to 920 billion byFebruary 2021.Figure 2: In the third week of March 2020, primeinstitutional MMFs offered to the public had the largestoutflows among prime MMF categoriesNet assets ( billion)Net assets ( billion)500-50-100-150Figure 3: In the third week of March 2020, primeinstitutional MMFs had outflows of around 88 billionwith 92% attributed to the publicly offered fundsInstitutional (offered publicly)Institutional (not offered publicly)RetailMar Apr May Jul Aug Oct Nov Dec Feb2020 2020 2020 2020 2020 2020 2020 2020 2021Note: Weekly asset changes take into account asset flows andvaluation changes.Source: Form N-MFP% of net assets8010%405%00%-40-80Institutional (offered publicly) - left axisInstitutional (not offered publicly) - left axisPercent of assets - right axis-5%-10%-120-15%Mar Apr May Jul Aug Oct Nov Dec Feb2020 2020 2020 2020 2020 2020 2020 2020 2021Note: Weekly asset changes take into account asset flows andvaluation changes.Source: Form N-MFPPercentages of flows during a specific time period are calculated using net subscriptions and redemptions during theperiod divided by the net assets at the end of the prior period.62
Public Information – Released April 15, 2021Prime institutional MMFs managed by bank-affiliatedadvisers had the most outflows in March 2020Figure 4: Prime MMF assets are managed by advisersowned by firms in other types of financial servicesAdvisers of prime MMFs are sometimes majority owned byfirms in other types of financial services, such as banking orinsurance, although most prime MMF net assets are managedby advisers without such affiliations. In February 2020, 78% ofprime MMF net assets were managed by asset managers that arenot majority owned by other types of financial services firms,close to 20% of net assets were managed by advisers owned byfirms with significant banking business, and 2% of net assetswere managed by advisers owned by insurance companies(Figure 4). This breakdown remained largely unchanged during2020. billion900600RetailInstitutional3000Feb- Jan- Feb- Jan- Feb- Jan- Feb- Jan- Feb- Jan20 21 20 21 20 21 20 21 20 21AssetmanagerFBOInsurance U.S. bank U.S. bank(G-SIB)FBO - foreign banking organization.The largest outflows in mid-March were from the publicly Note:Source: Form N-MFP, authors' calculationsoffered prime institutional MMFs with advisers owned bybanking firms (Figure 5). For example, the funds with advisers owned by the largest U.S. banks designated as globalsystemically important banks (“G-SIBs”) accounted for 56% of the outflows in the third week of March even thoughthese funds managed only around 28% of net assets in publicly offered prime institutional MMFs. 7On the other hand, prime retail MMFs with advisers in the asset management business accounted for 94% ofthe total 48 billion outflows in the last three weeks of March 2020. This is broadly consistent with the share ofprime retail MMF assets managed by these advisers, which is 93% of the total.Figure 5: Publicly offered prime institutional MMFsthat are affiliated with the largest U.S. banks had themost outflows in March 2020Figure 6: Fund families with small to mid-size primeinstitutional MMF assets had the most outflows inMarch 2020 although some had inflowsFlows in March 2020as % of net assets60% billion5040%020%-50-1000%Asset managersInsuranceFBOsU.S. banksU.S. G-SIBs3/6/203/27/20 4/17/205/8/20-20%Net assets in February 2020, billion-20406080-40%-60%5/29/20 6/19/20Note: Weekly asset changes take into account asset flows andvaluation changes.Source: Form N-MFP, authors' calculationsNote: Monthly changes in net assets take into account asset flowsand valuation changes. Only assets in publicly offered primeinstitutional MMFs are depicted; assets are consolidated at thefund family level.Source: Form N-MFPThe data also show that fund complexes with smaller assets under management in publicly offered primeinstitutional MMFs generally had larger outflows from their funds, on a percent of assets basis (Figure 6). Similarly,smaller prime retail MMF complexes had the largest outflows on a percent of assets basis.7See Financial Stability Board, “2020 list of global systemically important banks (G-SIBs)” (November 2020).3
Public Information – Released April 15, 2021A few prime institutional MMFs, mainly within fundfamilies owned by insurance firms, had inflows in March 2020,when the industry outflows were in focus. The divergent cashflows illustrate that investors may have various motivationseven during the stress market events.Figure 7: Prime institutional and retail MMFs' medianWLAs increased by the end of March 2020% of total assets60%50%Outflows reduced prime MMFs’ liquidity buffersInstitutional40%Outflows from prime MMFs reduced their weekly liquidRetailRule 2a-7 thresholdassets (WLA), which in some cases approached or fell below830%the 30% threshold set by SEC rules. If an MMF’s portfolio fallsbelow the 30% WLA threshold, it may not acquire any assetsother than WLA until it meets this threshold. 9 A prime MMF 20%Jun Aug Oct Dec Feb Apr Jun Aug Oct Decmay impose liquidity fees or temporarily suspend redemptions2019 2019 2019 2019 2020 2020 2020 2020 2020 2020if the fund’s WLA declines below 30% of its total assets. 10 ToSource: Form N-MFPdate, no MMF has used these tools. Historically, most fundshave maintained WLA that are well in excess of 30% of their total assets (Figure 7).The data show that most of the largest asset outflows in the third week of March 2020 were from the funds withWLA close to 40%, and in some cases above 40%, in the prior week (Figure 8). However, the daily outflows at theonset of the pandemic exceeded available liquidity for some funds and consumed additional liquidity buffers. Thelowest WLA of 27% was reached by one prime institutional MMF in the third week of March, but it did not imposea liquidity fee nor did it suspend redemptions. 11The median WLAs for both prime institutional and prime Figure 8: Many publicly offered prime institutionalretail MMFs increased notably by the end of March as the funds MMFs had large outflows in the third week of Marchenhanced their liquidity buffers and the official sector took steps 2020 even with WLA well above 30% in the prior weekWLA as % ofto support the flow of credit in the economy. 12 During the resttotal assetsof 2020, the median WLA of prime institutional MMFs100%continued to increase, reaching a high of 58% of total assets in80%the last week of November 2020. As of February 2021, the60%median WLA remained above 50% of total assets.40%Volatility of prime MMFs’ NAV per share increased at theonset of the pandemicBy regulation, prime institutional MMFs must sell andredeem their shares at a market-based NAV. 13 Nonetheless,these funds strive to preserve principal and are normallymanaged to minimize volatility of their NAV per share. Since0%outflows, billion30% WLA20%-20-15-10-505Note: WLA as of 3/13/20; weekly net flows for the week ending3/20/20. Only data of publicly offered prime institutional MMFsare included.Source: Form N-MFPWeekly liquid assets are: cash; direct obligations of the U.S. government; agency discount notes with remainingmaturities of 60 days or less; certain securities that will mature (or be payable through a demand feature) within five businessdays; or amounts unconditionally due within five business days from pending security sales. See rule 2a-7(a)(28).9See rule 2a-7(d)(4)(iii).10See rule 2a-7(c)(2)(i).11The lowest WLA figure is based on the fund’s daily website reporting.12The list of funding, credit, liquidity, and loan facilities established in response to the Covid-19 is available on the FederalReserve Board’s website.13See rule 2a-7(c)(1).84
Public Information – Released April 15, 2021October 2016, when weekly data became available, median Figure 9: NAVs of publicly offered prime institutionalNAV per share of the publicly offered prime institutional MMFs MMFs declined in the third week of March 2020has stayed within a range of 5 basis points around 1.0000 (one 1.0050basis point is 1/100th of 1%) (Figure 9).In March 2020, elevated market volatility and constrainedliquidity at the onset of the pandemic negatively affectedvaluation of assets held by prime MMFs. In response, the NAVper share of these funds declined. In the third week of March,the week of the highest NAV volatility, the minimum NAV pershare of publicly offered prime institutional MMFs dropped to 0.9976, while the median NAV per share was 0.9992 (Figure9). 1.0025 1.0000 0.9975MaximumMedianMinimum 0.9950Oct May Dec Jun Jan Aug Mar Oct2016 2017 2017 2018 2019 2019 2020 2020Note: Weekly NAV per share reported as of Fridays. Some NAVper share were normalized to 1.0000 for comparability.Source: Form N-MFPThe MMF filings data did not show any apparentrelationship between the level of the funds’ NAV per share andoutflows in the third week of March 2020. For example, theprime institutional MMF with the lowest NAV per share had only modest outflows of around 6 million, whichwas less than 1% of the fund’s net assets. On the other hand, the prime institutional MMF with the largest outflowas a percentage of its net assets (54%) during that week had a 1.0001 NAV per share.Similarly, the prime retail MMF with the lowest market-based NAV per share ( 0.9980) in the third week ofMarch 2020 had outflows of only 0.1% of its net assets that week. The prime retail MMF with the largest outflowsas a percentage of its net assets (19%) had a market-based NAV per share equal to its stable price of 1.0000.The dispersion of NAV per share abated after market liquidity improved in the second quarter of 2020,supporting the market value of assets. Moreover, as market interest rates declined, the value of assets purchased byprime MMFs before March 2020 increased, pushing the median NAV per share higher.5
Prime MMFs can invest in a broad range of -term, high quality short fixed-income instruments such as U.S. Treasury bills, federal agency notes, certificates of deposit, corporate commercial paper, repurchase agreements, and obligations of states, cities, or other types of municipal agencies. At the onset of the pandemic, in mid-March