Transcription
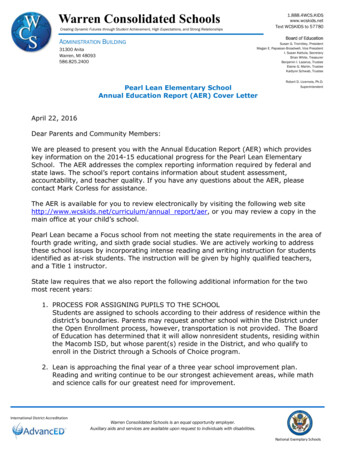
Warren Consolidated Schools1.888.4WCS.KIDSwww.wcskids.netText WCSKIDS to 57780Creating Dynamic Futures through Student Achievement, High Expectations, and Strong RelationshipsADMINISTRATION BUILDING31300 AnitaWarren, MI 48093586.825.2400Board of EducationSusan G. Trombley, PresidentMegan E. Papasian-Broadwell, Vice PresidentI. Susan Kattula, SecretaryBrian White, TreasurerBenjamin I. Lazarus, TrusteeElaine G. Martin, TrusteeKaitlynn Schwab, TrusteePearl Lean Elementary SchoolAnnual Education Report (AER) Cover LetterRobert D. Livernois, Ph.D.SuperintendentApril 22, 2016Dear Parents and Community Members:We are pleased to present you with the Annual Education Report (AER) which provideskey information on the 2014-15 educational progress for the Pearl Lean ElementarySchool. The AER addresses the complex reporting information required by federal andstate laws. The school’s report contains information about student assessment,accountability, and teacher quality. If you have any questions about the AER, pleasecontact Mark Corless for assistance.The AER is available for you to review electronically by visiting the following web sitehttp://www.wcskids.net/curriculum/annual report/aer, or you may review a copy in themain office at your child’s school.Pearl Lean became a Focus school from not meeting the state requirements in the area offourth grade writing, and sixth grade social studies. We are actively working to addressthese school issues by incorporating intense reading and writing instruction for studentsidentified as at-risk students. The instruction will be given by highly qualified teachers,and a Title 1 instructor.State law requires that we also report the following additional information for the twomost recent years:1. PROCESS FOR ASSIGNING PUPILS TO THE SCHOOLStudents are assigned to schools according to their address of residence within thedistrict’s boundaries. Parents may request another school within the District underthe Open Enrollment process, however, transportation is not provided. The Boardof Education has determined that it will allow nonresident students, residing withinthe Macomb ISD, but whose parent(s) reside in the District, and who qualify toenroll in the District through a Schools of Choice program.2. Lean is approaching the final year of a three year school improvement plan.Reading and writing continue to be our strongest achievement areas, while mathand science calls for our greatest need for improvement.International District AccreditationWarren Consolidated Schools is an equal opportunity employer.Auxiliary aids and services are available upon request to individuals with disabilities.National Exemplary Schools
3. Warren Consolidated Schools offers several specialized programs to meet the needsof a variety of learners.The Macomb Math and Science Center (MMSTC) is an honors program for 9th –12th grade students in 11 Macomb County districts who are interested inadvanced/accelerated mathematics, science, and computer technology. Studentsmust apply and be selected for the program based upon placement testing andteachers recommendation. The Center’s program is a half day and students attendtheir home school for the remainder of the day. It is located at Butcher EducationalCenter.The Middle School Mathematics Science Technology Center (MS)2TC offersan advanced mathematics, science technology option for middle school students.Students who are accepted into the program will split their day between their homemiddle school, where they will take their social studies and two elective classes, andButcher Educational Center, where they will take their mathematics, science andEnglish language arts classes.The Middle School- School of Performing Arts (MS-WCSPA) is an exciting,creative program that has been designed to build on the district’s nationallyacclaimed, award-winning high school performing arts program (WCSPA) which islocated in Sterling Heights High School. MS-WCSPA is intended for academicallyfocused and creative students who seek to blend their academic experience withinterest in the performing arts. Students who are accepted into the program willsplit their school day between their home middle school, where they will take theirlanguage arts, science, and math classes, and Butcher Educational Center, wherethey will take their social studies and two performing arts electives. The performingarts electives will include visual arts, music, dance, and theatre exploratoryexperiences.The Career Preparation Center (CPC) programs are open to Clintondale, Fraser,and Warren Consolidated 11th and 12th grade students. CPC programs are designedto provide students with skills to enter the workforce or continue with additionalcollege or workplace training. Career Technical Education (CTE) classes at the CPCprovide technical skills and knowledge. Students enrolled in these programs areoften able to earn technical certifications as well as college credit.Community High School is an alternative education program for high schoolstudents. The primary objective of the school is to assist enrolled students inmeeting their high school graduation requirements in a timely manner. It is locatedat the Flynn Educational Center along with the adult ESL program.The Hatherly Educational Center supports the mission and vision of WarrenConsolidated Schools in a variety of ways. The building is home to the WCS EarlyChildhood Special Education (ECSE) Program, the World of Fours (grant-supportedpre-school for 4 year-olds) Program, Transitional kindergarten, and severalMacomb-Intermediate School District Head-Start classrooms.Year-round education offers many benefits for students and families such asincreased student achievement and retention rates, more effective learningenvironment by reduced time spent reviewing, expanded enrichment and
intervention opportunities for students, and expanded educational choice optionsfor parents. Year-round education is offered at Siersma and Holden ElementarySchools.4. Warren Consolidated Schools follows all State of Michigan curriculum guidelines.The Board of Education has adopted a core curriculum based on MichiganCurriculum Framework, Grade-Level Content Expectations/Michigan StateStandards, and Michigan Merit Curriculum approved by the State Board ofEducation. A copy of the core curriculum may be accessed at www.wcskids.net.Lean5. Fall 2014 Iowa Percent Proficient (M-Step Four Level Companion)TotalLevelLevelLevelLevelAreaGrade 8778181989899121121MATH5123Level 1 1-23 %45382839272822222721222135355343.1%31Level 2 24-45 .1% 31.7%Level 3 46-79 NPRLevel 4 80-99 NPR6. Parent Participation at fall and spring 4%SPRING40%43% 3%I would like to thank the families of Lean Elementary for a wonderful year. I look forwardto continuing partnerships with families and community members to help prepare ourstudents for their future. Challenges are thrown our way every day, but working togetherwith families and community members will help make our students’ college and careerready.Sincerely,Mark CorlessPrincipal, Pearl Lean Elementary School
03/11/2016Annual Education ReportLean Elementary SchoolM-STEP Grades 3-8SubjectGradeTestingGroupSchool YearState Percent centProficientPercentPartiallyProficientPercent NotProficientELA (M3rd GradeSTEP)/Reading Content(MEAP)All Students2014-1550%43.5%35.9%31.5%32.6%22.8%13%ELA (M3rd GradeSTEP)/Reading Content(MEAP)All Students2013-1461.3%48.2%62.3%7%55.3%26.3%11.4%ELA (M3rd GradeSTEP)/Reading Content(MEAP)AmericanIndian2013-1458.4% 10 10 10 10 10 10ELA (M3rd GradeSTEP)/Reading %50%18.8%6.3%ELA (M3rd GradeSTEP)/Reading 50%16.7%33.3%ELA (M3rd GradeSTEP)/Reading 28.6%19%ELA (M3rd GradeSTEP)/Reading 3.3%11.1%ELA (M3rd GradeSTEP)/Reading Content(MEAP)NativeHawaiian orOther PacificIslander2013-1454.9% 10 10 10 10 10 10ELA (M3rd GradeSTEP)/Reading Content(MEAP)Two or MoreRaces2013-1461.8%55.3% 10 10 10 10 10A service of the Center for Educational Performance and Information (CEPI)Page 1 of 37
03/11/2016Annual Education ReportLean Elementary SchoolM-STEP Grades 3-8SubjectGradeTestingGroupSchool YearState Percent centProficientPercentPartiallyProficientPercent NotProficientELA (M3rd GradeSTEP)/Reading 21.8%12.7%ELA (M3rd GradeSTEP)/Reading 5%6.9%ELA (M3rd GradeSTEP)/Reading 4.1%15.9%ELA (M3rd GradeSTEP)/Reading LA (M3rd GradeSTEP)/Reading 2.5%10.4%ELA (M3rd GradeSTEP)/Reading .1%15.6%ELA (M3rd GradeSTEP)/Reading 35.5%32.7%38.2%29.1%16.4%16.4%ELA (M3rd GradeSTEP)/Reading 39.3%47.4%5.3%42.1%36.8%15.8%ELA (M3rd GradeSTEP)/Reading %57.7%15.4%23.1%3.8%2014-15A service of the Center for Educational Performance and Information (CEPI)Page 2 of 37
03/11/2016Annual Education ReportLean Elementary SchoolM-STEP Grades 3-8SubjectGradeTestingGroupSchool YearState Percent centProficientPercentPartiallyProficientPercent NotProficientELA (M3rd GradeSTEP)/Reading .3%19%0%19%57.1%23.8%ELA (M3rd GradeSTEP)/Reading Content(MEAP)Students %0%ELA (M3rd GradeSTEP)/Reading Content(MEAP)Students WithDisabilities2013-1435.1%25% 10 10 10 10 10ELA (M4th GradeSTEP)/Reading Content(MEAP)All A (M4th GradeSTEP)/Reading Content(MEAP)All Students2013-1470%58.2%57.4%3.7%53.7%21.3%21.3%ELA (M4th GradeSTEP)/Reading Content(MEAP)AmericanIndian2014-1536.9% 10 10 10 10 10 10ELA (M4th GradeSTEP)/Reading Content(MEAP)AfricanAmerican2014-1521.2%28.7% 10 10 10 10 10ELA (M4th GradeSTEP)/Reading 7.1%50%21.4%21.4%ELA (M4th GradeSTEP)/Reading 42.3%19.2%A service of the Center for Educational Performance and Information (CEPI)Page 3 of 37
03/11/2016Annual Education ReportLean Elementary SchoolM-STEP Grades 3-8SubjectGradeTestingGroupSchool YearState Percent centProficientPercentPartiallyProficientPercent NotProficientELA (M4th GradeSTEP)/Reading 8%9.5%ELA (M4th GradeSTEP)/Reading Content(MEAP)Hispanic ofAny Race2013-1457.8%69.2% 10 10 10 10 10ELA (M4th GradeSTEP)/Reading Content(MEAP)NativeHawaiian orOther PacificIslander2014-1552.1% 10 10 10 10 10 10ELA (M4th GradeSTEP)/Reading Content(MEAP)NativeHawaiian orOther PacificIslander2013-1476.8% 10 10 10 10 10 10ELA (M4th GradeSTEP)/Reading Content(MEAP)Two or MoreRaces2014-1545.5%28.1% 10 10 10 10 10ELA (M4th GradeSTEP)/Reading Content(MEAP)Two or MoreRaces2013-1471.2%65% 10 10 10 10 10ELA (M4th GradeSTEP)/Reading .3%31.3%ELA (M4th GradeSTEP)/Reading 2.1%23.5%ELA (M4th GradeSTEP)/Reading %26.1%21.7%A service of the Center for Educational Performance and Information (CEPI)Page 4 of 37
03/11/2016Annual Education ReportLean Elementary SchoolM-STEP Grades 3-8SubjectGradeTestingGroupSchool YearState Percent centProficientPercentPartiallyProficientPercent NotProficientELA (M4th GradeSTEP)/Reading .4%14.5%ELA (M4th GradeSTEP)/Reading 26.8%ELA (M4th GradeSTEP)/Reading %28.3%ELA (M4th GradeSTEP)/Reading 31.6%45.5%30.9%23.6%30.9%14.5%ELA (M4th GradeSTEP)/Reading 49.5%46.7%3.3%43.3%23.3%30%ELA (M4th GradeSTEP)/Reading %31.6%63.2%5.3%31.6%0%ELA (M4th GradeSTEP)/Reading .5%26.1%0%26.1%30.4%43.5%ELA (M4th GradeSTEP)/Reading Content(MEAP)Students %ELA (M4th GradeSTEP)/Reading Content(MEAP)Students WithDisabilities2013-1441.6%21.3% 10 10 10 10 10A service of the Center for Educational Performance and Information (CEPI)Page 5 of 37
03/11/2016Annual Education ReportLean Elementary SchoolM-STEP Grades 3-8SubjectGradeTestingGroupSchool YearState Percent centProficientPercentPartiallyProficientPercent NotProficientELA (M5th GradeSTEP)/Reading Content(MEAP)All Students2014-1548.7%43.1%45.7%29.1%25.2%37%8.7%ELA (M5th GradeSTEP)/Reading Content(MEAP)All Students2013-1471.7%63.8%74.8%21.6%53.2%16.2%9%ELA (M5th GradeSTEP)/Reading 61.1%11.1%16.7%11.1%ELA (M5th GradeSTEP)/Reading 3%50%25%16.7%ELA (M5th GradeSTEP)/Reading 53.8%7.7%ELA (M5th GradeSTEP)/Reading 4%11.1%ELA (M5th GradeSTEP)/Reading Content(MEAP)Hispanic ofAny Race2014-1535.4%50% 10 10 10 10 10ELA (M5th GradeSTEP)/Reading Content(MEAP)Hispanic ofAny Race2013-1460.8%47.1% 10 10 10 10 10ELA (M5th GradeSTEP)/Reading Content(MEAP)NativeHawaiian orOther PacificIslander2014-1552.2% 10 10 10 10 10 10A service of the Center for Educational Performance and Information (CEPI)Page 6 of 37
03/11/2016Annual Education ReportLean Elementary SchoolM-STEP Grades 3-8SubjectGradeTestingGroupSchool YearState Percent centProficientPercentPartiallyProficientPercent NotProficientELA (M5th GradeSTEP)/Reading Content(MEAP)NativeHawaiian orOther PacificIslander2013-1470.9% 10 10 10 10 10 10ELA (M5th GradeSTEP)/Reading Content(MEAP)Two or MoreRaces2014-1547.6%35% 10 10 10 10 10ELA (M5th GradeSTEP)/Reading 37.2%9%ELA (M5th GradeSTEP)/Reading 18.8%7.2%ELA (M5th GradeSTEP)/Reading %46.9%10.9%ELA (M5th GradeSTEP)/Reading %9.6%1.9%ELA (M5th GradeSTEP)/Reading 7%6.3%ELA (M5th GradeSTEP)/Reading 2%15.3%ELA (M5th GradeSTEP)/Reading 33.7%38.3%35.8%25.9%32.1%6.2%A service of the Center for Educational Performance and Information (CEPI)Page 7 of 37
03/11/2016Annual Education ReportLean Elementary SchoolM-STEP Grades 3-8SubjectGradeTestingGroupSchool YearState Percent centProficientPercentPartiallyProficientPercent NotProficientELA (M5th GradeSTEP)/Reading 55.2%69.8%14.3%55.6%17.5%12.7%ELA (M5th GradeSTEP)/Reading %37.5%28.1%34.4%34.4%3.1%ELA (M5th GradeSTEP)/Reading .6%46.2%0%46.2%23.1%30.8%ELA (M5th GradeSTEP)/Reading Content(MEAP)Students WithDisabilities2014-1514.6%12.5%0%70%30%0%0%ELA (M5th GradeSTEP)/Reading Content(MEAP)Students 36.4%Mathematics3rd GradeContentAll athematics3rd GradeContentAll athematics3rd GradeContentAmericanIndian2013-1433.7% 10 10 10 10 10 10Mathematics3rd %56.3%0%0%Mathematics3rd 63.6%36.4%Mathematics3rd 3.8%4.8%A service of the Center for Educational Performance and Information (CEPI)Page 8 of 37
03/11/2016Annual Education ReportLean Elementary SchoolM-STEP Grades 3-8SubjectGradeTestingGroupSchool YearState Percent centProficientPercentPartiallyProficientPercent NotProficientMathematics3rd 29.6%Mathematics3rd GradeContentNativeHawaiian orOther PacificIslander2013-1430.1% 10 10 10 10 10 10Mathematics3rd GradeContentTwo or MoreRaces2013-1438.1%28.9% 10 10 10 10 10Mathematics3rd 9.1%5.5%Mathematics3rd .7%34.2%Mathematics3rd 15.9%6.8%Mathematics3rd 8.8%28.6%Mathematics3rd %2.1%Mathematics3rd .2%36.9%Mathematics3rd 4.3%21.8%43.6%34.5%20%1.8%Mathematics3rd 7.4%19.3%5.3%14%38.6%42.1%A service of the Center for Educational Performance and Information (CEPI)Page 9 of 37
03/11/2016Annual Education ReportLean Elementary SchoolM-STEP Grades 3-8SubjectGradeTestingGroupSchool YearState Percent centProficientPercentPartiallyProficientPercent NotProficientMathematics3rd 11.5%50%38.5%11.5%0%Mathematics3rd %0%0%0%33.3%66.7%Mathematics3rd GradeContentStudents %0%Mathematics3rd GradeContentStudents WithDisabilities2013-1422.2%16.4% 10 10 10 10 10Mathematics4th GradeContentAll Mathematics4th GradeContentAll athematics4th GradeContentAmericanIndian2014-1531.9% 10 10 10 10 10 10Mathematics4th GradeContentAfricanAmerican2014-1513.2%15.9% 10 10 10 10 10Mathematics4th %28.6%7.1%57.1%Mathematics4th 3.1%19.2%Mathematics4th %42.9%Mathematics4th GradeContentHispanic ofAny Race2013-1429.3%46.2% 10 10 10 10 10A service of the Center for Educational Performance and Information (CEPI)Page 10 of 37
03/11/2016Annual Education ReportLean Elementary SchoolM-STEP Grades 3-8SubjectGradeTestingGroupSchool YearState Percent centProficientPercentPartiallyProficientPercent NotProficientMathematics4th GradeContentNativeHawaiian orOther PacificIslander2014-1542.3% 10 10 10 10 10 10Mathematics4th GradeContentNativeHawaiian orOther PacificIslander2013-1446.5% 10 10 10 10 10 10Mathematics4th GradeContentTwo or MoreRaces2014-1538.2%40.6% 10 10 10 10 10Mathematics4th GradeContentTwo or MoreRaces2013-1443.8%22.7% 10 10 10 10 10Mathematics4th 5%20.3%Mathematics4th %44.8%Mathematics4th 23.9%10.9%Mathematics4th 5%42.6%Mathematics4th %23.6%Mathematics4th 50.9%Mathematics4th 5%25.5%29.1%45.5%12.7%12.7%A service of the Center for Educational Performance and Information (CEPI)Page 11 of 37
03/11/2016Annual Education ReportLean Elementary SchoolM-STEP Grades 3-8SubjectGradeTestingGroupMathematics4th GradeContentMathematicsSchool YearState Percent centProficientPercentPartiallyProficientPercent 22%23.3%0%23.3%20%56.7%4th 4%5.3%52.6%42.1%0%5.3%Mathematics4th %8.7%0%8.7%21.7%69.6%Mathematics4th GradeContentStudents .3%Mathematics4th GradeContentStudents WithDisabilities2013-1423.2%8.6% 10 10 10 10 10Mathematics5th GradeContentAll hematics5th GradeContentAll athematics5th 8%11.1%0%11.1%Mathematics5th 7%33.3%50%Mathematics5th 4%3.8%Mathematics5th %33.3%Mathematics5th GradeContentHispanic ofAny Race2014-1519.5%43.8% 10 10 10 10 10A service of the Center for Educational Performance and Information (CEPI)Page 12 of 37
03/11/2016Annual Education ReportLean Elementary SchoolM-STEP Grades 3-8SubjectGradeTestingGroupSchool YearState Percent centProficientPercentPartiallyProficientPercent NotProficientMathematics5th GradeContentHispanic ofAny Race2013-1432.3%35.3% 10 10 10 10 10Mathematics5th GradeContentNativeHawaiian orOther PacificIslander2014-1540.4% 10 10 10 10 10 10Mathematics5th GradeContentNativeHawaiian orOther PacificIslander2013-1438.2% 10 10 10 10 10 10Mathematics5th GradeContentTwo or MoreRaces2014-1530.5%15% 10 10 10 10 10Mathematics5th 1.5%3.8%Mathematics5th %45.7%Mathematics5th 14.1%1.6%Mathematics5th 1%44.2%Mathematics5th 7.9%Mathematics5th 41.7%Mathematics5th 9.1%14.8%48.1%37%13.6%1.2%A service of the Center for Educational Performance and Information (CEPI)Page 13 of 37
03/11/2016Annual Education ReportLean Elementary SchoolM-STEP Grades 3-8SubjectGradeTestingGroupMathematics5th GradeContentMathematicsSchool YearState Percent centProficientPercentPartiallyProficientPercent 24.5%31.3%0%31.3%21.9%46.9%5th %12.5%50%37.5%9.4%3.1%Mathematics5th %15.4%0%15.4%7.7%76.9%Mathematics5th GradeContentStudents ematics5th GradeContentStudents ence4th GradeContentAll ce4th GradeContentAmericanIndian2014-158.7% 10 10 10 10 10 10Science4th GradeContentAfricanAmerican2014-152%6.5% 10 10 10 10 10Science4th 1.5%0%Science4th GradeContentNativeHawaiian orOther PacificIslander2014-159.9% 10 10 10 10 10 10Science4th GradeContentTwo or MoreRaces2014-1511.8%6.3% 10 10 10 10 10A service of the Center for Educational Performance and Information (CEPI)Page 14 of 37
03/11/2016Annual Education ReportLean Elementary SchoolM-STEP Grades 3-8SubjectGradeTestingGroupSchool YearState Percent centProficientPercentPartiallyProficientPercent NotProficientScience4th .9%10.9%Science4th 0%Science4th .7%12.5%Science4th 2%9.1%63.6%27.3%5.5%3.6%Science4th 84.2%15.8%0%0%Science4th GradeContentStudents Science5th GradeContentAll nce5th .7%83.3%Science5th %Science5th GradeContentHispanic ofAny Race2013-147.7%11.1% 10 10 10 10 10Science5th GradeContentNativeHawaiian orOther PacificIslander2013-1414.6% 10 10 10 10 10 10A service of the Center for Educational Performance and Information (CEPI)Page 15 of 37
03/11/2016Annual Education ReportLean Elementary SchoolM-STEP Grades 3-8SubjectGradeTestingGroupSchool YearState Percent centProficientPercentPartiallyProficientPercent NotProficientScience5th %47.1%Science5th %51.9%Science5th .3%Science5th 6.3%3.1%3.1%28.1%65.6%Science5th 0%0%7.7%92.3%Science5th GradeContentStudents al Studies5th GradeContentAll l Studies5th .2%66.7%11.1%0%Social Studies5th .2%0%Social Studies5th GradeContentHispanic ofAny Race2014-1512.3%31.3% 10 10 10 10 10Social Studies5th GradeContentNativeHawaiian orOther PacificIslander2014-1520% 10 10 10 10 10 10A service of the Center for Educational Performance and Information (CEPI)Page 16 of 37
03/11/2016Annual Education ReportLean Elementary SchoolM-STEP Grades 3-8SubjectGradeTestingGroupSchool YearState Percent centProficientPercentPartiallyProficientPercent NotProficientSocial Studies5th GradeContentTwo or MoreRaces2014-1520.5%5% 10 10 10 10 10Social Studies5th 7.9%0%Social Studies5th 21.9%0%Social Studies5th .7%0%Social Studies5th .4%12.3%13.6%74.1%12.3%0%Social Studies5th 12.5%18.8%68.8%12.5%0%Social Studies5th GradeContentStudents WithDisabilities2014-156.9%9.4%0%10%90%0%0%A service of the Center for Educational Performance and Information (CEPI)Page 17 of 37
03/11/2016Annual Education ReportLean Elementary SchoolM-STEP Grade 11SubjectGradeTestingGroupSchool YearState Percent centProficientPercentPartiallyProficientPercent NotProficientNo Data to DisplayA service of the Center for Educational Performance and Information (CEPI)Page 18 of 37
03/11/2016Annual Education ReportLean Elementary SchoolMichigan Educational Assessment Program Access (MEAP - Access)SubjectGradeTesting Group School YearState oficientSchool Percent PercentStudentsExceededProficientPercent MetPercentProgressingMathematics3rdAll Students2013-1461.9%81.8% 10 10 10 10Mathematics3rdAfricanAmerican2013-1452.5% 10 10 10 10 10Mathematics3rdFemale2013-1457% 10 10 10 10 10Mathematics4thAll Students2013-1455.3%37.9% 10 10 10 10Mathematics4thWhite2013-1459.8%25% 10 10 10 10Mathematics4thFemale2013-1453.7%36.4% 10 10 10 10Mathematics4thMale2013-1456.2%38.9% 10 10 10 .4%33.3% 10 10 10 10Reading3rdAll Students2013-1438.7%47.1% 10 10 10 10Reading3rdWhite2013-1442.1%53.3% 10 10 10 10Reading3rdMale2013-1438.9%45.5% 10 10 10 10Reading4thAll Students2013-1445.6%30.8% 10 10 10 10Reading4thWhite2013-1450.1%28% 10 10 10 10Reading4thMale2013-1445.4%26.9% 10 10 10 7% 10 10 10 10A service of the Center for Educational Per
Pearl Lean Elementary School Annual Education Report (AER) Cover Letter April 22, 2016 Dear Parents and Community Members: We are pleased to present you with the Annual Education Report (AER) which provides key information on the 2014-15 educational progress for the Pearl Lean Elementary
