Transcription
Physicians inCanada, 2016Summary Report
Production of this document is made possible by financial contributions fromHealth Canada and provincial and territorial governments. The views expressedherein do not necessarily represent the views of Health Canada or any provincialor territorial government.Unless otherwise indicated, this product uses data provided by Canada’s provincesand territories.All rights reserved.The contents of this publication may be reproduced unaltered, in whole or in partand by any means, solely for non-commercial purposes, provided that the CanadianInstitute for Health Information is properly and fully acknowledged as the copyrightowner. Any reproduction or use of this publication or its contents for any commercialpurpose requires the prior written authorization of the Canadian Institute for HealthInformation. Reproduction or use that suggests endorsement by, or affiliation with,the Canadian Institute for Health Information is prohibited.For permission or information, please contact CIHI:Canadian Institute for Health Information495 Richmond Road, Suite 600Ottawa, Ontario K2A 4H6Phone: 613-241-7860Fax: 613-241-8120www.cihi.cacopyright@cihi.caISBN 978-1-77109-635-5 (PDF) 2017 Canadian Institute for Health InformationHow to cite this document:Canadian Institute for Health Information. Physicians in Canada, 2016:Summary Report. Ottawa, ON: CIHI; 2017.Cette publication est aussi disponible en français sous le titre Les médecinsau Canada, 2016 : rapport sommaire.ISBN 978-1-77109-636-2 (PDF)
Table of contentsHighlights. . . . . . . . . . . . . . . . . . . . . . . . . . . . . . . . . . . . . . . . . . . . . . . . . . . . . . . . . . . . . . . . . 4More information . . . . . . . . . . . . . . . . . . . . . . . . . . . . . . . . . . . . . . . . . . . . . . . . . . . . . . . . . . . 5About CIHI’s physician data. . . . . . . . . . . . . . . . . . . . . . . . . . . . . . . . . . . . . . . . . . . . . . . . . . . 6Notes to readers . . . . . . . . . . . . . . . . . . . . . . . . . . . . . . . . . . . . . . . . . . . . . . . . . . . . . . . . . . . 7Report summary . . . . . . . . . . . . . . . . . . . . . . . . . . . . . . . . . . . . . . . . . . . . . . . . . . . . . . . . . . . 7How many physicians are there in Canada? . . . . . . . . . . . . . . . . . . . . . . . . . . . . . . . . . . . 7What are the demographic profiles of the physician workforce in Canada?. . . . . . . . . . . 10What are the migration patterns of physicians?. . . . . . . . . . . . . . . . . . . . . . . . . . . . . . . . 12How are physicians paid? . . . . . . . . . . . . . . . . . . . . . . . . . . . . . . . . . . . . . . . . . . . . . . . . 13How much are physicians paid?. . . . . . . . . . . . . . . . . . . . . . . . . . . . . . . . . . . . . . . . . . . . 18What is the average cost per service?. . . . . . . . . . . . . . . . . . . . . . . . . . . . . . . . . . . . . . . 21Appendix: Text alternatives for figures. . . . . . . . . . . . . . . . . . . . . . . . . . . . . . . . . . . . . . . . . . 22References . . . . . . . . . . . . . . . . . . . . . . . . . . . . . . . . . . . . . . . . . . . . . . . . . . . . . . . . . . . . . . 26
Physicians in Canada, 2016: Summary ReportHighlightsThis report contains information on the supply of physicians in Canada, physician serviceutilization and payments to physicians that are administered through the provincial and territorialmedical care plans. Data on the supply, demographics and mobility of physicians is as ofDecember 31, 2016. The service utilization and payments data is for fiscal year 2015–2016.For the 10th year in a row, the number of physicians and the number of physicians perpopulation increased in Canada. In 2016, there were 84,063 physicians in Canada, representing a 2.3% increase over 2015.This was the lowest growth rate over the previous 5 years. Between 2012 and 2016, growth in the number of physicians outpaced population growth,resulting in 230 physicians per 100,000 population in 2016. Based solely on the number of MD degrees currently being awarded by Canadian universities,the number of physicians is expected to continue to increase for the next several years. The number of new graduates and of female physicians in the workforce continues to rise.The proportion of recent physician graduates (10 years or less since graduation) increasedfrom 16.2% in 2012 to 20.0% in 2016. Among physicians younger than 40, 54.0% are female. Between 2012 and 2016, the number of female physicians increased by 21.0%, while thenumber of male physicians increased by 6.1%.Clinical payments to physicians in Canada increased 3.4% over the previous year. In 2015–2016, total clinical payments to physicians increased 3.4% over the previous year to 25.7 billion; this is a slightly larger increase than seen in 2014–2015 (3.3%) but lower thanthe average annual growth rate of the past decade (6.2%). The average gross clinical payment per physician in 2015–2016 was 339,000; this amountincreased by less than 1% from 2014–2015. The average gross clinical payment perphysician ranged from 262,000 in Nova Scotia to 380,000 in Alberta. The average gross clinical payment to family medicine physicians decreased by almost 1% in2015–2016 to 275,000, while the average gross payment per medical specialist increased1.5% to 347,000; the average per surgical specialist was 461,000, an increase of 1.8%. While the proportion of clinical payments has maintained close to a 70/30 split betweenfee-for-service (FFS) payments and alternative payment plan (APP) payments over the lastseveral years, in 2015–2016, almost all physicians (97%) received some payments throughFFS and more than two-thirds of physicians (69%) received some payments through APPs.4
Physicians in Canada, 2016: Summary ReportConsultations and visits made up the majority of both services and payments. In 2015–2016, FFS payments to physicians for clinical services totalled approximately 17.3 billion. Consultations and visits accounted for 72% of services and 66% ofpayments to physicians, while procedures accounted for the balance (28% of servicesand 34% of payments). In 2015–2016, the average cost per service paid to physicians was 64.05. Family physiciansbilled an average cost per service of 46.96, while medical and surgical specialists billed anaverage of 82.03 and 89.02 per service, respectively.More informationThe following companion products to the Physicians in Canada, 2016: Summary Report areavailable on CIHI’s website at www.cihi.ca: Physicians in Canada, 2016: Chartbook (.pptx)A profile of physicians in Canada, 2016 (infographic; .pdf)Supply, Distribution and Migration of Physicians in Canada, 2016: Data Tables (.xlsx)Supply, Distribution and Migration of Physicians in Canada, 2016: Quick Stats (.xlsx)Supply, Distribution and Migration of Physicians in Canada, 2016: Methodological Notes (.pdf)Supply, Distribution and Migration of Physicians in Canada, 2016: Historical Data (.xlsx)National Physician Database — Payments Data, 2015–2016 (.xlsx)National Physician Database — Utilization Data, 2015–2016 (.xlsx)National Physician Database Historical Data Series (.xlsx)National Physician Database Data Release, 2015–2016: Methodological Notes (.pdf)Physician Services Benefit Rates, 2015–2016: Methodological Notes (.pdf)Physician Services Benefit Rates, 2015–2016: Data Tables (.xlsx)The following Health Human Resources (HHR) product is also available at www.cihi.ca: Regulated Nurses, 2016Feedback and questions are welcome at physicians@cihi.ca.5
Physicians in Canada, 2016: Summary ReportAbout CIHI’s physician dataCollecting and reporting physician information assists decision-makers in the planning,distribution and funding of physicians. Information on the supply, distribution and migrationof physicians from the data sources used in this report has been collected since 1968, andinformation on physician service utilization and payments has been collected since 1989.The Canadian Institute for Health Information (CIHI) has reported on this information since itsinception in 1994.Starting in 2014, CIHI merged data from Scott’s Medical Database and the National PhysicianDatabase into a single report. This provides readers with a source for all physician-relateddata on the supply of physicians, their payments and the services they provide. The reportincludes a series of related products: A summary report on physician supply, distribution, migration, payment andutilization information; Data tables in Excel to enable readers to conduct their own analyses;An infographic to visually showcase report highlights; andPowerPoint slides of key findings for use in presentations.To ensure that our work reflects priority needs, we invite our readers to join the discussionusing CIHI’s Facebook page (www.facebook.com/CIHI.ICIS), Twitter account (twitter.com/CIHI ICIS) or email (physicians@cihi.ca).Any questions regarding this publication should be directed toProgram LeadPhysician InformationCanadian Institute for Health Information495 Richmond Road, Suite 600Ottawa, Ontario K2A 4H6Phone: 613-241-7860Fax: 613-241-8120Email: physicians@cihi.caOr visit CIHI online at www.cihi.ca.6
Physicians in Canada, 2016: Summary ReportNotes to readersThis report contains information on the supply of physicians in Canada, physician serviceutilization and payments to physicians that are administered through the provincial and territorialmedical care plans. Data on the supply, demographics and mobility of physicians is as ofDecember 31, 2016. The service utilization and payments data is for fiscal year 2015–2016.Report summaryHow many physicians are there in Canada?2016 saw the highest number of physicians ever recorded in Canada, and the increases arelikely to continue. In 2016, there were 84,063 physicians in Canada, representing an increase of 2.3% over theprevious year. This is the lowest increase over the previous 5 years. Looking back, Canada has sustained yearly physician increases of more than 2% since 2007,with increases of more than 4% in 2009 and 2011. The increases over the past 10 years arereminiscent of the 1980s, which also saw large yearly increases (ranging from 2.3% to 4.6%)(see Figure 1).Figure 1 Percentage growth in the supply of physicians, Canada,1980 to 20165%Percentage growth4%3%2%1%SourceScott’s Medical Database, Canadian Institute for Health 99819961994199219901988198619841982-1%19800%
Physicians in Canada, 2016: Summary Report In 2016, most provinces reported an increase in the number of physicians since 2015, withBritish Columbia reporting the largest increase (5.8%). Nova Scotia was the only provincereporting a decrease in the number of physicians, though it was very small (-0.3%). i Based solely on the number of MD degrees awarded by Canadian universities, the numberof physicians is likely to continue to increase.–– In 2016, Canadian universities awarded 2,853 MD degrees, representing an increaseof 1.4% from the previous year.1 Between 2012 and 2016, the number of MD degreesawarded in Canada increased by 7.9%.Over the past 5 years (2012 to 2016), the number of physicians increased at a considerablyfaster rate than the population, resulting in more physicians per population than ever before(see Figure 2). In 2016, there were 230 physicians per 100,000 population. The Canadian population increased by 4.5% between 2012 and 2016, while the physicianpopulation increase was 11.9% — almost 3 times the Canadian population increase.Figure 2 Number of physicians per 100,000 population, Canada,1980 to 2016Physicians per 100,000 1984198219800SourcesScott’s Medical Database, Canadian Institute for Health Information.Statistics Canada. Quarterly population estimates. 2017.i.Numbers for the territories should be interpreted with caution, as the territories rely heavily on physicians who work ontemporary arrangements to provide care. For example, by taking into account itinerant physicians as reported by theNunavut government, the number of family medicine physicians providing services in the territory was 155 in 2016, up from149 in 2015, an increase of 4.0% (see Table 1 in the SMDB Methodological Notes for details).8
Physicians in Canada, 2016: Summary Report Across the jurisdictions, ii with the exception of Nova Scotia and Yukon, the physician-perpopulation ratio in 2016 was the highest ever recorded. Jurisdictions with the highest ratiosincluded Nova Scotia, Newfoundland and Labrador, Quebec, B.C. and Alberta (258, 248,243, 242 and 241 physicians per 100,000 population, respectively) (see Figure 3).Figure 3 Number of physicians per population, by jurisdiction,2012 and 2016300Physicians per 100,000 42207230SourceScott’s Medical Database, Canadian Institute for Health Information.Nationally, the proportions of family medicine and specialist physicians were relativelyequal, with family medicine physicians representing between 50% and 53% of the physicianworkforce since the late 1970s. ii.iii.In 2016, family medicine physicians represented 50.6% of the physician workforce inCanada and approximately half of the physician workforce in each province, ranging from48.5% in Quebec to 55.3% in New Brunswick; in Yukon, family physicians represented87% of the physician workforce. iiiThe Northwest Territories and Nunavut were excluded from this analysis due to their small physician-per-population ratios.The Northwest Territories and Nunavut were excluded from this analysis due to their small physician-per-population ratios.9
Physicians in Canada, 2016: Summary ReportWhat are the demographic profiles of thephysician workforce in Canada?In 2016, 40.6% of Canada’s physicians were women; the proportion was higher among familymedicine physicians (45.3%) and younger physicians (54.0% of those younger than age 40). Between 2012 and 2016, the number of female physicians increased by 21.4%, while thenumber of male physicians increased by 6.1%. In 2016, 40.6% of physicians were women,compared with 37.4% in 2012. Yukon, Quebec and New Brunswick had the highest proportion of women in their physicianworkforces (48.7%, 48.1% and 39.4%, respectively), iv while Prince Edward Island,Saskatchewan and Manitoba reported the lowest percentages of women in their physicianworkforces (30.6%, 34.7% and 35.5%, respectively) (see Figure 4). Across all jurisdictions,v women represented a larger proportion of family medicinephysicians than of specialists. In 2016, women accounted for 45.3% of family medicinephysicians and 35.9% of specialists. In 2016, 54.0% of Canada’s physicians younger than 40 were women. The rate washighest in Quebec, at 64.1% of younger physicians, and lowest in Manitoba, at 46.7%.Females represented more than half of younger physicians in Ontario, in all provinceseast of Ontario v and in the territories. In the provinces west of Ontario, female physiciansrepresented 50.0% (B.C.) or less of all physicians younger than 40.viv.v.The Northwest Territories and Nunavut were excluded from this analysis due to small numbers.Except in P.E.I., where females represented 46.9%.10
Physicians in Canada, 2016: Summary ReportFigure 4 Percentage of female physicians, by jurisdiction,2012 and 201660%Percentage of female nt.Man.Sask.Alta.B.C.Y.T.Total2012 49.3%37.4%2016 48.7%40.6%SourceScott’s Medical Database, Canadian Institute for Health Information.The average age of physicians has declined slightly over the past 5 years, from 50.4 in2012 to 49.8 in 2016. The growing number of younger physicians entering the workforce isinfluencing this trend. On average, family medicine physicians and specialists were about the same age in 2016(49.6 and 49.9 years old).–– Family medicine physicians in Yukon, Alberta and Saskatchewan were the youngest(average age of 46.0, 47.6 and 48.1, respectively), while those in P.E.I. were the oldest(average age of 51.7). vi–– Specialist physicians in Saskatchewan and Alberta were the youngest (average age of47.9 and 48.1, respectively), while those in P.E.I. and Yukon were the oldest (average ageof 52.4 and 51.1, respectively).vi–– The average age of female physicians was 45.9, while the average age of malephysicians was 52.4.vi.The Northwest Territories and Nunavut were excluded from this analysis due to small numbers.11
Physicians in Canada, 2016: Summary Report Across Canada, a slightly higher proportion of the workforce was younger than 40 (26.8%)than was 60 and older (25.3%).–– Yukon, Saskatchewan and Alberta had the highest proportions of physicians youngerthan 40 (41.0%, 31.6% and 31.3%, respectively) and the smallest proportions ofphysicians older than 60 (17.9%, 19.8% and 20.5%, respectively). Conversely, P.E.I.had a relatively older workforce, with 17.6% of physicians younger than 40 and 27.2%of physicians older than 60. It should be noted that Ontario had the highest proportion ofphysicians older than 60 (28.0%), but the proportion of physicians younger than 40 was24.9%, which was not the lowest. viiApproximately one-quarter (25.9%) of Canada’s physicians received their MD degree outsideof Canada. In 2016, 29.3% of Canada’s family medicine physicians and 22.4% of specialists receivedtheir MD degrees outside of Canada. The percentage of physicians in Canada who were trained internationally has increasedslightly in recent years, from 25.2% in 2012 to 25.9% in 2016. Saskatchewan, Newfoundland and Labrador and Alberta had the largest proportions ofinternationally trained physicians in their physician workforces (52.5%, 36.6% and 34.2%,respectively), while Quebec and P.E.I. had the smallest (9.7% and 16.9%, respectively).viiWhat are the migration patterns of physicians?Migration patterns suggest that Canada continues to gain more physicians from othercountries than it is losing. Meanwhile, the number of physicians migrating betweenjurisdictions in Canada has remained relatively constant. In 2016, more physicians returned from abroad than moved abroad, resulting in a net gainof 58 physicians from international migration. Within Canada, 1,101 physicians moved from one jurisdiction to another, representing1.3% of the physician workforce. Since the late 1970s, approximately 1% of physicians have moved between jurisdictionseach year.2vii. The Northwest Territories and Nunavut were excluded from this analysis due to small numbers.12
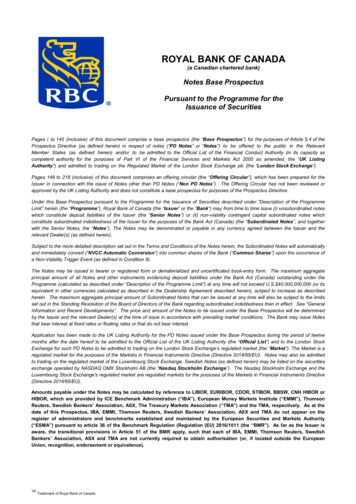
Physicians in Canada, 2016: Summary ReportHow are physicians paid?Since the introduction of the public medical care system in the 1960s, most physicians inCanada have been compensated through fee-for-service (FFS) payments. The emergenceof alternative payment plans (APPs) first became prevalent in the mid-1990s, a time in whichCanada’s health care systems were experiencing a period of reform. Alternative methods ofpaying physicians consist of programs such as salaries, hourly rates, capitation models orcontract-based payments. APPs have become more prominent in the last 2 decades, nowrepresenting nearly 30% of all clinical payments. In 1999–2000, alternative payments totalled 1.0 billion and made up 10.6% of total grossclinical payments. By 2015–2016, alternative payments had reached almost 7.2 billion,which accounted for more than one-quarter (27.9%) of all clinical payments. The shift toward APPs in place of FFS payments appears to have stabilized: from2008–2009 to 2015–2016, FFS payments remained between 70% and 73% of total clinicalpayments (see Figure 5). For the third consecutive year, alternative payments as a proportion of total clinicalpayments saw a slight decrease.Figure 5 Fee-for-service and alternative payments as apercentage of total clinical payments to physicians,1999–2000 to 2015–2016Percentage of total clinical payments100%80%72.1%60%40%27.9%20%1999–220 00000–220 00101–220 00202–220 00303–220 00404–220 00505–220 00606–220 00707–220 00808–220 00909–220 01010–220 01111–220 01212–220 01313–220 01414–220 01515–20160%Fee for serviceAlternativeSourceNational Physician Database, Canadian Institute for Health Information.13
Physicians in Canada, 2016: Summary ReportMany physicians receive compensation through multiple models, which could include bothFFS and alternative payments. While the proportion of clinical payments has maintained closeto a 70/30 split between FFS and APP payments over the last several years, in 2015–2016,almost all physicians (97%) received some payments through FFS and more than two-thirdsof all physicians (69%) received some payments through APPs.Funding through APPs varies significantly across jurisdictions. Nova Scotia had the highestproportion of medical care plan payments paid through APPs (48%). Alberta had thelowest proportion paid through APPs, followed closely by B.C. and Quebec (13%, 21% and21%, respectively).With the exception of Nova Scotia and Saskatchewan, more than 88% of physicians ineach jurisdiction receive at least some payments through FFS. The proportion of physiciansreceiving payments through APPs varies greatly for all jurisdictions, ranging from as high as93% in Nova Scotia to only 16% in Alberta. In Ontario, 99% of all physicians billed some FFS, and 56% were also paid through analternate form of compensation (Figure 6). In Quebec, almost all physicians were paid through both payment types (98% FFS and87% APP), while only 21% of total clinical payments were paid using alternative paymentmodels (see Figure 6).14
Physicians in Canada, 2016: Summary ReportFigure 6 Distribution of physicians and clinical payments bypayment type, .Ont.Man.Sask.Alta.B.C.Y.T.FFS clinical paymentsPercentage of physicians who received any FFS paymentsAPP clinical paymentsPercentage of physicians who received any APP paymentsTotalNotesFFS: Fee for service.APP: Alternative payment plan.The number of physicians in Saskatchewan and Alberta may include radiology and laboratory specialists.Data for Newfoundland and Labrador is not finalized and should be considered preliminary.SourceNational Physician Database, Canadian Institute for Health Information.15
Physicians in Canada, 2016: Summary ReportYounger physicians and female physicians were more likely to receive the majority of theirpayments through APPs, compared with their older and male colleagues across the country. 29% of female physicians and 23% of male physicians receive more than half of their totalclinical payments through APPs (Figure 7). Physicians age 60 and older were more likely to be paid through FFS (79%) (Figure 7).Figure 7 Distribution of physicians by payment type, sex andage group, 2015–2016100%80%60%40%20%0%FemaleMale90% FFS 4050%–90% FFS50%–90% APPNotesFFS: Fee for service.APP: Alternative payment plan.Saskatchewan, Alberta, the Northwest Territories and Nunavut are not included.SourceNational Physician Database, Canadian Institute for Health Information.1660 40–5990% APP
Physicians in Canada, 2016: Summary ReportHowever, it appears that physician specialty was a stronger indicator of payment model thandemographic profile. Overall, family medicine physicians were more likely to be paid throughAPPs than medical specialists and surgical specialists. In Canada, 35% of family medicinephysicians, 17% of medical specialists and 8% of surgical specialists received more than halfof their total clinical payments through APPs (see Figure 8).Figure 8 Distribution of physicians by payment type,broad specialty, 2015–2016100%80%60%40%20%0%Family medicine90% FFSMedical specialties50%–90% FFS50%–90% APPSurgical specialties90% APPNotesFFS: Fee for service.APP: Alternative payment plan.Saskatchewan, Alberta, the Northwest Territories and Nunavut are not included.SourceNational Physician Database, Canadian Institute for Health Information.When looking at physicians who did not receive their payments predominantly through asingle method, there was a considerable difference between family medicine physicians andsurgical specialists. Almost half of all family medicine physicians (48%) received a mixture ofboth FFS and alternative payments, while only approximately one-third of surgical specialists(31%) received the same.17
Physicians in Canada, 2016: Summary ReportHow much are physicians paid?The cost of physician services in Canada can be understood by examining total and averageclinical payments to physicians, the types of services paid for, and information about theproviders and recipients of these services.Gross clinical payments to physicians — defined as payments for insured medical servicesthrough provincial/territorial medical care plans — reached 25.7 billion in 2015–2016 (seeFigure 9). This represents an increase of 3.4% over the previous year; this is a slightly largerincrease than in 2014–2015 (3.3%) but lower than the average annual growth of the pastdecade (6.2%).Figure 9 Total gross and fee-for-service clinical payments tophysicians, 1999–2000 to 2015–2016 30 25.68 billionPayments in billions of dollars 25 18.52 billion 20 15 10 5Total gross186015–20120154–2012014301–220132Fee for serviceSourceNational Physician Database, Canadian Institute for Health 2209919–20 0
Physicians in Canada, 2016: Summary ReportAs total clinical payments have risen, physicians have been earning more on average.In 2015–2016, the average gross clinical payment per physician was slightly less than 339,000, a 0.8% increase from the year before. The average gross clinical payment perphysician ranged from 262,000 in Nova Scotia to 380,000 in Alberta. Over the past 5 years,average gross clinical payments to physicians increased 3.4%, from 327,000 to 339,000(see Figure 10).Figure 10 Average gross clinical payments to physicians,2011–2012 and 2015–2016 400,000 350,000 300,000Payments 250,000 200,000 150,000 100,000 50,000 a.B.C.Y.T.Total2015–2016NotesDue to the greater proportion of short-term, visiting and locum physicians and their lower associatedpayments in certain smaller jurisdictions relative to larger ones, in an attempt to improve comparability, CIHIhas agreed to calculate the average payment per physician using only permanent in-province physicians inP.E.I. and physicians whose total gross payments are at least 60,000 in Yukon (2011–2012 not reported).The average payment for Nova Scotia in 2011–2012 was not available.Data for Newfoundland and Labrador is not finalized and should be considered preliminary.SourceNational Physician Database, Canadian Institute for Health Information.Since 2009, CIHI has reported average gross clinical payments made to physicians byprovincial/territorial medical care plans. These payment amounts are calculated as the sumof all gross clinical payments (FFS and alternative payments) divided by the total number ofphysicians reported to CIHI by the jurisdictions. By 2014–2015, CIHI had acquired physicianlevel alternative payments data from 8 provinces and 1 territory, permitting the calculation andpublication of average gross clinical payments by specialty for these jurisdictions.19
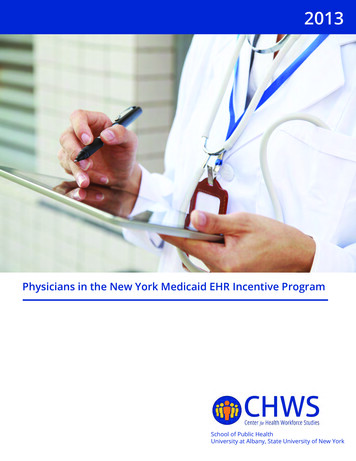
Physicians in Canada, 2016: Summary ReportThe average gross clinical payment to family medicine physicians decreased by almost 1% in2015–2016 to 275,000, while the average gross payment per medical specialist increased1.5% to 347,000; the average per surgical specialist was 461,000, an increase of 1.8%. Ophthalmologists had the highest average gross clinical payment, at 714,000, and anannual increase of 4.2%. Psychiatrists had the lowest average, at 266,000 per physician, and an increase of 1.8%.Aside from family medicine physicians, obstetrics and gynecology specialists were the onlyspecialty to see a decrease in average payment (-3.0%) to 398,000.Figure 11 Average gross clinical payments, by physician ic/cardiovascular surgeryNeurosurgeryGastroenterologyTotal surgical specialtiesUrologyGeneral gyOrthopedic surgeryInternal medicineDermatologyTotal medical specialtiesPlastic surgeryTotal physiciansNeurologyPediatricsFamily medicinePhysical medicinePsychiatry 578,000 569,000 520,000 515,000 461,000 457,000 435,000 424,000 415,000 398,000 398,000 389,000 378,000 347,000 346,000 339,000 304,000 294,000 275,000 274,000 266,000 0 200,000 400,000 714,000 600,000Average gross clinical paymentsFamily medicineSurgical specialistsMedical specialistsTotal surgical/medical specialtiesNoteSaskatchewan, Alberta, the Northwest Territories and Nunavut are not included.SourceNational Physician Database, Canadian Institute for Health Information.20Total physicians
Physicians in Canada, 2016: Summary ReportWhat is the average cost per service?FFS payments ( 18.5 billion) accounted for 72.1% of the 25.7 billion in gross clinical payments(excluding payments to imaging and laboratory specialists). There were 270 million clinicalservices provided in 2015–2016, which cost 17.3 billion. This accounted for 93.5% of thetotal FFS payments paid out by provincial/territorial medical care plans. These payments canbe analyzed to determine which types of services physicians are providing, who is providingthem and who is receiving them. The remaining 1.2 billion, which account for reciprocal billing,anesthesia services and anesthesiology specialists, is excluded. Services provided by physicians can be split into 2 broad
information on physician service utilization and payments has been collected since 1989. The Canadian Institute for Health Information (CIHI) has reported on this information since its inception in 1994. Starting in 2014, CIHI merged data from Scott's Medical Database and the National Physician Database into a single report.