Transcription
2013Physicians in the New York Medicaid EHR Incentive ProgramSchool of Public HealthUniversity at Albany, State University of New York
Physicians in the New YorkMedicaid EHR Incentive ProgramApril 2013Prepared for:The New York State Department of Health,Office of Health Insurance ProgramsProject Completed by:The Center for Health Workforce StudiesSchool of Public Health, University at AlbanyState University of New YorkOne University Place, Suite 220Rensselaer, New York 12144-3445(518) 402-0250http://chws.albany.eduThe Center for Health Workforce Studies is a not-for-profit research organization whose mission is to providetimely, accurate data and conduct policy-relevant research about the health workforce. The Center's work assistshealth, professional, and education organizations; policy makers and planners; and other stakeholders tounderstand issues related to the supply, demand, distribution, and use of health workers.1
BackgroundThe Health Information Technology for Economic and Clinical Health (HITECH) Act of theAmerican Recovery and Reinvestment Act of 2009 established electronic health record (EHR)incentive programs for eligible hospitals (EHs) and eligible professionals (EPs) treatingMedicare- and/or Medicaid-insured populations. The goals of these initiatives are to improvepatient health care and to transform the nation’s health care delivery system through the use ofEHRs. (NYS OMIG, 2011).EHs and EPs receiving incentives must demonstrate that they have achieved “meaningful use” ofEHRs based on nationally established criteria. Both the Medicare and Medicaid incentiveprograms use a stepwise approach to benchmark adoption, implementation, and utilization ofcertified technology and EHRs by EPs and EHs. EPs may participate in only one of the twoincentive programs, either Medicare or Medicaid.Beginning in December 2011, EPs in New York began to enroll in the Medicaid EHR incentiveprogram. Between January 2011 when the Medicare EHR program began enrollment andFebruary 2013, 8,527 EPs in New York received 398 million in Medicare incentives and 4,915EPs received 311 million in Medicaid EHR incentives. Among the EPs who have registeredwith the Medicaid EHR program, attested to qualifying for the program, and been accepted bythe program there are 4,293 physicians. The following tables and maps describe thecharacteristics of the physicians who have been accepted to the New York State Medicaid EHRincentive program and who are now in the process of establishing meaningful use of EHRs.MethodsIn order to better understand the characteristics of the physicians participating in the NYSMedicaid EHR incentive program, the Center for Health Workforce Studies (the Center) built acomprehensive data set from a variety of sources about physicians in New York. The datainclude the following information: All licensed physicians in New York from the New York State Department of Education,Office of the Professions;Biennial re-registration survey data about the demographic, educational, and practicecharacteristics of physicians in the state collected by the Center;Data about physician participation with Regional Extension Centers (RECs) in New Yorkfrom the New York State Department of Health (NYSDOH);National Commission on Quality Assurance (NCQA) data about New York physicianscertified in the patient-centered medical home (PCMH) program;Data about physicians’ locations in designated facility and geographic health professionalshortage areas in New York collected by the Center; and2
Data from the New York State Department of Health (DOH), Office of Health InsurancePrograms (OHIP) on registrations and attestations for the NYS Medicaid EHR incentiveprogram.The following data analysis describes the characteristics of physicians participating in theMedicaid EHR incentive program and compares them to all active care physicians in New Yorkand also to all physicians enrolled as participating providers with the New York Medicaidprogram in 2010.FindingsDemographic Characteristics Physicians accepted to the EHR incentive program were more likely than all otherphysicians in New York to be female (41.8% compared to 31.8%). Compared to otherphysicians in New York, EHR incentive recipients were on average younger (mean age46 years compared to mean age 52 years), and significantly more likely to be either Asian(26.1% compared to 20.1%) or an underrepresented minority 1 (18.8% compared to10.5%).Educational Background Physicians in the incentive program were less likely than all other physicians inNew York to have graduated from either a New York high school or medical school andwere more likely to have been educated in another country during high school (33.2%compared to 26.9%) or for medical school (39.1% compared to 34.8%).Physician Specialties Nearly one-third of the physicians receiving incentive payments (31.4%) primarilypracticed in general pediatrics (24.2%) or in a pediatric subspecialty (7.2%). Anadditional 16.1% of EHR incentive recipients indicated a secondary specialty in generalpediatrics (11.8%) or a secondary subspecialty in pediatrics (4.3%). 2EHR incentive recipients were more likely than other physicians to be primarilypracticing in family/general medicine (11.8% compared to 6.2%), internal medicine(18.5% compared to 15.8%), or obstetrics and gynecology (7.6% compared to 4.0%).The percentage of EHR incentive recipients practicing in medical specialties other thanprimary care did not differ substantially from the percentage of other physicians in NewYork practicing in specialties. However, EHR incentive recipients were slightly more1Underrepresented minority (URM) includes African Americans, Mexican Americans, Nation Americans (including AmericanIndians, Native Hawaiians, and Alaska Natives), Pacific Islanders, and Puerto Ricans (Johns Hopkins Medicine, 2013).2The minimum patient threshold for pediatricians’ participation in the incentive program is 10% less than the threshold for otherphysician specialties.3
likely to have completed a residency program in their principal specialty than were otherphysicians in New York.Work Status EHR incentive recipients were more likely to be working full time (90.1%) than otherphysicians in New York (85.1%), but they were less likely to be providing patient carefor 40 hours or more per week (43.2% compared to 49.1%). EHR incentive recipientswere more likely than other physicians to be spending more weekly hours in research,teaching, and administration.Practice Settings EHR incentive recipients were more likely to work in ambulatory care (84.3%) than otherphysicians in New York (70.6%). They were also more likely to work in hospitaloutpatient settings (15.7% compared to 9.4%), hospital satellite facilities (2.5% comparedto 1.2%), or freestanding health centers or clinics (12.1% compared to 3.7%) than otherphysicians.EHR incentive recipients were less likely than other physicians in New York to be in solopractices (21.4% compared to 32.9%) and more likely to be in a group practice with twoto five physicians (36.1% compared to 30.5%) or six to 10 physicians (20.6% to 14.2%). 3Physicians who received an EHR incentive from the New York Medicaid program wereless likely than other physicians in New York to treat high percentages of Medicareinsured patients, patients with other payment sources (e.g., commercial insurance), orself-pay patients. However, EHR incentive recipients were significantly more likely thanother physicians to treat higher percentages of Medicaid-insured patients.Practice Characteristics EHR incentive recipients were more likely than other physicians in New York to bepracticing in a facility HPSA (11.1% compared to 1.3%), 4 a geographic HPSA (3.4%compared to 3.1%), to be certified in the PCMH program of NCQA (23.1% comparedto 5.9%), or to be a member of a Regional Extension Center (REC) (18.8% compared to 7.5%).3The incentive program permits each physician in a group practice to meet the patient threshold based on the entire group’spatient panel, which may encourage group practice participation.4The minimum patient threshold for participation in the EHR incentive program for physicians predominately working in anFQHC, which is a facility HPSA, includes not only Medicaid-insured patients but also other needy individuals, including childreninsured by the Children’s Health Insurance Program (CHIP) or patients who are provided with uncompensated care or reducedfee services because they are low-income individuals.4
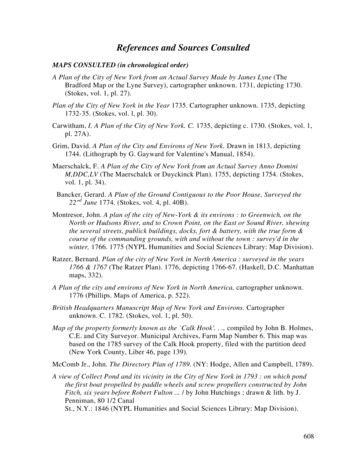
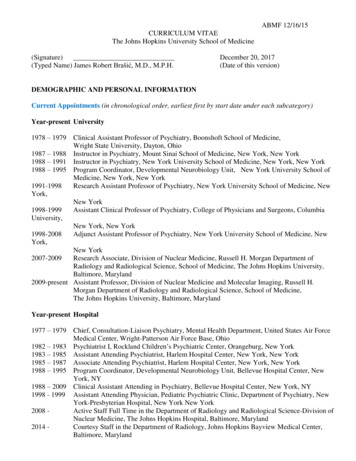
Previous Use of EHRsMore than half of the EHR incentive recipients in the state (53.1%) indicated in the physician reregistration survey that they used EHRs at their principal practice location in 2010. At the sametime, just 41.2% of other physicians in New York indicated use of EHRs. 5Geographic CharacteristicsAlbany, Warren, Onondaga, and Westchester Counties were found to have the highestconcentrations of physicians who were incentive recipients per 10,000 Medicaid-eligiblepopulations. The same counties and Monroe County had the highest concentration of physicianincentive recipients per population living at or below the 200% federal poverty level (FPL).The following are the tabular summaries of the analysis of physicians in the Medicaid EHRincentive program.DemographicsWhen compared to all active care physicians in New York, EHR incentive recipients were foundto be appreciably different. EPs who were accepted into the incentive program were more oftenfemale, were on average younger, and were significantly more likely to be either Asian or anunderrepresented minority than the overall population of physicians in New York.Table 1. Demographic Characteristics of Physicians in New York,by Selected Characteristics, 2010DemographicsAll PhysiciansMedicaidProvidersEHR IncentiveRecipientsGenderMaleFemaleMedian AgeRace/ EthnicityWhiteAsian/ Pacific IslanderBlack/ African AmericanAmerican Indian/ Alaska NativeHispanic/Latino68.2%31.8%52 years72.2%27.8%53.4 years58.2%41.8%49.2 5.1%26.1%9.5%0.3%9.0%*Note: Areas shaded in pink indicate lower percentages for EHR incentive recipients than for all physicians in New York. Areasshaded in green indicate higher percentages for EHR incentive recipients than for all physicians.Source: CHWS, NYS Reregistration Survey.5This preceded the inception of the EHR incentive program in 2011, which suggests that early incentive recipients were alsoearly adopters of EHRs.5
Education and TrainingEHR incentive recipients were less likely than other physicians in New York to have graduatedfrom high school in the state or to have graduated from medical school in the state. They were,however, similar to all physicians in the percent who had graduated from a residency trainingprogram in New York. Further, they were more likely to have attended either high school ormedical school in another country.Table 2. Residence of New York Active Physicians upon Graduation from High School,Medical School, and Residency Training, 2010Residence of PhysiciansUpon Graduation from High SchoolNew YorkOther StateCanadaOther CountryTotalUpon Graduation from Medical SchoolNew YorkOther StateCanadaOther CountryTotalUpon Graduation from Most RecentResidency Training ProgramNew YorkOther StateCanadaOther CountryTotalAll PhysiciansMedicaidProvidersEHR 5%0.8%1.7%100.1%77.5%20.4%0.9%1.3%100.1%*Note: Areas shaded in pink indicate lower percentages for EHR incentive recipients than for all physicians in New York. Areasshaded in green indicate higher percentages for EHR incentive recipients than for all physicians.Source: CHWS, NYS Reregistration Survey.6
EHR recipients were mostly graduates of allopathic medical education programs as were allphysicians in New York generally.Table 3. Type of Medical School Attended, New York Physicians, 2010Type of Medical SchoolAllopathicOsteopathicTotalAll Physicians94.2%5.8%100.0%MMIS Providers94.8%5.2%100.0%EHR IncentiveRecipients94.4%5.6%100.0%Source: CHWS, NYS Reregistration Survey.However, among physicians who attended medical school in New York, EHR incentiverecipients were somewhat more likely to be a graduate of an osteopathic medical school thanother physicians.Table 4. Percent of Active Physicians in New York Who Attendeda New York Medical School, by SchoolNew York Medical School (If Attended)Albany Medical CollegeAlbert Einstein (Yeshiva University)Columbia UniversityCornell UniversityMount Sinai School of MedicineNew York College of Osteopathic MedicineNew York Medical CollegeNew York UniversitySUNY BrooklynSUNY BuffaloSUNY at Stony BrookSUNY SyracuseTouro College of Osteopathic MedicineUniversity of RochesterAll 00.0%EHR 9%13.7%9.1%5.5%8.0%0.0%3.0%100.2%*Note: Areas shaded in pink indicate lower percentages for EHR incentive recipients than for all physicians in New York. Areasshaded in green indicate higher percentages for EHR incentive recipients than for all physicians.Source: CHWS, NYS Reregistration Survey.7
Direct Patient Care TimeThere were few differences among physicians in the EHR incentive program and otherphysicians in New York in the percent of direct patient care time spent in the primary specialtyof the physician.Table 5. Direct Patient Care Time Spent in Primary Specialty, Physicians in New York,2010Percent of Direct Patient Care Time Spent inPrimary Specialty0 to 20% of Time21% to 40% of Time41% to 60% of Time61% to 80% of Time81 to 100% of TimeTotalAll ders1.4%1.1%4.1%9.5%83.8%99.9%EHR ce: CHWS, NYS Reregistration Survey.Physician SpecialtiesEHR incentive recipients were much more likely than other physicians in New York to report apediatric specialty. Nearly one-third of EHR recipient physicians (36%) indicated that generalpediatrics was either a primary (24.2%) or a secondary (11.8%) specialty. An additional 11.5%indicated a pediatric subspecialty as either a primary (7.2%) or a secondary (4.3%) specialty.EHR recipients were also more likely than other physicians to practice primary care infamily/general medicine or internal medicine or in obstetrics and gynecology.8
Table 6. Percent of Physicians in New York, by Specialty, 2010Physician SpecialtyAll PhysiciansMedicaidProvidersEHR IncentiveRecipientsFamily Medicine/General PracticePrimary Specialty7.4%7.4%11.8%Secondary Specialty3.2%3.5%4.0%Primary Specialty15.8%16.5%18.5%Secondary Specialty12.1%13.4%11.4%Primary Specialty4.0%4.4%7.6%Secondary Specialty1.5%1.8%2.9%Primary Specialty7.4%7.5%24.2%Secondary Specialty3.7%4.2%11.8%Primary Specialty2.7%3.0%7.2%Secondary Specialty2.1%2.4%4.3%Internal Medicine (General)Obstetrics and GynecologyPediatrics (General)Pediatrics (Subspecialty)*Note: Areas shaded in pink indicate lower percentages for EHR incentive recipients than for all physicians in New York. Areasshaded in green indicate higher percentages for EHR incentive recipients than for all physicians.There were only small differences among physicians in the EHR incentive program and otherphysicians in New York in the type of medical specialty in which they practiced.9
Table 7. Percent of Physicians in New York, by Specialty, 2010 (cont.)Physician SpecialtyAllergy and ImmunologyPrimary SpecialtySecondary SpecialtyAnesthesiologyPrimary SpecialtySecondary SpecialtyDermatologyPrimary SpecialtySecondary SpecialtyEmergency MedicinePrimary SpecialtySecondary SpecialtyCardiovascular DiseasePrimary SpecialtySecondary SpecialtyCritical CarePrimary SpecialtySecondary SpecialtyEndocrinology and MetabolismPrimary SpecialtySecondary SpecialtyGastroenterologyPrimary SpecialtySecondary SpecialtyGeriatricsPrimary SpecialtySecondary SpecialtyInfectious DiseasePrimary SpecialtySecondary SpecialtyMedical OncologyPrimary SpecialtySecondary SpecialtyNephrologyPrimary SpecialtySecondary SpecialtyPulmonary DiseasePrimary SpecialtySecondary SpecialtyRheumatologyPrimary SpecialtySecondary SpecialtyOther Internal Medicine SubspecialtyPrimary SpecialtySecondary SpecialtyAll PhysiciansMedicaidProvidersEHR %0.1%0.3%1.1%0.3%1.2%0.5%0.8%Source: CHWS, NYS Reregistration Survey.10
Table 7. Percent of Physicians in New York, by Specialty, 2010 (cont.)Physician SpecialtyNeurologyPrimary SpecialtySecondary SpecialtyGynecology onlyPrimary SpecialtySecondary SpecialtyOccupational MedicinePrimary SpecialtySecondary SpecialtyOphthalmologyPrimary SpecialtySecondary SpecialtyOtolaryngologyPrimary SpecialtySecondary SpecialtyPathology (General)Primary SpecialtySecondary SpecialtyPathology (Subspecialty)Primary SpecialtySecondary SpecialtyPhysical Medicine and RehabilitationPrimary SpecialtySecondary SpecialtyPreventive MedicinePrimary SpecialtySecondary SpecialtyPsychiatry- AdultPrimary SpecialtySecondary SpecialtyPsychiatry- Child & AdolescentPrimary SpecialtySecondary SpecialtyRadiology - DiagnosticPrimary SpecialtySecondary SpecialtyRadiology - TherapeuticPrimary SpecialtySecondary SpecialtyAll PhysiciansMedicaidProvidersEHR .8%0.3%0.6%0.5%0.7%0.6%0.2%0.2%Source: CHWS, NYS Reregistration Survey.11
Table 7. Percent of Physicians in New York by Specialty, 2010Physician SpecialtySurgery (General)Primary SpecialtySecondary SpecialtySurgery NeurologicalPrimary SpecialtySecondary SpecialtySurgery, OrthopedicPrimary SpecialtySecondary SpecialtySurgery, PlasticPrimary SpecialtySecondary SpecialtySurgery, ThoracicPrimary SpecialtySecondary SpecialtyOther Surgical SubspecialtyPrimary SpecialtySecondary SpecialtyUrologyPrimary SpecialtySecondary SpecialtyOtherPrimary SpecialtySecondary SpecialtyTotal Primary SpecialtyTotal Secondary SpecialtyAll PhysiciansMedicaidProvidersEHR 1.3%4.5%100.0%0.7%3.8%100.1%59.1%62.0%58.8%Source: CHWS, NYS Reregistration Survey.12
EHR incentive recipients were slightly more likely to have completed a residency program intheir principal specialty than were other physicians in New York.Table 8. Residency Completion and Board Certification Status, Physicians in New York,2010Residency and Board CertificationAll PhysiciansMedicaidProvidersEHR IncentiveRecipientsCompleted Accredited Residency Program inPrincipal Specialty87.3%87.1%88.9%Completed Accredited Residency Program inSecondary Specialty26.7%26.8%24.7%Board Certified Principal Specialty83.1%86.6%85.4%Board Certified Secondary Specialty28.8%30.5%26.8%*Note: Areas shaded in green indicate higher percentages for EHR incentive recipients than for all physicians in New York.Source: CHWS, NYS Reregistration Survey.Work PatternsEHR recipients were somewhat more likely to work full time or to be a fellow in training thanother physicians in New York.Table 9. Work Status of Physicians in New York by Selected Categories, 2010Work StatusFull Time ( 30 hours)Part Time ( 30 hours)Training StatusResidentFellowNeither/ Not in TrainingAll PhysiciansMedicaidProvidersEHR 0%1.0%96.7%0.0%1.5%98.5%0.0%3.6%96.4%*Note: Areas shaded in green indicate higher percentages for EHR incentive recipients than for all physicians in New York.Source: CHWS, NYS Reregistration Survey.13
EHR incentive recipients were less likely than other physicians to be providing patient careservices 40 hours or more per week. However, they were more likely to report research orteaching or administrative activities as a weekly activity.Table 10. Weekly Professional Activities of Physicians in New York, by Hours Devoted toEach Activity, 2010Weekly Patient Care HoursNone1 to 9 hours10 to 19 hours20 to 29 hours30 to 39 hours40 hours or Providers0.0%4.4%9.4%13.4%21.1%51.7%100.0%EHR 7%1.4%99.9%22.5%55.5%14.0%5.9%1.6%0.6%100.1%All PhysiciansWeekly Research HoursNone1 to 9 hours10 to 19 hours20 to 29 hours30 to 39 hours40 hours or moreTotalWeekly Teaching HoursNone1 to 9 hours10 to 19 hours20 to 29 hours30 to 39 hours40 hours or moreTotalWeekly Administrative HoursNone1 to 9 hours10 to 19 hours20 to 29 hours30 to 39 hours40 hours or moreTotal*Note: Areas shaded in pink indicate lower percentages for EHR incentive recipients than for all physicians in New York. Areasshaded in green indicate higher percentages for EHR incentive recipients than for all physicians.Source: CHWS, NYS Reregistration Survey.14
Work SettingEHR incentive recipients were more likely to work in hospital outpatient settings, hospitalsatellite clinics, or free standing health centers and clinics. EHR incentive recipients were alsomore likely to work in ambulatory care than other physicians.Table 11. Practice Setting and Practice Type, Physicians in New York, by SelectedCharacteristics, 2010Primary Practice SettingSolo PracticeGroup PracticeHospital InpatientHospital OutpatientHospital SatelliteFree Standing Health Center or ClinicOtherPractice TypeAmbulatory care including hospitalPrimary PracticeSecondary PracticeInpatient carePrimary PracticeSecondary PracticeEmergency services/ emergency roomPrimary PracticeSecondary PracticeOtherPrimary PracticeSecondary PracticeAll Physicians26.2%34.3%19.0%9.4%1.2%3.7%6.2%All 3.1%4.5%MedicaidProvidersEHR 7%EHR %2.1%9.2%2.1%4.2%1.4%*Note: Areas shaded in pink indicate lower percentages for EHR incentive recipients than for all physicians in New York. Areasshaded in green indicate higher percentages for EHR incentive recipients than for all physicians.Source: CHWS, NYS Reregistration Survey.EHR recipients were less likely than other physicians to be in a solo physician practice. Nearly57% of EHR incentive recipients reported between two and 10 physicians in their primarypractice setting compared to 45% of other active care physicians in New York. The managementstructures and the administrative cost sharing in group practices may permit physicians in groupsto better manage the time and cost associated with implementation of EHRs. The rules of theMedicaid incentive program also permit each physician in the group to meet the patient threshold15
based on the entire group’s patient panel, which may inherently encourage group practiceparticipation.Table 12. Physicians in New York by Primary and Secondary Practice Settings, 2010Number of Physicians in Practice1 PhysicianPrimary PracticeSecondary Practice2 to 5 PhysiciansPrimary PracticeSecondary Practice6 to 10 PhysiciansPrimary PracticeSecondary Practice11 to 20 PhysiciansPrimary PracticeSecondary Practice21 to 50 PhysiciansPrimary PracticeSecondary PracticeMore than 50 PhysiciansPrimary PracticeSecondary PracticeAll PhysiciansMMIS ProvidersEHR 7.1%1.4%6.5%1.4%5.9%2.0%*Note: Areas shaded in pink indicate lower percentages for EHR incentive recipients than for all physicians in New York. Areasshaded in green indicate higher percentages for EHR incentive recipients than for all physicians.**Note: Differences in percentage in solo practice may vary from the prior table due to missing information in the variables usedin the cross tabulations for each table.Source: CHWS, NYS Registration Survey.Practice CharacteristicsEHR incentive recipients were more likely than other physicians to be practicing in a facility orgeographic HPSA. The required minimum patient threshold in a facility HPSA to qualify for theincentive program includes not only Medicaid-insured people but also needy individuals who arelow income or uninsured as well as children insured by the Children’s Health Insurance Program(CHIP). EHR incentive recipients were also more likely than other physicians to be certified inthe PCMH program of NCQA or to be a member of a REC.16
Table 13. Physicians in New York in Facility HPSAs, Geographic HPSAs, PCMHs, andRECs, 2013Characteristics of PhysiciansAll PhysiciansMedicaidProvidersEHR IncentiveRecipientsWorking in a Facility HPSA1.2%1.1%11.1%Working in a Geographic HPSA2.8%3.0%3.4%Certification as a Patient Centered Medical Home5.3%5.8%23.1%Member of a Regional Extension Center6.2%7.4%18.8%* Note: Areas shaded in green indicate higher percentages for EHR incentive recipients than for all physicians in New York.Source: CHWS, NCQA, NYSTEC.Source of Patient PaymentsEHR incentive recipients were less likely to treat high percentages of Medicare-insured patients,patients with other payment sources (e.g., commercial insurance), or self-pay patients comparedto other physicians in New York. EHR incentive recipients were significantly more likely thanother physicians to treat higher percentages of Medicaid-insured patients.17
Table 14. Percent of Patients by Primary Source of Payment for Physician Services,2006-2010Percent of Patients By Primary Source ofPaymentMedicare0 to 9% of Patients10% to 19% of Patients20% to 29% of Patients30% to 39% of Patients40% to 49% of Patients50% to 59% of Patients60% to 79% of Patients80% to 100% of PatientsMedicaid0 to 9% of Patients10% to 19% of Patients20% to 29% of Patients30% to 39% of Patients40% to 49% of Patients50% to 59% of Patients60% to 79% of Patients80% to 100% of PatientsSelf-Pay0 to 9% of Patients10% to 19% of Patients20% to 29% of Patients30% to 39% of Patients40% to 49% of Patients50% to 59% of Patients60% to 79% of Patients80% to 100% of PatientsAll Other0 to 9% of Patients10% to 19% of Patients20% to 29% of Patients30% to 39% of Patients40% to 49% of Patients50% to 59% of Patients60% to 79% of Patients80% to 100% of PatientsAll PhysiciansMMIS ProvidersEHR 6%14.1%8.3%*Note: Areas shaded in pink indicate lower percentages for EHR incentive recipients than for all physicians in New York. Areasshaded in green indicate higher percentages for EHR incentive recipients than for all physicians.Source: CHWS, NYS Reregistration Survey.18
Use of Technology in Patient Care ActivitiesThe physician re-registration data used in this analysis were mainly collected prior to 2011 whenenrollment in the EHR incentive program began. It is interesting to note that physicians whowere Medicaid EHR incentive recipients were more likely to be actively using technology toaugment their practice than other physicians in New York prior to the beginning of the incentiveprogram. Many EHR incentive recipients appeared to be early adopters of informationtechnology.More than half of the Medicaid EHR incentive recipients (53.1%) indicated in the physician reregistration survey that they used EHRs at their principal practice location earlier than 2011. Atthe same time, just 41.2% of other physicians in New York indicated use of EHRs.Table 15. Use of Information Technology in Patient Care Activities, Physicians inNew York, 2010Information TechnologyAll PhysiciansMMIS ProvidersEHR IncentiveRecipientsUse of electronic health records at principalpractice location41.2%39.9%53.1%Use of Internet to obtain lab results, x-rays, orhospital records53.0%56.0%65.9%Use of Internet to communicate with otherphysicians/providers16.8%15.9%19.3%Use of Internet to communicate with or answerpatients' questions21.5%20.3%28.2%Use of Internet to access clinical decisionsupport tools15.6%15.3%18.5%Use of Internet for CE medical education credits68.3%71.1%73.3%Use of Internet to transmit prescriptions topharmacies13.3%14.1%20.2%Use of Internet to obtain information abouttreatment alternatives56.6%58.1%66.4%*Note: Areas shaded in green indicate higher percentages for EHR incentive recipients than for all physicians in New York.Source: NYS Reregistration Surveys 2006-2011.19
GeographyTwo maps were created to understand the relationship between the practice locations of EHRincentive recipients and the locations of Medicaid eligibles and low-income New Yorkers (thoseliving at or below the 200% FPL). The following maps show the ra
EHR incentive recipients were less likely than other physicians in New York to be in solo practices (21.4% compared to 32.9%) and more likely to be in a group practice with two to five physicians (36.1% compared to 30.5%) or six to 10 physicians (20.6% to 14.2%).3 Physicians who received an EHR incentive from the New York Medicaid program were