Transcription
Supply, Distribution andMigration of Physiciansin Canada, 2020Methodology Notes
Production of this document is made possible by financial contributions fromHealth Canada and provincial and territorial governments. The views expressedherein do not necessarily represent the views of Health Canada or any provincialor territorial government.Unless otherwise indicated, this product uses data provided by Canada’s provincesand territories.All rights reserved.The contents of this publication may be reproduced unaltered, in whole or in partand by any means, solely for non-commercial purposes, provided that the CanadianInstitute for Health Information is properly and fully acknowledged as the copyrightowner. Any reproduction or use of this publication or its contents for any commercialpurpose requires the prior written authorization of the Canadian Institute for HealthInformation. Reproduction or use that suggests endorsement by, or affiliation with,the Canadian Institute for Health Information is prohibited.For permission or information, please contact CIHI:Canadian Institute for Health Information495 Richmond Road, Suite 600Ottawa, Ontario K2A 4H6Phone: 613-241-7860Fax: 613-241-8120cihi.cacopyright@cihi.caISBN 978-1-77479-068-7 (PDF) 2021 Canadian Institute for Health InformationHow to cite this document:Canadian Institute for Health Information. Supply, Distribution and Migrationof Physicians in Canada, 2020 — Methodology Notes. Ottawa, ON: CIHI; 2021.Cette publication est aussi disponible en français sous le titre Nombre, répartitionet migration des médecins au Canada, 2020 — notes méthodologiques.ISBN 978-1-77479-069-4 (PDF)
Table of contentsIntroduction . . . . . . . . . . . . . . . . . . . . . . . . . . . . . . . . . . . . . . . . . . . . . . . . . . . . . . . . . . . . . . . 5More information . . . . . . . . . . . . . . . . . . . . . . . . . . . . . . . . . . . . . . . . . . . . . . . . . . . . . . . . . . . 512345Data sources and collection. . . . . . . . . . . . . . . . . . . . . . . . . . . . . . . . . . . . . . . . . . . . . . . . 61.1Scott’s Directories. . . . . . . . . . . . . . . . . . . . . . . . . . . . . . . . . . . . . . . . . . . . . . . . . . . 61.2Non-certified specialist data. . . . . . . . . . . . . . . . . . . . . . . . . . . . . . . . . . . . . . . . . . . . 61.3Population data. . . . . . . . . . . . . . . . . . . . . . . . . . . . . . . . . . . . . . . . . . . . . . . . . . . . . 61.4Other data sources . . . . . . . . . . . . . . . . . . . . . . . . . . . . . . . . . . . . . . . . . . . . . . . . . . 7Data quality . . . . . . . . . . . . . . . . . . . . . . . . . . . . . . . . . . . . . . . . . . . . . . . . . . . . . . . . . . . . 72.1Data supply interruptions. . . . . . . . . . . . . . . . . . . . . . . . . . . . . . . . . . . . . . . . . . . . . . 72.2Physician counts in the territories . . . . . . . . . . . . . . . . . . . . . . . . . . . . . . . . . . . . . . . 92.3Data comparison. . . . . . . . . . . . . . . . . . . . . . . . . . . . . . . . . . . . . . . . . . . . . . . . . . . 14Computations. . . . . . . . . . . . . . . . . . . . . . . . . . . . . . . . . . . . . . . . . . . . . . . . . . . . . . . . . . 173.1Head count inclusions and exclusions. . . . . . . . . . . . . . . . . . . . . . . . . . . . . . . . . . . 173.2Physician-to-population ratios. . . . . . . . . . . . . . . . . . . . . . . . . . . . . . . . . . . . . . . . . 203.3Age and average age . . . . . . . . . . . . . . . . . . . . . . . . . . . . . . . . . . . . . . . . . . . . . . . 203.4Assigning urban and rural status. . . . . . . . . . . . . . . . . . . . . . . . . . . . . . . . . . . . . . . 203.5Assigning subspecialties to physicians . . . . . . . . . . . . . . . . . . . . . . . . . . . . . . . . . . 203.6Certified and non-certified specialists . . . . . . . . . . . . . . . . . . . . . . . . . . . . . . . . . . . 213.7Physicians by health region. . . . . . . . . . . . . . . . . . . . . . . . . . . . . . . . . . . . . . . . . . . 24Data limitations. . . . . . . . . . . . . . . . . . . . . . . . . . . . . . . . . . . . . . . . . . . . . . . . . . . . . . . . . 264.1Valid mailing address. . . . . . . . . . . . . . . . . . . . . . . . . . . . . . . . . . . . . . . . . . . . . . . . 264.2Time delay in reporting changes . . . . . . . . . . . . . . . . . . . . . . . . . . . . . . . . . . . . . . . 264.3Physicians moving abroad. . . . . . . . . . . . . . . . . . . . . . . . . . . . . . . . . . . . . . . . . . . . 274.4Resident data . . . . . . . . . . . . . . . . . . . . . . . . . . . . . . . . . . . . . . . . . . . . . . . . . . . . . 274.5Comparisons between jurisdictions. . . . . . . . . . . . . . . . . . . . . . . . . . . . . . . . . . . . . 274.6Specialty designations. . . . . . . . . . . . . . . . . . . . . . . . . . . . . . . . . . . . . . . . . . . . . . . 27Privacy and confidentiality. . . . . . . . . . . . . . . . . . . . . . . . . . . . . . . . . . . . . . . . . . . . . . . . 285.1CIHI “no publication” methodology. . . . . . . . . . . . . . . . . . . . . . . . . . . . . . . . . . . . . . 285.2CIHI “no publication” status. . . . . . . . . . . . . . . . . . . . . . . . . . . . . . . . . . . . . . . . . . . 29
Supply, Distribution and Migration of Physicians in Canada, 2020 — Methodology NotesAppendices . . . . . . . . . . . . . . . . . . . . . . . . . . . . . . . . . . . . . . . . . . . . . . . . . . . . . . . . . . . . . . 31Appendix A: Data definitions . . . . . . . . . . . . . . . . . . . . . . . . . . . . . . . . . . . . . . . . . . . . . . 31Appendix B: Specialty groupings: SMDB reports/tables. . . . . . . . . . . . . . . . . . . . . . . . . . 36Appendix C: Text alternatives for figures . . . . . . . . . . . . . . . . . . . . . . . . . . . . . . . . . . . . . 39References . . . . . . . . . . . . . . . . . . . . . . . . . . . . . . . . . . . . . . . . . . . . . . . . . . . . . . . . . . . . . . 414
Supply, Distribution and Migration of Physicians in Canada, 2020 — Methodology NotesIntroductionThe Canadian Institute for Health Information (CIHI) collects, maintains and reports on thesupply, distribution, demographics and migration of physicians in Canada, using data fromScott’s Medical Database (SMDB). Collecting and reporting physician information assistsdecision-makers in the planning, distribution and funding of physicians.Health Canada managed the SMDB until 1994. That year, Health Canada transferred theSMDB to CIHI. The SMDB includes historical data files from 1968 onward and is maintainedon a network database (in Oracle) at CIHI. CIHI has collected, maintained and reported onthis information since its inception in 1994.More informationThe following physician products are available on CIHI’s website: A profile of physicians in Canada, 2020 (infographic) National Physician Database, 2019–2020 (payments and utilization data tables,historical payments and utilization data tables, methodology notes) Physician billing codes in response to COVID-19 (web page)Supply, Distribution and Migration of Physicians in Canada, 2020 (data tables, historical datatables, methodology notes)Other health workforce products are available on CIHI’s website: Health workforce in Canada: Highlights of the impact of COVID-19 (data tables, methodology notes)Nurse Practitioner Scopes of Practice in Canada, 2020 (infographic, data table)Canada’s Health Care Providers, 2015 to 2019 (infographic, data tables, methodology notes)Health Workforce in Canada, 2020 — Quick StatsAny questions regarding this publication should be directed toProgram Lead, Physician InformationCanadian Institute for Health Information495 Richmond Road, Suite 600Ottawa, Ontario K2A 4H6Phone: 613-241-7860Fax: 613-241-8120Email: physicians@cihi.caOr visit CIHI online at cihi.ca.5
Supply, Distribution and Migration of Physicians in Canada, 2020 — Methodology Notes1Data sources and collection1.1 Scott’s DirectoriesScott’s Directories, owned by iMD Health Global Corp., maintains a database on physicians inCanada to produce the Canadian Medical Directory and mailing lists for commercial purposes.CIHI acquires a copy of this database annually from Scott’s Directories in a raw data format toupdate Scott’s Medical Database (SMDB). Scott’s Directories collects data from organizationsand institutions such as jurisdictional registrars, the Royal College of Physicians and Surgeonsof Canada (Royal College) and the College of Family Physicians of Canada (CFPC), and fromphysicians who contact them directly.Information on individual physicians is primarily derived from publicly available reports and/orregistration directories issued by jurisdictional licensing authorities.1.2 Non-certified specialist dataCIHI works with jurisdictional authorities to include family medicine physicians who practise asnon-certified specialists in the SMDB in the specialist category. To accomplish this, CIHI contactsthe jurisdictional colleges of physicians and surgeons and requests lists that identify non-certifiedspecialist physicians as close as possible to December 31 of the reference year. CIHI collectslists of non-certified specialists from Newfoundland and Labrador, Prince Edward Island,Nova Scotia, New Brunswick, Saskatchewan, Alberta and Yukon. Additional informationon the SMDB non-certified specialist methodology is available in Section 3.6.1.3 Population dataAll population data used in this publication is from Statistics Canada. Appropriate revisionsto population data are done on an annual basis by CIHI to reflect the most recent populationestimates available. All population sources are noted below the tables.Note to readers: Statistics Canada information is used with the permission of the Ministerof Industry (the minister responsible for Statistics Canada). Information on the availabilityof the wide range of data from Statistics Canada can be obtained from Statistics Canada’sregional offices, its website (statcan.gc.ca) or its toll-free access number (1-800-263-1136).6
Supply, Distribution and Migration of Physicians in Canada, 2020 — Methodology Notes1.4 Other data sourcesPhysician counts and demographic information about physicians are also available froma variety of Canadian sources, including CIHI’s National Physician Database, jurisdictionalministries of health, professional licensing or certifying organizations, the Canadian MedicalAssociation (CMA) and other organizations that include governmental and non-governmentalcollaborative groups and commercial enterprises. CIHI uses this data to conduct comparisonsand to perform data quality exercises.2Data qualityData received by Scott’s Directories is first confirmed for authenticity and then keyed into itssystem. Upon entry into the database, each physician is assigned a unique ID number thatis never recycled, even after the physician retires or dies.At CIHI, once the file has been received from Scott’s Directories, it is processed througha series of edit checks, and an edit/verification report is produced. Edit checks are done on allrecords in the database — active and inactive. Questionable entries are forwarded to Scott’sDirectories and used by their database manager to update any identified coding errors.All SMDB data elements are described in detail in Appendix A.2.1 Data supply interruptionsJurisdictional licensing authoritiesJurisdictional licensing authorities are key data sources for Scott’s Directories and, in turn,CIHI’s SMDB. Data from licensing authorities is used to identify new physicians and to updatehistorical physician information (change of address, medical specialty, etc.). Interruptionsin the data supply chain between licensing authorities and Scott’s Directories contributeto potential over-coverage, under-coverage and/or error within the SMDB.Table 1 outlines data supply interruptions experienced by Scott’s Directories from jurisdictionallicensing authorities. Caution should be used when comparing physician counts for thefollowing provinces with counts from other years.7
Supply, Distribution and Migration of Physicians in Canada, 2020 — Methodology NotesTable 1 Scott’s Directories jurisdictional data supply interruptionsJurisdictionYearSupply interruptionsQuebec2003Data for the year 2003 does not reflect annual physician information providedby the Collège des médecins du Québec.Ontario2002Data for the year 2002 reflects a partial data supply interruption from the Collegeof Physicians and Surgeons of Ontario. Scott’s Directories did not receive physicianinformation updates from the college from September to December 2002.Alberta2000Data for the year 2000 does not reflect annual physician information providedby the College of Physicians and Surgeons of Alberta.BritishColumbia2004Data for the year 2004 does not reflect annual physician information providedby the College of Physicians and Surgeons of British Columbia.Yukon2000Data for the year 2000 does not reflect annual physician information providedby the Yukon government.Other data sourcesWhile jurisdictional licensing authorities are key data suppliers, they are not the only datasource for Scott’s Directories. As noted in Section 1, data reflects physician information gatheredthrough a variety of data sources, including national medical associations. These data sourcesremained active during the data supply interruptions noted in Table 1.Prior to the 2016 data year, Scott’s Directories received lists of graduates from Canadianmedical schools. Medical schools discontinued sending lists of graduates during datacollection for the 2016 data year.Prior to the 2017 data year, Scott’s Directories sent a biannual questionnaire to all activephysicians (individuals with a Doctor of Medicine [MD] degree who have a valid mailing address)in its database in order to confirm, update and add to existing physician information. Scott’sDirectories discontinued the questionnaire during data collection for the 2017 data year, andinformation that was previously acquired through the physician questionnaire is no longer available.In 2017, estimates of the international migration of physicians in and out of Canada werenot published due to concerns about the completeness of the underlying data. The 2018 datasubmission contained complete migration data, and therefore international migration counts werereintroduced. “Physicians who moved abroad” includes physicians who were active in the SMDB inthe previous year and left Canada in the given year. “Physicians who returned from abroad” includesphysicians who were abroad in the previous year and who were active in Canada in the given year.Due to incomplete 2017 international migration data, 2018 data should be interpreted with caution,as 2018 data may include physicians who moved abroad or returned from abroad in 2017.8
Supply, Distribution and Migration of Physicians in Canada, 2020 — Methodology Notes2.2 Physician counts in the territoriesScott’s Directories assigns physicians to the province or territory where they report their primarypostal code. The primary postal code typically reflects the jurisdiction where physicians practiseand provides a reasonable indication of the access to medical care available to the populationin that jurisdiction. In smaller jurisdictions — particularly in the territories where fewer physicianspermanently reside — it is common to rely on arrangements where physicians temporarilyrelocate during the year from another jurisdiction. In these situations, counting only physicianswho permanently reside in the jurisdiction may understate the actual access to care if significantnumbers of physicians are arriving from elsewhere in the country on these arrangements andaugmenting the level of access.Physician counts in Nunavut are a prime example of the influence of temporary physiciansupply counts on the health care portrait of the territory. CIHI has received similar data fromthe other 2 territories.NunavutIn 2020, Scott’s Directories reported that there were 25 physicians with a postal code inNunavut — 21 family medicine physicians and 4 specialists. However, according to informationobtained from the Nunavut Department of Health shown in tables 2A and 2B, there were 109individual family medicine physicians providing 8,718 days of service in the territory that year,or an average of 80 service days each. There were also 29 individual specialist physiciansproviding 1,936 days of service in the territory that year, or an average of 39 service days each.The following tables show the growth in the number of physicians and the service daysthey provided in Nunavut, by region, as reported by the Nunavut Department of Health.9
Supply, Distribution and Migration of Physicians in Canada, 2020 — Methodology NotesTable 2 Number of physicians and service days rendered in Nunavut, by region, 2003–2004 to 2020–2021A. Family medicine physiciansFiscal yearTotal numberof familymedicinephysicians,NunavutTotalservice daysrendered,NunavutAverageservice days,NunavutNumberof familymedicinephysicians,QikiqtaalukService daysrendered,QikiqtaalukNumberof familymedicinephysicians,KivalliqService daysrendered,KivalliqNumberof 1880635,301262,325141,09210
Supply, Distribution and Migration of Physicians in Canada, 2020 — Methodology NotesB. SpecialistsFiscal yearTotal numberTotalof specialist service ce days,NunavutNumber ofspecialistphysicians,QikiqtaalukService daysrendered,QikiqtaalukNumber ofspecialistphysicians,KivalliqService daysrendered,KivalliqNumber ofspecialistphysicians,KitikmeotService tesn/a: Not available. Data for fiscal year 2011–2012 was not provided by the Nunavut Department of Health.Starting in the 2017–2018 data year, the Nunavut Department of Health counted individual service days as Family Medicine days or Specialist days, depending on the typeof service provided. Therefore, total counts may not add up to the sum of individual regions.SourceNunavut Department of Health.Due to the high volume of itinerant or visiting physicians in Nunavut, CIHI and the Government of Nunavut have discussed analternate method for counting physicians in the territory using annual service day data from Table 2. This is referred to as the numberof effective physicians. The number of effective physicians is calculated by dividing the total number of service days by the averagenumber of days worked in a year. The Government of Nunavut estimates the number of days worked per year by an average full-timefamily medicine physician in Nunavut to be 220.As seen in Table 2A, there were 8,718 family medicine physician service days in 2020–2021; when divided by 220 days of service,this equals 40 effective family medicine physicians providing services throughout the year. These effective physicians include boththose residing in the territory and those who came from other parts of the country for short periods throughout the year to fill locumpositions or to fill other gaps in access. By using the number of effective physicians to calculate physicians per 100,000 population,the number of family medicine physicians per 100,000 population becomes 101. The number of effective family medicine physiciansper 100,000 population provides a more meaningful value when compared with the national average of 123 family medicinephysicians per 100,000.11
Supply, Distribution and Migration of Physicians in Canada, 2020 — Methodology NotesSeparation of Nunavut from the Northwest TerritoriesOn April 1, 1999, when the central and eastern portions of the Northwest Territories becamethe new territory of Nunavut, Scott’s Directories did not collect Nunavut-specific data, and Nunavutphysicians were included in the counts of physicians residing in the Northwest Territories. However,Nunavut-specific data was collected by Scott’s Directories beginning in 2000. For the purposesof the current publication, 1999 Nunavut data has been generated using postal codes, and allanalyses reflect distinct physician data for Nunavut and the Northwest Territories from 1999onward. A total of 11 family medicine and specialist physicians, previously identified as havinga jurisdiction of residence in the Northwest Territories, were reassigned to Nunavut. Readersare cautioned when comparing changes over time in the Northwest Territories, as some of thechange is attributable to the creation of Nunavut.Furthermore, since 1994, Scott’s Directories has been unable to obtain updates from physicianlicensing authorities in Nunavut. In order to update information on physicians practising inNunavut, Scott’s Directories has relied on other sources, such as licensing information fromother jurisdictional colleges for which the physicians are members, and physician self-updates.Northwest TerritoriesCIHI receives data on itinerant physicians from the government of the Northwest Territories.According to the SMDB, in 2020 there were 52 physicians with a postal code in the NorthwestTerritories, representing 40 family medicine physicians and 12 specialists.As shown in Table 3, in 2020–2021, 895 itinerant physicians were identified by the governmentof the Northwest Territories, representing 797 family medicine physicians and 98 specialists.Like Nunavut, the Northwest Territories has a high volume of itinerant physicians.Table 3 Number of itinerant physicians and service days rendered in theNorthwest Territories, 2019–2020 and 2020–2021Fiscal yearTotal number Total itinerantof itinerant family medicinefamilyphysicianmedicineservice daysphysiciansrenderedTotalnumber ofitinerantspecialistphysiciansTotal itinerantspecialistphysicianservice daysrenderedTotalnumber ofitinerantphysiciansTotal numberof itinerantphysicianservice 0–20217977,166982,5788959,744SourceGovernment of the Northwest Territories, Health and Social Services Authority.12
Supply, Distribution and Migration of Physicians in Canada, 2020 — Methodology Notes YukonAccording to the SMDB, in 2020 there were 85 physicians with a postal code in Yukon,representing 71 family medicine physicians and 14 specialists. However, this numberrepresents less than half of all physicians who provided care in the territory.CIHI has been working with the Yukon government to identify itinerant physicians; whenthey are added to those who reside in the territory, this provides a more comprehensiveestimate of the total physician supply. As shown in Table 4, in 2020–2021, 97 itinerantphysicians were identified by the Yukon government, representing 44 family medicinephysicians and 53 specialists.Table 4 Number of itinerant physicians and service days rendered in Yukon,2017–2018 to 2020–2021Fiscal yearTotal number Total itinerantof itinerant family medicinefamilyphysicianmedicineservice daysphysiciansrenderedTotalnumber ofitinerantspecialistphysiciansTotal itinerantspecialistphysicianservice daysrenderedTotalnumber ofitinerantphysiciansTotal numberof itinerantphysicianservice vernment of Yukon, Department of Health and Social Services.13
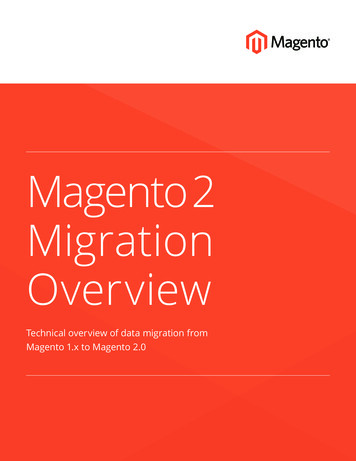
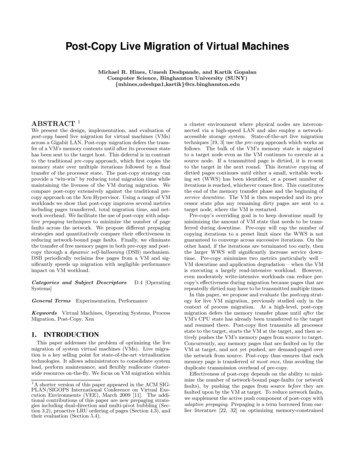
Supply, Distribution and Migration of Physicians in Canada, 2020 — Methodology NotesRole of nursesThe territories employ a primary care delivery model in which full-scope advanced practicenurses are more likely to meet needs that are met by family medicine physicians in muchof the rest of Canada. The nursing model of primary care alters the nurse-to-physician ratiorelative to the rest of Canada. Furthermore, in the territories, more registered nurses arefound in community settings such as nursing stations or community health centres.To learn more about CIHI’s data and information on regulated nurses, please refer to thehealth workforce and nurse practitioner scopes of practice products.2.3 Data comparisonThe counts of physicians from other data sources may not agree with CIHI’s counts due to theinclusion and exclusion criteria applied by each source, and the timing of their data collection.Ontario Physician Human Resources Data CentreCIHI conducted a comparison of physician supply counts from the SMDB versus the OntarioPhysician Human Resources Data Centre (OPHRDC) i and the CMA. OPHRDC counts ofOntario physicians include those who are semi-retired, military physicians and physicianswho have completed their post-graduate medical training and were active ii in that reportingyear. The CMA’s counts in Ontario exclude residents and include non-clinicians, semi-retiredphysicians and non-registered physicians. By comparison, CIHI’s SMDB includes non-registeredphysicians and excludes residents, as well as physicians who are semi-retired, who are inthe military, who request to be excluded from the publication (non-registered physicians only)and who are practising abroad. The impact of these different criteria on the relative numbersof physicians reported by each of these 3 data sources is illustrated in Figure 1 below.i.ii.The OPHRDC is governed collaboratively by the College of Physicians and Surgeons of Ontario, the Ontario Ministry ofHealth, the Ontario Medical Association and the Council of Ontario Faculties of Medicine. The OPHRDC provides physiciansupply data to CIHI on behalf of the Ontario Ministry of Health.The OPHRDC defines active Ontario physicians as those with a valid licence from the College of Physicians and Surgeonsof Ontario who have completed their postgraduate medical training and who provided patient care for at least 52 days duringthe reporting year. As such, OPHRDC counts may include semi-retired physicians, military physicians and physicians whohave recently completed their postgraduate medical training.14
Supply, Distribution and Migration of Physicians in Canada, 2020 — Methodology NotesFigure 1 Number of physicians in Ontario, comparisonof 3 data sources, 2003 to 202035,50033,500Number of 002003 2004 2005 2006 2007 2008 2009 2010 2011 2012 2013 2014 2015 2016 2017 2018 2019 2020SMDBOPHRDCCMANotesSMDB: Scott’s Medical Database.OPHRDC: Ontario Physician Human Resources Data Centre.CMA: Canadian Medical Association.CMA data for 2019 and 2020 was unavailable at the time of publication.SourcesScott’s Medical Database, Canadian Institute for Health Information, with raw data provided by iMD ( 2021iMD Health Global Corp.); Ontario Physician Human Resources Data Centre; Canadian Medical Association.With the differences in inclusion and exclusion criteria described above, the observed gapbetween SMDB data and OPHRDC data varies over time.A more comprehensive comparison exercise is done periodically to explore the reasons for thegap. iii The latest findings indicated that close to 3,200 physicians were identified in the SMDBbut not in the OPHRDC, and more than 800 physicians were identified in the OPHRDC but notin the SMDB, in part due to licence status exclusions. Furthermore, shifts in the compositionof different subgroups included or excluded also partly explained the varying gap.iii.More information can be found in the PowerPoint Comparison of CIHI’s PIC & OPHRDC’s PIO 2019, available from theOPHRDC.15
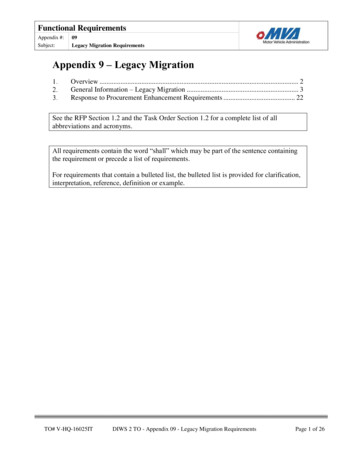
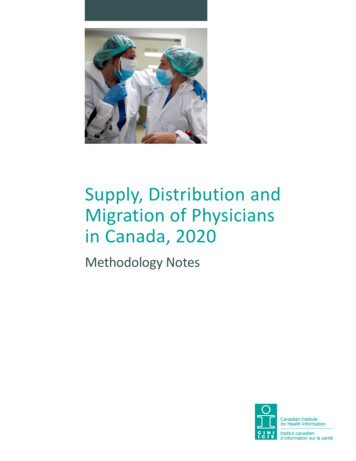
Supply, Distribution and Migration of Physicians in Canada, 2020 — Methodology NotesCollege of Physicians and Surgeons of ManitobaCIHI also performs an annual comparison of counts published by the College of Physicians andSurgeons of Manitoba (CPSM) and the CMA. The count of Manitoba physicians by the CPSMincludes all physicians who are registered and licensed to practise in Manitoba, including semi-retiredphysicians and fully licensed residents. The CMA’s count of its members in Manitoba, like in Ontario,excludes residents and includes non-clinicians and semi-retired physicians. By comparison, CIHI’sSMDB includes non-registered physicians and excludes residents, physicians who are semi-retired,who are in the military, who request to be excluded from the publication (non-registered physiciansonly) and who are practising abroad. The impact of these different criteria on the relative numbers ofphysicians reported by each of these 3 Manitoba-specific data sources is illustrated in the figure below.Figure 2 Number of physicians in Manitoba, comparisonof 3 data sources, 2003 to 20203,2003,0002,800Number of 1,0002003 2004 2005 2006 2007 2008 2009 2010 2011 2012 2013 2014 2015 2016 2017 2018 2019 2020CPSMCMASMDBNotesSMDB: Scott’s Medical Database.CPSM: College of Physicians and Surgeons of Manitoba.CMA: Canadian Medical Association.CMA data for 2019 and 2020 was unavailable at the time of publication.SourcesScott’s Medical Database, Canadian Institute for Health Information, with raw data provided by iMD ( 2021iMD Health Global Corp.); College of Physicians and Surgeons of Manitoba; Canadian Medical Association.16
Supply, Distribution and Migration of Physicians in Canada, 2020 — Methodology Notes3Computations3.1 Head count inclusions and exclusionsPhysician supply counts are
The following physician products are available on CIHI's website: A profile of physicians in Canada, 2020 (infographic) Supply, Distribution and Migration of Physicians in Canada, 2020 (data tables, historical data tables, methodology notes) National Physician Database, 2019-2020 (payments and utilization data tables,