Transcription
Best Practices for OINDP Pharmaceutical DevelopmentPrograms Leachables and ExtractablesVIII. Quality Control and Specification SettingPQRI Leachables & Extractables Working GroupPQRI Training CourseApril 12-13, 2007Chicago, IL
Definition Review A Leachables Study is a laboratory investigation into thequalitative and quantitative nature of a particular OINDPleachables profile(s) over the proposed shelf-life of theproduct. Supports:§ Developing an extractables/leachables correlation§ Establishment of drug product leachables acceptance criteria. Routine Extractables Testing is the testing by which OINDPcontainer closure system critical components arequalitatively and quantitatively profiled for extractables,for:§ Establishing extractables acceptance criteria§ Release by established acceptance criteria.April 2007PQRI Training Course2
Control of Leachables ThroughControl of Extractables Specificationsand acceptance criteria are requiredfor leachables profiles in OINDP. Implementation of routine leachables testing andspecifications/acceptance criteria is a policymatter. If extractables/leachables correlations can beestablished, then leachablesspecifications/acceptance criteria may beestablished as “if tested will comply”. Therefore, in the ideal situation leachables can becontrolled through routine testing of extractables.April 2007PQRI Training Course3
Routine Extractables TestingPerformed on all critical components of OINDP containerclosure systems with following general goals: To establish extractables acceptance criteria for OINDPcritical container closure system components.To help ensure that the leachables profile in the drugproduct is maintained within appropriate limits.To release OINDP container closure system criticalcomponents according to established acceptance criteria,which are designed to:§ Confirm the identities and levels of known extractables;§ Detect “unspecified” extractables which could be present as theresult of component ingredient changes, manufacturing changes,external contamination, or other causes.April 2007PQRI Training Course4
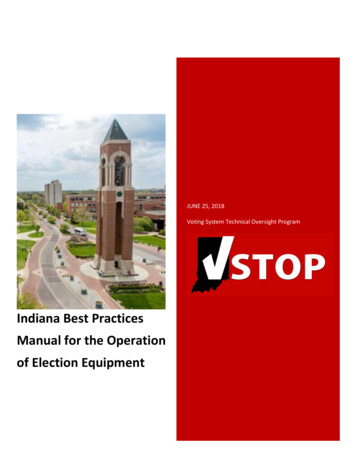
Recommendations for RoutineExtractables Testing Analyticalmethods for Routine ExtractablesTesting should be based on the analyticaltechnique(s)/method(s) used in the ControlledExtraction Studies. Consider the following:§§§§April 2007Simplicity relative to R&D methodsRuggedness and robustnessTransferabilityCost effectivenessPQRI Training Course5
Transition from Extractables StudiesMethod to Routine QC Extrables TestingRoutine Extractables Method – GC/FIDpA400350300GC/MS Extractables Profile of an Elastomer250200A bundanc e150TIC: 0240000052200000101520253035 min20000001800000Routine Extractables Method – HPLC/UV16000001400000DAD1 A, Sig 200,4 Ref 550,100 00010000001758000006000001502-propanol .00Tim e-- 35.001007550Development Method250024681012141618minQuality Control Method(s)April 2007PQRI Training Course6
Routine Extractables Testing- MethodDevelopment and Validation-References1.2.3.4.5.April 2007ICH Harominzed Tripartite Guideline, “Text on Validation ofAnalytical Procedures Q2A”, International Conference onHarmonization of Technical Requirements for Registration ofPharmaceuticals for Human Use.ICH Harominzed Tripartite Guideline, “Validation of AnalyticalProcedures: Methodology Q2B”, International Conference onHarmonization of Technical Requirements for Registration ofPharmaceuticals for Human Use.“Reviewer Guidance – Validation of Chromatographic Methods”,Center for Drug Evaluation and Research (CDER), United StatesFood and Drug Administration, November, 1994.“Guidance for Industry – Analytical Procedures and MethodsValidation – Chemistry, Manufacturing, and ControlsDocumentation”, Draft Guidance, Center for Drug Evaluation andResearch (CDER), United States Food and Drug Administration,August, 2000.Michael E. Swartz and Ira S. Krull, Analytical Method Developmentand Validation, Marcel Dekker, Inc., New York, 1997.PQRI Training Course7
Routine Extractables Testing- Method Developmentand Validation Extraction procedures for critical componentsshould be based on the optimized procedures fromthe quantitative Controlled Extraction Studies§ Demonstrate asymptotic levels of extractables. Thelinear dynamic range of the analytical methodshould be established based on levels ofextractables anticipated from quantitativeControlled Extraction Studies The Limit-of-Quantitation of the method should beestablished with consideration of the appropriateAET.April 2007PQRI Training Course8
Routine Extractables Testing- MethodDevelopment and Validation (cont.) Method validated according to the ICH validationcharacteristics of a quantitative impurity test,§ Include: Accuracy, Precision (Repeatability, IntermediatePrecision), Specificity, Limit-of-Quantitation (LOQ), Linearity, andRange.§ System Suitability parameters should be established§ Robustness should be evaluated§ Note that in certain cases it may be appropriate to validate routineextractables methods as “Limit Tests”, in which case onlySpecificity and Limit-of-Detection (LOD) need be considered. Accuracy can be determined through the analysis of spikedsamples.§ Spiking matrix could be an extract taken through the extractionprocedure minus the component sample.§ Spiking levels should be chosen so as to be representative ofanticipated extractables levels based on results from quantitativeApril 2007 Controlled Extraction Studies.PQRI Training Course9
Specifications and AcceptanceCriteria for Leachables Leachablesspecifications should include a fullyvalidated analytical test method. Acceptance criteria for leachables should applyover the proposed shelf-life of the drug product,and should include:§ Quantitative limits for known drug product leachablesmonitored during product registration stability studies.§ A quantitative limit for “new” or “unspecified” leachablesnot detected or monitored during product registrationstability studies.April 2007PQRI Training Course10
Specifications and Acceptance Criteria forLeachables Quantitativeacceptance criteria should be basedon safety considerations as outlined in the ‘L&EBest Practices‘§ Actual leachables levels, and trends in leachables levels,observed over time and across various storageconditions and drug product orientations during productregistration stability studies should be considered. Abilityto consistently meet should be establishedwith appropriate statistical analysis.April 2007PQRI Training Course11
Specifications and Acceptance Criteria forLeachables Comprehensivecorrelation should obviate the need forroutine implementation of drug product leachablesspecifications and acceptance criteria, assuming:§ Adequate information from critical component suppliers§ Understanding and control of critical componentfabrication§ Controlled Extraction Studies on critical components.§ Validated leachables methods and a Leachables Study.§ Validated Routine Extractables Testing methods anddatabase of critical component extractables profiles.§ Appropriate specifications and acceptance criteria forextractablesApril 2007PQRI Training Course12
Specifications and Acceptance Criteria forExtractables RoutineExtractables Testing should be performedon OINDP critical components prior to drugproduct manufacture. Critical components should be released to drugproduct manufacture based on definedspecifications and acceptance criteria establishedthrough:§ Understanding of critical component composition(s),ingredients, and compounding/fabrication processes.§ Comprehensive Controlled Extraction Studies.§ A significant database of extractables profiles obtainedwith validated Routine Extractables Testing methods.§ A complete leachables/extractables correlation.April 2007PQRI Training Course13
Specifications and Acceptance Criteria forExtractables Acceptancecriteria for OINDP criticalcomponent extractables can include thefollowing:§ Confirmation of extractables identified inControlled Extraction Studies.§ Quantitative limits for extractables identified inControlled Extraction Studies.§ A quantitative limit for ”new” or “ unspecified”extractables not detected during ControlledExtraction Studies.April 2007PQRI Training Course14
Establishing Specifications:Widgets vs. Pills Rest Pharmaceuticalsof World (Planes,Trains & Automobiles )§ Known requirementsthat must be met toinsure productperformance§ Establish that process iscapable of meetingrequirementsApril 2007PQRI Training Course§ Vaguely knownrequirements (vsproduct performance)§ Establish requirementsfrom vaguely knownprocess capabilities15
Statistical Tools Related toSpecifications ProcessCapability & Performance Analysis§ Statistical evaluation of process variability with respectto limits§ Typically includes both process and measurementvariability OperatingCharacteristic Curves§ Statistical evaluation of decision making process relatedto an individual test§ Considers influence of different test structures: numbersof samples, average vs. individuals, tiered testing April 2007PQRI Training Course16
Types of Quality Inspections Inspectionby Attributes§ Defect testing (pass/fail by unit)Visual inspection of containers for foreign material or defectsSpray test of MDIs Inspectionby Variables§ Estimation of Batch Parameters (centraltendency, variability)HPLC Assay of tablets for active ingredientDelivered Dose Uniformity of an MDIContent Uniformity of a tabletLeachable/extractable testingApril 2007PQRI Training Course17
What we would like to have toestablish/verify acceptance criteria:April 2007PQRI Training Course18
What we typically have toestablish acceptance criteria:Impurity X0.240.070.15NDApril 2007PQRI Training Course19
Performance of Limits Established withSmall DatasetsRobustness of Establishing Acceptance Criteria with Small Datasets(limits established via /- 3 standard deviations)Variablen 3n 4n 5n 6n 7n 8n 9n 10n 20Risk of obtaining limits worsethan the associated compliance rate1008060402000.0April 20070.20.40.60.8Fraction of Results Complying with LimitsPQRI Training Course1.020
Comparison of DifferentApproaches to Setting LimitsComparison of Different Approaches to Establishing Limitsn 7Risk of obtaining limits worsethan the associated compliance )3 stdmin/max95/9599/998060402000.1April 20070.2 0.3 0.4 0.5 0.6 0.7 0.8 0.9 1.0Fraction of Results Complying with LimitsPQRI Training Course21
Process Capability & Performance ProcessCapability: Statistical comparison ofinherent process variability (common causevariability only) to some limits. Generally,represents the best possible performance. Process Performance: Statistical comparisonof the total observed variability to somelimits. May include special cause variability.April 2007PQRI Training Course22
Process Capability Several different ‘Capability Indices’ existDesigned to show whether process measurement arecapable of meeting limitsCp (USL-LSL)/6σwCpk Min{[(USL-Avg)/3σw],[(Avg-LSL)/ 3σw]} Minimum Cpk of 1.33 expected for new processCp Cpk when process is ‘centered’Above is for two-sided limit, for a one-sided limit Cp ismeaningless and Cpk considers only the range to thespecified limitApril 2007PQRI Training Course23
Process Performance Several different ‘Performance Indices’ existDesigned to show process measurement performancerelative to limitsPp (USL-LSL)/6σPpk Min{[(USL-Avg)/3σ],[(Avg-LSL)/ 3σ]} Minimum Ppk of 1.33 expected for new processPpk Cpk when no ‘special cause’ source of errorAbove is for two-sided limit, for a one-sided limit Pp ismeaningless and Ppk considers only the range to thespecified limitApril 2007PQRI Training Course24
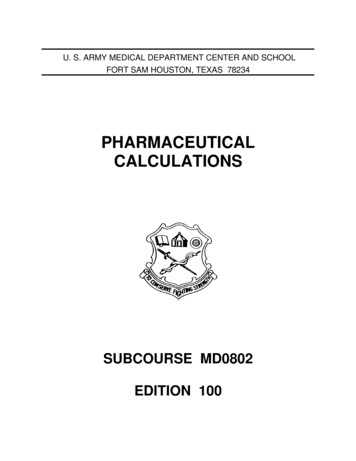
Example Cp,Cpk,Pp,Ppk Consider a set of extractable data collected as follows:§ 5 gaskets where sampled from each of 10 lots of gaskets§ The level of extractable “A” was determined for all 50samples§ Based on tox information and a leachables correlation anupper limit of 120 ppm is being considered§ Normally an extractable limit is a one-sided limit, but for sakeof this example suppose we are also interested in a lowerlimit i.e. 80 ppm (this allows calculation of Cp & Pp which aremeaningless for a one-sided limit) Can the gasket manufacturing process support this limit?What else can we conclude about the gasket process?April 2007PQRI Training Course25
April 2007PQRI Training Course26
Calculating Cp, Cpk, Pp, PpkUsing actual numbers from previous figure:Note: Std Dev (s) can be estimated from range (R) by s R/d2d2 is a tabulated by n; for n 5, d2 2.33April 2007PQRI Training Course27
Calculating Cp, Cpk, Pp, PpkCp (120-80)/(6)(5.25) 1.27Cpk min[(120-99.1)/(3)(5.25)],[(99.1-80)/(3)(5.25) ] 1.21Pp (120-80)/(6)(8.72) 0.76Ppk min[(120-99.1)/(3)(8.72)],[(99.1-80)/(3)(8.72)] 0.73April 2007PQRI Training Course28
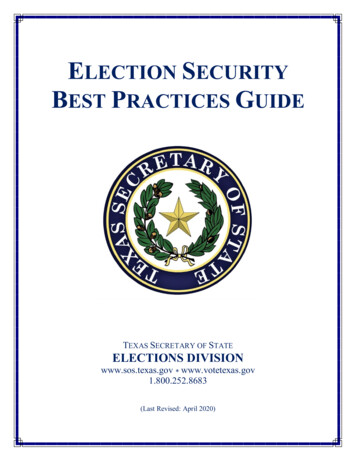
Process Capability/Performanceusing MINITAB Capability HistogramXbar Chart1Sample Mean1101UCL 106.18X 99.09100LCL 92.019012345161789108090Sample Range120A D: 0.413, P : 0.326UCL 25.9720R 12.28100LCL 01234567891080100120Capability PlotLast 10 Subgroups120Values110Normal Prob PlotR ChartWithinS tDev 5.28118Cp1.26C pk1.2C C pk 1.2610080WithinO v erallO v erallS tDev 8.76404Pp0.76P pk0.73C pm*S pecs2April 200710046Sample810PQRI Training Course29
Designing & Evaluating Test Structures:Operating Characteristic CurvesQuality Decisions:Possible Outcomes andConsequencesTrue SituationBatch is of AcceptableQualityBatch is not of AcceptableQualityAccept BatchCorrect DecisionType II error (β)(‘consumer’s risk’)Reject BatchType I error (α)(‘producer’s risk’)Correct DecisionDecisionApril 2007PQRI Training Course30
Quality Standards vs.Acceptance CriteriaQuality Standard: All units must have anassay greater than 95%Test Acceptance Criteria: Assay of 2 of 2 Samplesmust be between 98102%Quality standard shoulddrive acceptance criteriaand test structureOCCs used in this contextApril 2007PQRI Training Course31
Operating Characteristic Curves Usedto characterize the statistical qualities of thedecision making process associated with aparticular test’s structure/form§ Test structure/form includes: numbers of samples,limits, tiers, decision process flow, quaniti(es)compared to limit Commenton the ability of the test structure todiscriminate between acceptable andunacceptable ‘batches’ Allows estimation of type I & II error rates§ risk of failing an acceptable batch§ risk of passing an unacceptable batchApril 2007PQRI Training Course32
Operating Characteristic Curves Plotof the probability of acceptance (orrejection) vs. the quality variable§ P(accept) vs. true batch mean§ P(accept) vs. true batch standard deviation§ P(accept) vs. true % defects Constructedusing the appropriatecumulative density probability distributionApril 2007PQRI Training Course33
Ideal OC CurvesIdeal Operating Characteristic CurveIdeal Operating Characteristic CurveOne-Sided Limit ( 80.20.80.01.00.01.05075100True Mean (of Bat ch)125Probability of Acceptance0.015060708090True Mean (of Bat ch)100Probability of Rejection1.0Probability of RejectionProbability of AcceptanceTwo-Sided Limit (85-115)110Ideal Operating Characteristic Curve1.00.00.80.20.60.40.40.60.20.81.00.00April 2007Probability of RejectionProbability of AcceptanceVariability Limit (std. dev. 2.5)123True Std. Dev. (of Batch)PQRI Training Course4534
Typical OC CurvesReal Operating Characteristic 0.80.20.80.01.00.01.0Probability of A cceptance0.0Probability of Rejection1.0Probability of RejectionProbability of AcceptanceReal Operating Characteristic CurveTrue Mean (of Batch)True Mean (of Batch)Real Operating Characteristic Curve0.00.80.20.60.40.40.60.20.80.01.0Probability of RejectionProbability of A cceptanceVariability Limit1.0True Std. Dev. (of Batch)April 2007PQRI Training Course35
Risks Associated with Testingin Relation to Operating Characteristic Curve10Risk of rejectingacceptable ing QualityRisk of acceptingunacceptable lot10708090100110120130True MeanApril 2007PQRI Training Course36
Process for Constructing OC Curves:p(accept) vs. Mean Need model probability distribution for individualmeasurementsNeed estimate of standard deviation§ Curve is for an assumed standard deviation of the individualmeasurements Calculate probability to accept for a given value of themean from the appropriate cumulative density probabilitydistribution based on the test constructAlternatively can estimate through numeric approachRepeat over range of means of interestApril 2007PQRI Training Course37
Example Calculations OC Curve:Sample mean compared to a two-sided limit1 ( y µ ) 2 / 2σ 2 Normal Distribution:f ( y) eσ 2π Needareas underdistribution No analytical solution Numeric approachesused leading totabulations of cdf:cumulative densityfunctionApril 2007PQRI Training Course38
Example Calculations OC Curve:Sample mean compared to a two-sided limit Foreach point on the OC Curve, need tocalculate area under distribution (μ,σ)between limits, i.e. prob(accept) for a givenvalue of the mean (μ) Consider two sided limits of 95-105 and σ 2§ σ: standard deviation of sample means§ This σ related to σ of individual measurementsby a factor of 1/ nApril 2007PQRI Training Course39
Example Calculations OC Curve:Sample mean compared to a two-sided limit For example, to calculate p(accept) at μ 99 firstconvert limits to standardized units (z)(95-99)/2 -2; (105-99)/2 3From tabulation of CDF or stat program:§§§April 2007Area below z -2 is 0.02275Area above z 3 is 0.00135Area between z -2 to z 3 is1-0.02275-0.00135 0.97590PQRI Training Course40
Example Calculations OC Curve:n of n compared to a two-sided limit Followabove procedure to calculate theprob(accept) a single value. The probability to accept n of n values is:nP(accept1) If the previous example instead required 3of 3 results to be within 95-105, thenP(accept) (0.97590)3 0.92943April 2007PQRI Training Course41
Influence of Different Test Designson the OC Curve Tests§§§April 2007Designed to Control MeanVary n, set requirement on sample meanVary n, set requirement on individual valuesInfluence of acceptance criteriaPQRI Training Course42
Control on Batch MeanImprovement in OC Curve as Sample Size IncreasesAcceptance Criteria: Sample Mean 1001.00.0p(reject)p(accept)n 9n 10.5n 3n 5n 70.080901001.0110120true meanApril 2007PQRI Training Course43
Control on Batch MeanEffect on OC Curve as Sample Size Increasesfor n of n RequirementAcceptance Criteria: n of n 1001.00.0p(reject)p(accept)n 1n 30.5n 5n 7n 90.01.08090100110120true meanApril 2007PQRI Training Course44
Relationship of OC Curve toSpecification Limits (one sided)April 2007PQRI Training Course45
Relationship of OC Curve toSpecification Limits (two rue meanApril 2007PQRI Training Course46
Conclusions & Final Thoughts Appropriatereflect:L&E testing schemes should§ In-depth understanding of componentcomposition and the L&E characteristics of theproduct/component§ Thoughtful selection of critical tests§ Robust validated methods§ Statistical design and evaluation of tests andacceptance criteriaApril 2007PQRI Training Course47
April 2007 PQRI Training Course 4 Routine Extractables Testing Performed on all critical components of OINDP container closure systems with following general goals: To establish extractables acceptance criteria for OINDP critical container closure system components. To help ensure that the leachables profile in the drug