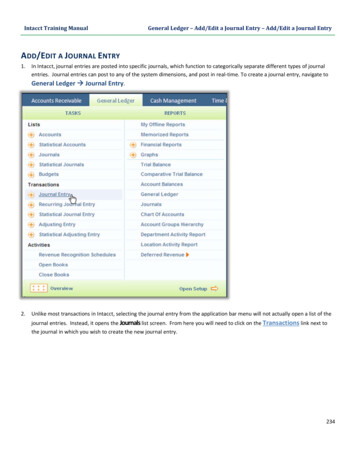
Transcription
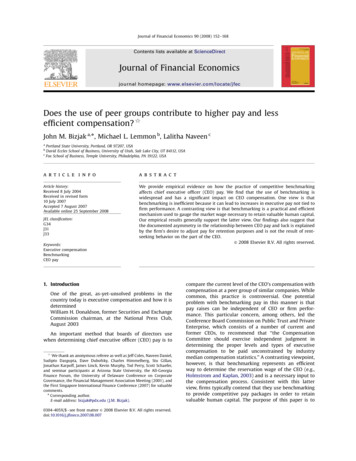
ARTICLE IN PRESSJournal of Financial Economics 90 (2008) 152–168Contents lists available at ScienceDirectVolume 88, Issue 1, April 2008ISSN 0304-405XManaging Editor:G. WILLIAM SCHWERTFounding Editor:MICHAEL C. JENSENAdvisory Editors:EUGENE F. FAMAKENNETH FRENCHWAYNE MIKKELSONJAY SHANKENANDREI SHLEIFERCLIFFORD W. SMITH, JR.RENÉ M. STULZJournal of Financial Economicsjournal homepage: www.elsevier.com/locate/jfecJOURNAL OFFinancialECONOMICSAssociate Editors:HENDRIK BESSEMBINDERJOHN CAMPBELLHARRY DeANGELODARRELL DUFFIEBENJAMIN ESTYRICHARD GREENJARRAD HARFORDPAUL HEALYCHRISTOPHER JAMESSIMON JOHNSONSTEVEN KAPLANTIM LOUGHRANMICHELLE LOWRYKEVIN MURPHYMICAH OFFICERLUBOS PASTORNEIL PEARSONJAY RITTERRICHARD GREENRICHARD SLOANJEREMY C. STEINJERRY WARNERMICHAEL WEISBACHKAREN WRUCKPublished by ELSEVIERin collaboration with theWILLIAM E. SIMON GRADUATE SCHOOLOF BUSINESS ADMINISTRATION,UNIVERSITY OF ROCHESTERAvailable online at www.sciencedirect.comDoes the use of peer groups contribute to higher pay and lessefficient compensation? John M. Bizjak a, , Michael L. Lemmon b, Lalitha Naveen cabcPortland State University, Portland, OR 97207, USADavid Eccles School of Business, University of Utah, Salt Lake City, UT 84112, USAFox School of Business, Temple University, Philadelphia, PA 19122, USAa r t i c l e i n f oabstractArticle history:Received 8 July 2004Received in revised form10 July 2007Accepted 7 August 2007Available online 25 September 2008We provide empirical evidence on how the practice of competitive benchmarkingaffects chief executive officer (CEO) pay. We find that the use of benchmarking iswidespread and has a significant impact on CEO compensation. One view is thatbenchmarking is inefficient because it can lead to increases in executive pay not tied tofirm performance. A contrasting view is that benchmarking is a practical and efficientmechanism used to gauge the market wage necessary to retain valuable human capital.Our empirical results generally support the latter view. Our findings also suggest thatthe documented asymmetry in the relationship between CEO pay and luck is explainedby the firm’s desire to adjust pay for retention purposes and is not the result of rentseeking behavior on the part of the CEO.& 2008 Elsevier B.V. All rights reserved.JEL classification:G34J31J33Keywords:Executive compensationBenchmarkingCEO pay1. IntroductionOne of the great, as-yet-unsolved problems in thecountry today is executive compensation and how it isdeterminedWilliam H. Donaldson, former Securities and ExchangeCommission chairman, at the National Press Club,August 2003An important method that boards of directors usewhen determining chief executive officer (CEO) pay is to We thank an anonymous referee as well as Jeff Coles, Naveen Daniel,Sudipto Dasgupta, Dave Dubofsky, Charles Himmelberg, Stu Gillan,Jonathan Karpoff, James Linck, Kevin Murphy, Tod Perry, Scott Schaefer,and seminar participants at Arizona State University, the All-GeorgiaFinance Forum, the University of Delaware Conference on CorporateGovernance, the Financial Management Association Meeting (2001), andthe First Singapore International Finance Conference (2007) for valuablecomments. Corresponding author.E-mail address: bizjak@pdx.edu (J.M. Bizjak).0304-405X/ - see front matter & 2008 Elsevier B.V. All rights reserved.doi:10.1016/j.jfineco.2007.08.007compare the current level of the CEO’s compensation withcompensation at a peer group of similar companies. Whilecommon, this practice is controversial. One potentialproblem with benchmarking pay in this manner is thatpay raises can be independent of CEO or firm performance. This particular concern, among others, led theConference Board Commission on Public Trust and PrivateEnterprise, which consists of a number of current andformer CEOs, to recommend that ‘‘the CompensationCommittee should exercise independent judgment indetermining the proper levels and types of executivecompensation to be paid unconstrained by industrymedian compensation statistics.’’ A contrasting viewpoint,however, is that benchmarking represents an efficientway to determine the reservation wage of the CEO (e.g.,Holmstrom and Kaplan, 2003) and is a necessary input tothe compensation process. Consistent with this latterview, firms typically contend that they use benchmarkingto provide competitive pay packages in order to retainvaluable human capital. The purpose of this paper is to
ARTICLE IN PRESSJ.M. Bizjak et al. / Journal of Financial Economics 90 (2008) 152–168provide evidence on how this practice affects pay levelsand to understand which of these two alternative viewsbetter explains the economic motivation for the use ofcompetitive benchmarking.We begin by providing some analysis on the prevalenceof this practice. We review compensation committeereports of 100 firms chosen randomly from the Standardand Poor’s (S&P) 500 index in 1997 and find thatbenchmarking is used extensively, with 96 firms indicating that they use benchmarking or peer groups todetermine the levels of executives’ salary, bonus, andoption awards. The vast majority of the firms that use peergroups target pay levels at or above the 50th percentileof the peer group, although a number of firms seek paylevels well above the peer group median. For example,both Coca-Cola and IBM consistently aim for pay levels inthe upper quartile of their peers. We find that peer groupsare typically based on industry and size.Second, we directly examine how benchmarking isrelated to pay using a sample of CEOs in the Execucompdatabase over the period 1992–2005. Controlling fornumerous economic factors that have been shown toaffect compensation, such as market and accountingperformance, firm size, and CEO tenure, we find thatCEOs who are paid below the median level of theirindustry- and size-matched peers receive increases intotal pay that are 1.3 million per year greater than theraises received by their counterparts whose pay is abovethe peer group median. In each year, approximately onethird of executives with pay below the peer group medianreceive pay adjustments that move them to or above themedian level of pay for their peer group. We also find thatthe effect of peer group benchmarking on changes in payis considerably larger than the effect of stock priceperformance on changes in pay. These findings indicatethat the use of competitive benchmarking is an importantcomponent in determining executive pay.Third, we provide evidence on whether benchmarkingis associated with rent extraction on the part of the CEO orwhether the practice serves as a mechanism for firms toset a sufficient reservation wage to retain CEO talent. Weattempt to distinguish between these competing hypotheses in several different ways. We start by examining thefactors that are related to whether or not executives withpay below the peer group median receive pay increasesthat place them at or above the peer group median.Executives who have shorter tenure and whose firmsexhibit better performance are more likely to receive payincreases that put them above the peer group median.These findings are consistent with the board learningabout the ability of the CEO over time (Murphy, 1986) andrewarding CEOs with greater ability. In addition, we findthat CEOs are more likely to receive pay increases thatbring them to competitive levels if they operate in tighterlabor markets. This result is consistent with claims by thecompensation committee that benchmarking is done toretain valuable human capital and is similar to theconclusions in Carter and Lynch (2001) and Chidambaranand Prabhala (2003), who find that labor market considerations play a significant role in firms’ decisions toreprice employee stock options.153We also examine the effect of corporate governance onthe likelihood of receiving a pay increase that places theCEO at or above the median pay level of the peer group.We use several measures of the quality of corporategovernance, including the shareholder rights index ofGompers, Ishii, and Metrick (2003), institutional holdings,and board composition. We find no systematic evidencethat the use of benchmarking is related to proxies thatwould indicate poor corporate governance. These findingssuggest that the use of peer group benchmarking is morerelated to economic variables (such as performance andlabor market conditions) and less related to variablesindicative of managerial entrenchment (such as weakcorporate governance).Fourth, we examine how CEO turnover is affected bythe level of the CEO’s pay relative to peers. Controlling forother factors that affect turnover, we find that theprobability of CEO turnover is higher in firms with CEOswhose pay is below the median pay level of the peergroup, but this probability decreases (weakly) if the CEOsubsequently receives a pay increase that moves himabove the peer group median level of pay. We also findthat the sensitivity of CEO turnover to firm performancedoes not differ with the relative pay status of the CEO. Theresults on CEO turnover indicate that, while CEOs withpay below the peer group median do receive larger payadjustments on average, they also face higher rates ofturnover. We argue that these results are not consistentwith the idea that benchmarking is used opportunisticallybut are consistent with a retention motive for benchmarking. Further analysis of the employment outcomesfor CEOs with pay below the peer group median who leavetheir firms also supports the retention view. Only 5.2% ofdeparting CEOs obtain a new top executive position atanother firm in the Execucomp universe. In addition, firmperformance for the CEOs who depart for another topexecutive position is better compared with firm performance for departing CEOs who do not subsequently takesimilar positions at other firms. They also move to largerfirms and obtain substantial increases in pay that, onaverage, are above the median compensation levels of thepeer group associated with their old firm.Finally, we examine the degree to which benchmarkingcan explain the established pay-for-luck phenomenon(Garvey and Milbourn, 2006). Garvey and Milbourn findthat CEOs are paid more for good luck than they arepunished for bad luck. They conclude that their finding ofan asymmetry in pay for luck is indicative of the CEO’sability to act opportunistically in setting pay. We argue fora different conclusion and contend that the asymmetry inpay for luck is more consistent with the use of benchmarking by firms to gauge the market reservation wagefor their executives when the outside opportunities of theCEO are correlated with market- and industry-widefactors (i.e., luck) as suggested by Oyer (2004).The results are generally consistent with this view. Wefind no asymmetry in the relation between pay and luckfor CEOs with current pay levels above that of their peers(i.e., highly paid CEOs) but significant asymmetry in theresponse of pay to luck for CEOs whose current pay isbelow that of their peers. All of the asymmetry in the
ARTICLE IN PRESS154J.M. Bizjak et al. / Journal of Financial Economics 90 (2008) 152–168sensitivity of pay to luck shown in Garvey and Milbournis found in the group of CEOs with pay below the peergroup median. In addition, we find no evidence that theasymmetry in the sensitivity of pay to luck in either paygroup is associated with weaker corporate governance.Together, the results are inconsistent with the view thatasymmetry in the response of pay to luck is driven byopportunistic behavior of CEOs who have captured thepay process. Instead, we view the results as moresupportive of the idea that the relation between pay andluck is an artifact of the use of competitive benchmarkingas a tool for gauging the reservation wage of the CEO.The remainder of this paper is organized as follows.Section 2 uses data from corporate proxy statements toprovide a description of how firms use peer groups andcompetitive benchmarking to set executive pay. Section 3provides empirical evidence on how benchmarking affectsCEO pay. Section 4 examines the motivations behind theuse of competitive benchmarking and provides evidenceon the association between the use of benchmarking andthe pay for luck relation. Section 5 concludes. Finally, theAppendix contains a sample of compensation committeereports that discuss the use of competitive benchmarking.2. How firms benchmark payMost firms use a compensation committee composedof members of the board of directors to structureexecutive pay. Typically, the compensation committeerelies on research and recommendations from the humanresource department oftentimes working in conjunctionwith outside consultants [see Murphy (1999) and Jensen,Murphy, and Wruck (2005) for a more detailed discussionof the use of compensation consultants]. As a basis foranalyzing pay practices within the firm, consultants andthe compensation committee often use information onpay practices at comparison or peer companies, which areusually similar-size firms from the same industry. In mostfirms, salary and, either directly or indirectly, targetbonuses and option pay are anchored to the peer group.In assessing target pay levels, salary and bonus and totalpay below the 50th percentile are usually consideredbelow market.To provide some initial evidence on how peer groupsare used to determine executive compensation, Table 1summarizes information on the use of peer groups for arandom sample of 100 firms listed in the S&P 500 index.Data come from 1997 corporate proxy statements. Firmsare given some flexibility in what they are required toreport in the proxy statements. Consequently, the evidence presented in this section is primarily descriptive.Nevertheless, it sets the stage for our empirical analysis inthe sections that follow.We find that the use of peer groups is widespread. Asseen in the table, 96 of the 100 firms report that peergroups are used in determining compensation. Two firmsreport that they do not use peer groups, and two firms donot mention peer groups in the proxy. Firms seldomreport the exact composition of the peer group used. Theoverwhelming majority of firms (92), however, report theTable 1Descriptive analysis of the use of peer groups by firms to structure chiefexecutive officer (CEO) compensation. The table contains data on thenumber of firms that use peer groups in setting CEO pay, the number offirms that use compensation consultants, the type of pay that is targeted,the number of firms that use median as the target benchmark, thenumber of firms that use relative performance evaluations, and thenumber of firms that use the same peer group in the performance graphand compensation comparison purposes. Data come from a randomsample of one hundred firms contained in the Standard & Poor’s 500.Most of the information is from the compensation committee report onexecutive pay contained in the corporate proxy statements for 1997. Thenumber of firms that report the use of compensation consultants whenestablishing pay is probably understated, because firms are not requiredto mention whether outside consultants are used.Compensation characteristicsNumber offirmsNumber of firms that mention using peer groups toset executive pay as reported in the compensationcommittee report on executive pay96Number of firms that report the use ofcompensation consultants when establishing pay65Number of firms that mention targeting at leastone component of pay at or above the peer groupmedian or mean as reported in the compensationcommittee report on executive pay73Number of firms that mention firm size or industryor an equivalent when establishing the peer groupfor compensation comparisons as reported in thecompensation committee report on executive pay92Number of firms that state they use relativeperformance evaluation when making comparisonto the peer group as reported in the compensationcommittee report on executive pay15Number of firms that use different peer groups forcompensation comparisons and stock-priceperformance comparisons (the latter beingrequired by the SEC) as reported in thecompensation committee report on executive pay90use of peer groups based to some degree on size orindustry or both.1 Seventy-three firms mention targetingone or more of the components of pay at either themedian or mean of the peer group.2 Five firms mentiontargeting salary below the mean or median of their1Size and industry, however, are not the only comparison criteriaused. For example, the 1997 proxy statement of Ball Corp. states that forcomparison purposes the company examines ‘‘the pay of similarlysituated executives at other manufacturing firms of similar size (basedupon total employment and sales), capital structure, customer base,market orientation and employee demographics.’’2While not all the components of pay are always discussed as beingevaluated relative to a peer group, our reading of the compensationcommittee reports seems to indicate that in most cases all of thecomponents of pay are set relative to a peer. For example, somecompanies mention only salary as being set comparable to a peer and donot discuss that bonuses or option pay are directly evaluated relative tothe comparison group. In these cases, however, both bonus pay andoption pay are set as a multiple of salary. Consequently, any correction ofsalary to adjust pay to the peer also is reflected in the other componentsof pay.
ARTICLE IN PRESSJ.M. Bizjak et al. / Journal of Financial Economics 90 (2008) 152–168respective benchmarks. In these cases, however, whilesalary is set below the median, bonus and option pay is setat or above the median (Green Tree Financial Services Inc.is one example). For 23 of the firms, no specific targetrelative to the benchmark is mentioned, even though thefirms use peer groups to set salary or other components ofpay. The Appendix contains selected passages from thecompensation committee reports for a number of firms,which further illustrate how firms use competitivebenchmarking in setting pay.While the analysis above suggests that the use of peergroups is common, the practice has generated considerable controversy. One potential problem with setting payusing peer groups is that the practice could institutionalize increases in the different components of pay that arenot directly linked to performance measures. In themajority of the proxy statements analyzed, no mentionwas made that the values of the actual bonus or optiongrants were given for performance that met or exceededthat of the peer group.3 Others have also spoken outabout the use of competitive benchmarking. For instance,Walter Wriston, former chairman and CEO of Citicorp, andmember of the compensation committee at GeneralElectric Co stated, ‘‘[Setting compensation] has become agiant ratchet. Every board’s compensation committeeopens with: Here is a graph of the compensation of the50 largest companies in America, and our sterling CEO isin the third quartile. So you’re getting these huge salariesy. [and] some of the highest-paid people have had theworst performance’’ (Wall Street Journal, 1991). Morerecently, Edgar Woolard Jr., former CEO of Dupont anddirector at firms such as IBM, Apple, and Citigroup,commented that ‘‘the main reason compensation increases every year is that boards want their CEO to be inthe top half of the CEO peer group, because they think itmakes the company look strong’’ (Harvard BusinessReview, 2003, p. 72).Further, Hall (2003) notes that ‘‘the proposition thatthe increased use of compensation surveys has contributed to the rise in executive pay is consistent with y theviews of practitioners—including executives and compensation consultants themselves.’’ Similarly, Jensen, Murphy,and Wruck (2005, p. 56) state, ‘‘We believe that themisuse of survey information provided by compensationconsultants has led to systematic increases in executivepay levels. y [T]he surveys have contributed to a ‘ratchet’effect in executive pay levels.’’Others have responded to these concerns by arguingthat competitive benchmarking is necessary to determinemarket wages for purposes of attracting, retaining, and3The peer group that is used to analyze compensation is oftendifferent from the peer group that is used in the performance graph,which firms are required to present in the proxy. One company welooked at, Amoco Inc., discussed how the pay raises for the current yearwere given to raise pay levels to the industry median. Amoco, however,had underperformed the companies selected in the performance graphfor the last couple of years. Byrd, Johnson, and Porter (1998) discuss theselection of firms reported in the performance graphs contained in proxystatements, and Faulkender and Yang (2007) examine the choice of peergroup firms for 83 companies that reported the firms used forcompensation comparisons in 2005.155motivating employees. Jensen, Murphy, and Wruck (2005)point out that ‘‘the managerial labor market has becomerelatively more important for top executives in the US’’.Consequently understanding the wages in the externalmarket for CEOs has become more important. Withouthaving information on the executives’ outside opportunities, it can be difficult to set a wage rate that provides alevel of pay necessary for retention purposes. Becausewages are set in a competitive labor market, the use ofbenchmarking is necessary to determine the market wage.Holmstrom and Kaplan (2003) argue that ‘‘[t]he mainproblem with executive pay levels is not the overall level,but the extreme skew in the awards y. To deal with thisproblem, we need more effective benchmarking, not lessof it.’’ We explore these contrasting viewpoints in greaterdetail in Section 4.3. The effect of competitive benchmarking on CEO payThe discussion in Section 2 suggests that the practiceof competitive benchmarking is widespread and animportant part of how executive compensation is set. Todate, however, almost no empirical research shows thedegree to which benchmarking affects overall pay levels.In this section, we begin by examining how the practice ofcompetitive benchmarking affects the level of CEO pay.3.1. Compensation dataCompensation data used for the analysis in the rest ofthe paper come from the Standard & Poor’s Execucompdatabase for the period 1992–2005. We focus on individuals classified as CEOs by Execucomp. The databaseindicates the dates when the CEO assumed office andwhen the CEO left office but, in some cases, fails toidentify an executive as the CEO even though he or sheappears to be the CEO based on these dates. We classifythese individuals also as CEOs. We restrict our analysis toCEOs who have at least 2 years of tenure. This ensures thatwe do not consider pay increases of individuals who wereappointed as CEOs during the year and thus received CEOcompensation only for part of the year. Because compensation data are highly skewed, we winsorize the compensation variables at the 1st and 99th percentile levels.All of our subsequent results using the raw data arequalitatively similar to those reported.Table 2 presents summary statistics for the sample.The primary compensation measure we use is total pay,which consists of salary, bonus, new option grants, grantsof restricted stock, and long-term incentive payouts. Othermeasures of pay we consider are cash compensation(salary and bonus) and the Black and Scholes valueof option grants each year. Mean cash compensation(salary and bonus), mean option compensation, and themean total compensation for our sample, stated in 2005dollars, are 1.55 million, 2.51 million, and 5.01 million,respectively. The mean change in total pay over thesample period is 359,000. These numbers are comparable to those reported in other recent studies that use
ARTICLE IN PRESS156J.M. Bizjak et al. / Journal of Financial Economics 90 (2008) 152–168Table 2Summary statistics on compensation and firm characteristics. The sample covers the period 1992–2005. Data on chief executive officer (CEO)compensation are obtained from Execucomp. Financial information is from Compustat. Cash compensation includes salary and bonus. OPTION is the Blackand Scholes value of stock option grants each year as provided in Execucomp. Total compensation includes salary, bonus, other annual compensation, totalvalue of restricted stock granted, total value of stock options granted (using Black and Scholes), long-term incentive payouts and all other. Dcashcompensation is cash compensationt cash compensationt 1. DOPTION and Dtotal compensation are similarly defined. ROA is the ratio of earnings beforeinterest, taxes, depreciation, and amortization (EBITDA) to assets. Return is the annual stock return for the fiscal year. All dollar values are in 2005 dollars.Only CEOs with at least 2 years of tenure (as CEO) are considered.Compensation or firm characteristicMeanMedianMinimumMaximumNumber of observationsCash compensation (thousands of dollars)OPTION (thousands of dollars)Total compensation (thousands of dollars )Dcash compensation (thousands of dollars )DOPTION (thousands of dollars)Dtotal compensation (thousands of dollars)Sales (millions of dollars)Annual stock returnReturn on 2,3714501221,2130.120.13000 2,062 19,537 22,5890.18 0.98 15,32915,191Execucomp data (for example, Garvey and Milbourn,2006; Himmelberg and Hubbard, 2000).3.2. Construction of compensation peer groupsTo analyze the influence of peer groups on compensation we need to rank executives based on their pay levelsrelative to those of their peers. As discussed in Section 2,however, firms seldom report the actual composition oftheir compensation peer groups. Based on evidence fromthe compensation committee reports that most peergroups appear to be based on firms of similar size (usuallybased on revenues) and in similar industries, we constructproxies for peer group pay levels in the followingmanner.4First, for each year, and within each industry [two-digitstandard industrial classification (SIC)], we rank all firmsaccording to the prior year’s sales. We classify firms asbeing in the large (small) firm group if they have salesabove (below) the median sales in the industry. Second,we rank all firms within each industry and sales categoryinto two groups based on the level of the prior periodcompensation measure. We classify executives as being inthe high (low) compensation group if their prior periodcompensation is above (below) that of the medianexecutive in the comparison group. We use the medianpay level for partitioning compensation because mostcompensation committees consider pay above the medianin an industry and size peer group to be competitive andconsider compensation levels below the median to bebelow market. This formation of two peer groups based onsize and industry should reflect the manner in which firmsform groups for compensation comparison purposes.We recognize that the partitioning is imperfect in thatnot all firms use only a size and industry comparisongrouping. To the extent that firms use other partitions4A discussion with an executive at a leading compensationconsulting firm indicated that the process as described by us andreferred to in proxy statements is an accurate portrait of howcompetitive benchmarking operates.(or do not use peer groups at all), our power to captureany effect of peer groups in setting compensation isweakened. Another concern is that CEOs handpick thepeer group to maximize their compensation. Under thisscenario we would expect CEOs to select peer firms thathave compensation much higher than their own, even iftheir pay is already above the median pay at other firms inthe peer group formed based on size and industry. Again,this misclassification weakens our ability to detect theeffects of benchmarking on pay.3.3. Analysis of the effects of competitive benchmarking onCEO compensationWe begin with analysis of the relative effects that firmperformance and competitive benchmarking have onchanges in CEO pay. Table 3 reports the results. Panel Apresents the frequency with which CEOs receive payincreases or decreases across various deciles of performance conditioned on the pay level of the CEO relative tothe peer group. Performance here is measured as thefirm’s returns for that year net of the median returns forthe peer group. We break the sample down by performance because performance is tied to changes in CEO pay(e.g., Jensen and Murphy, 1990). Our pay measure is totalcompensation.As Panel A illustrates, in both relative pay groups thefraction of CEOs receiving pay increases goes up almostmonotonically across performance deciles. More important for our purposes, in every performance decile, thefrequency of pay increases for CEOs with pay below thepeer group median is much higher than that for CEOs withpay above the peer group median. For the lowest (highest)performance decile, 51% (80%) of the CEOs with pay belowthe peer group median receive an increase in pay whileonly 31% (63%) of the CEOs with pay above the peer groupmedian receive an increase in pay. Panel B shows a similarpattern for dollar increases in compensation. The dollarincreases are considerably greater for CEOs with paybelow the peer group median for all performancedeciles.
ARTICLE IN PRESSJ.M. Bizjak et al. / Journal of Financial Economics 90 (2008) 152–168Table 3Summary statistics on pay increases as a function of performance andrelative pay status. Data on chief executive officer (CEO) compensationare obtained from Execucomp and are described in Table 2. To form peergroups, observations are ranked each year within each two-digitindustry into two sales groups (high and low) based on prior yearmedian sales. They are then ranked into two compensation groups (highand low) based on prior year median compensation. The size andindustry rankings are meant to mimic the typical peer group asdescribed in proxy statements. Firms are then grouped into performancedeciles for each year based on the firm’s stock returns in that year inexcess of the
WILLIAM E. SIMON GRADUATE SCHOOL OF BUSINESS ADMINISTRATION, UNIVERSITY OF ROCHESTER Available online at www.sciencedirect.com . Portland, OR 97207, USA b David Eccles School of Business, University of Utah, Salt Lake City, UT 84112, USA c Fox School of Business, Temple University, Philadelphia, PA 19122, USA article info Article history .
