Transcription
2017 GovernmentContractor SurveySPRING 2018
ContentsMethodology1Executive summary3Notable trends in the 2017 Survey4Key takeaways5Revenue and profits6Cost accounting7Proposal costs14Project management and contract administration18Survey feedback22
MethodologyGrant Thornton’s 2017 Government Contractor Survey is basedon information provided by companies that conduct businesswith the United States federal government as a primarycustomer. We distributed questionnaires and received responsesfrom participating companies between October and Decemberof 2017. Respondents to the 2017 survey are from small, medium,and large companies, including both publicly and privatelyowned institutions, that provide a variety of products andservices to governmental entities. Financial statistics in thesurvey relate to respondents most recently completed fiscal yearas of the date each survey was completed.Grant Thornton reviewed the data provided by respondentsto be certain it was statistically valid and representative ofthe companies that responded to the survey. However, asis inherent in any survey process, the completeness andaccuracy of submissions ultimately rests with the submittingrespondents. Data is presented in the survey as a whole orby company size when appropriate. In many instances, wealso provide data from prior years’ surveys in order to identifytrends from survey to survey. As a note, survey respondentsalso vary from year to year, so the data presented hereinshould be considered in that context when drawingconclusions or inferences from the results reported.In our 2017 Government Contractor Survey, Grant Thorntonprovides a comprehensive look at the industry through theanalysis and presentation of a wide range of metrics. Oursurvey is designed to cover areas that can directly affect thecost recovery and profitability of a government contractor andwhich help companies remain and become more competitivein the marketplace. Whether your company is an establishedgovernment contractor or a business considering entering thegovernment market, Grant Thornton hopes you will find theinformation in this survey to be useful in managing your businessnow and planning for the future.The 2017 survey is part of Grant Thornton’s continued thoughtleadership within the government contracting community andincludes practical advice in several areas to assist companiesin their effort to maintain competitiveness, profitability andcompliance. Our goal is to ensure that our survey continues toevolve and provide those interested in government contractingwith the most useful and insightful information possible.This survey would not have been possible without ourgenerous sponsors as well as the participation of the dozens ofcompanies that filled out the survey. We sincerely appreciatethe participation of the many companies that contributedto this effort. In particular, we want to thank the ProfessionalServices Council for its support and partnership with the 2017survey and its help in promoting this survey report. In addition,Kevin Savage, Ramie Jester and Charlotte Bennett from GrantThornton’s professional government contracts practice teamwere instrumental in supporting this year’s survey.We welcome feedback on this year’s survey and solicit input forspecific topics to cover in our next survey. Please contact BillJohnston, National Governmental Contracting Industry practiceleader, at bill.johnston@us.gt.com with your suggestions.William C. Johnston, Jr.Alan ChvotkinCo-leaderExecutive Vice President and CounselGovernment Contracts PracticeProfessional Services CouncilGrant Thornton LLPT 1 703 875 8059T 1 678 602 7713E chvotkin@pscouncil.orgE bill.johnston@us.gt.comRich LaFleurCo-leaderGovernment Contracts PracticeGrant Thornton LLPT 1 703 847 7550E rich.lafleur@us.gt.com2017 Government Contractor Survey 1
Executive summaryGrant Thornton is pleased to provide our 2017 GovernmentContractor Survey. The report presents a wealth of financial andnonfinancial information provided by government contractorslocated across the country and representing a broad crosssection of the government contractor industry.This survey incorporates a wide range of metrics and includesdata on the day-to-day business of government contractors,information on changes in government regulations in addition torevisions in policies and priorities of the government.This year’s survey reveals some interesting and noteworthy trendsin the industry. These are highlighted below in “Notable Trends inthe 2017 Survey.”For the United States and its government contractingcommunity, we would be remiss if we did not first mention theelection of a new president and members of Congress and theimpact they have for 2018 and beyond. In responding to thesurvey, many companies remarked that they are uncertainabout the future; citing that from their prospective, it is hardto anticipate or prepare for the future when many of thecommunications from the administration are at times confusing,unclear or contradictory.As we look to 2018, one of the new and most pressing issuescontractors face will be the budget process, where the increasedfunding commitment will be to the U.S. Department of Defense(DoD) while other agencies are likely to have no increases or evenbudget cuts. The actual funding of the government, especiallythe continuing resolutions, are an issue for all contractors due todelays in congressional approval and the disruptions to planningand staffing shutdowns which result. We noted that, during thisuncertainty, contractors are looking to increase hiring, acquireor sell companies, bid on numerous and diverse procurements,modernize IT systems and improve critical enablers such ascybersecurity, cloud computing and big data. Another majorissue for government contractors were the government shutdownsin April 2017 and January 2018; although short in duration, theshutdowns impacted rates, both direct and indirect, as well ascontract performance. Finally, contractors recommended thatoperations and maintenance budgets be increased to simplymaintain the status quo.Another significant focus for 2018 will be the reduction innumber and types of regulations. We have seen severalnoteworthy trends in 2017 and prior years including:(1) allowing outside auditors to perform cost accountingaudits previously performed by the Defense Contract AuditAgency (DCAA), and (2) requiring agencies to eliminate tworegulations for each new one proposed. Additionally, auditsperformed by the DCAA may have a substantial impact on acompany’s performance and compliance, especially in theapproval of accounting systems, forward pricing and incurredcost submissions. Compliance continues to be a concernwith billing, procurement and new guidance that deviatesfrom past norms, such as fixed price development contracts,ceilings on rates and elimination of previous allowable costs.2017 Government Contractor Survey 3
Notable trends in the2017 surveyIn the past year, the key factors for government contractorsinclude competition, profitability and compliance with laws andregulations while the government’s focus has been on reducingprogram costs through Low Price Technically Acceptable (LPTA)bids, use of Indefinite Delivery/Indefinite Quantity (IDIQ) termson large contracts, and the management of difficult negotiationswith both the DCAA and contracting officers.For contractors, doing business with the federal governmentposes a different business relationship than that betweencompanies conducting business (or “B2B”) in a commercialenvironment. Government procurement regulations dictate thebusiness relationship – a structure that is not found, for the mostpart, in the private sector.For 2017, we saw a transitional year with a new administration,many regulations repealed or changed, and continuedgovernment focus on reducing costs while facilitating theefficient purchase of equipment, supplies and servicesfor our nation.4 2017 Government Contractor Survey
Key takeaways123456Because of uncertainty with federal funding andongoing risks of government shutdowns, contractorsfound it necessary to seek contracting opportunitiesoutside the federal government.The practices used for the allocation of indirect costsare often a major factor when addressing issues ofcompetitiveness and profitability.Companies found it necessary to review currentpricing techniques to determine if any adjustmentsare necessary to win a greater percentage ofpricing proposals.Whenever possible, in instances where the actualrates are higher than provisional billing rates,contractors are reviewing their estimating practicesto determine if practices followed in developingprovisional billing rates should be adjusted to bemore aligned with actual rates.Hot-ticket items receiving the highest scrutinyby government auditors are bonuses/incentivecompensation, executive compensation, consultantfees, expenditures for employee morale and welfare,and penalties on unallowable costs.The failure to disclose updated informationat negotiations is frequently the basis forgovernment “false claims” allegations againstgovernment contractors.7The DCAA has not performed defective pricingaudits on the overwhelming majority of contractsthat are subject to Truthful Cost or Pricing Data(TCPD) over the past five years; however, whenperformed, TCPD compliance audits usually resultedin a refund to the government.880 percent of companies responded that they had noallegations of ethics or compliance violations in thepast two years.9The DCAA is currently updating its standard auditprogram for accounting system reviews. Contractorsshould become familiar with the updated auditprogram as soon as it is released.101112To enhance the likelihood of system approval,contractors should adopt written policies andprocedures addressing compliance with each of theDefense Contract Management Agency’s (DCMA’s)35 Contractor Procurement System Review topics.95 percent of surveyed companies report that theyrely on in-house personnel to perform cost and priceanalysis of subcontractors while only 5 percent arerequesting government-assisted audits.As for cost, not much has changed as costmultipliers or “wrap rates” remain largely stableand comparable to our last several surveys for bothcompany-site and customer-site rates.2017 Government Contractor Survey 5
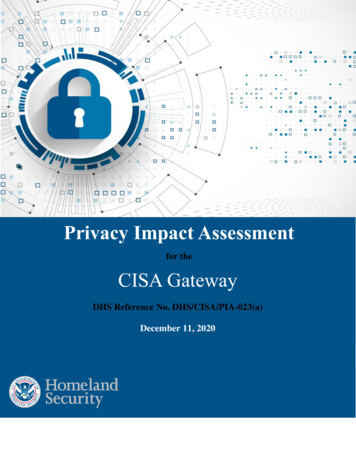
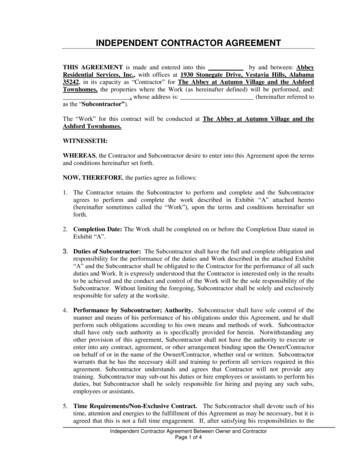
Revenue and profits2 65 3426DProducts or services offered by respondentsAdministrative support 2%IT/Engineering and ProfessionalServices/R&D Consulting 65%Products 3%Training/Education 4%Other 26%The results of the survey showed that the majority of companiesresponding provide IT/engineering and professional services togovernment entities; this is not unexpected as most respondentsare headquartered in the Washington, D.C. region. This isconsistent with previous survey results showing the majority ofrespondents provide professional services in support of federalgovernment contracts. “Other” responses included: technicalassistance, consulting and research services.Changes in revenue growth0-3% 49%4-7% 14%8-10% 12%Over 10% 25%49 14 1225DAnother notable trend was the increase in companies’ revenueover the prior year. Approximately 51 percent of respondentsshowed increases in revenue growth of 4 percent or more andhalf of those (25 percent) showed increases of 10 percent ormore in revenue. This may be attributable to changes in theWhite House administration resulting in greater expendituresin areas such as the DoD as well some respondents benefittingfrom M&A activity. We anticipate this trend to continue inthe DoD and other specified agencies in the foreseeablefuture whereas other targeted agencies could see significantreductions in funding.6 2017 Government Contractor SurveyCustomer base of respondentsFederal Government 56%State and Local Government 11%International 12%Commercial/Private-BusinessAccounts 21%56 11 1221DOverall, 2017 saw respondents’ federal government sales remainrelatively steady, with approximately 56 percent of sales beingderived from the federal government as compared to 54 percentin 2016. In recent years, minimal change in federal sales aredue to greater diversification of customer bases to includemore state and local, commercial and international clients.Because of uncertainty with federal funding and ongoing risks ofgovernment shutdowns, contractors are diversifying by seekingcontracting opportunities outside of the federal government.With the Trump administration, we anticipate an increase incertain federal contracts, particularly within the DoD and otherspecified agencies, while other targeted agencies could seesignificant reductions to their budgets.Each year we also ask respondents about their contract mix bytype of contract. Three years ago, the split between contractswas nearly even between Cost Type, Time and Materials(T&M), and Firm Fixed Price. The split skewed toward T&M lastyear at 39 vs. 30 percent for both Cost type and Firm FixedPrice. This year’s respondents averaged the following in termof contract mix:Type of contractCost Type 42%Time and Materials 26%Firm Fixed Price 32%42 26 32D
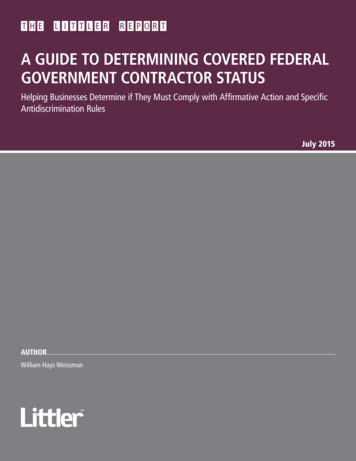
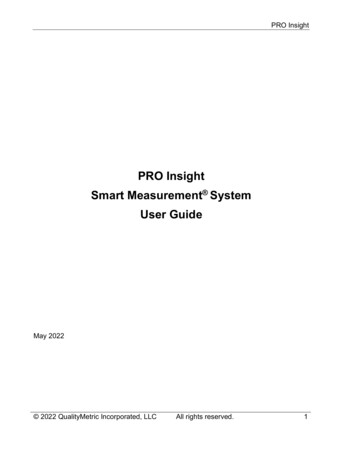
Cost accountingA company’s cost accounting practices are often a criticalfactor in the competitiveness and profitability of the company.Government regulations on cost accounting practices areconceptual and provide a great deal of discretion for selectingspecific cost accounting practices that are the most effective inthe various markets where a company operates.Once a company has implemented its cost accounting practices,they generally must be consistently applied. In some situations,changes to cost accounting practices must be reviewed andapproved by a contracting officer (CO) or government auditorbefore the changes can be implemented. In other situations,particularly in regards to new business, different cost accountingpractices may be implemented.Historically, the Defense Contract Audit Agency (DCAA) hasbeen the resource used by most government agencies toconduct audits to determine the adequacy of a contractor’scost accounting system. It should be noted that an approvedcost accounting system is a prerequisite for awarding costreimbursable contracts. Some government agencies are nowauthorizing government contractors to obtain system reviews byCPA firms in lieu of DCAA audits and are also now recognizingCPA reports as adequate evidence of the acceptability of a costaccounting system pursuant to the standards for an adequatesystem in the Defense Federal Acquisition Regulations (DFAR).We are also seeing the DCAA request access to audit firm’sworkpapers as part of their procedures on cost allowability.We asked companies whether they had considered changingtheir organizational structure or cost accounting practicesto improve competitiveness and profitability, and 82 percentreported having considered such changes. This compares tothe 2016 survey that showed 74 percent of respondents havingconsidered such changes.82 18 DOrganization or cost structure changesYes 82%No 18%The practices used for the allocation of indirect costs is oftena major factor when addressing issues of competitiveness andprofitability. We continue to observe that many professionalservices companies have a simple cost structure with a singlefringe benefit rate, an on-site overhead rate, an off-site overheadrate and a General and Administrative (G&A) rate. Such a systemmay be simple to maintain but it offers little or no flexibility whenpursuing new business, particularly when it is very price sensitive.However, a “one size fits all” cost structure is rarely effective forcontractors pursuing price-sensitive business.Government regulations on the allocation of indirect costs areflexible and generally encourage separate burden pools fordifferent types of business. The creation of additional burdenpools does not require the creation of new legal entities toperform the work. New business units can be created within theexisting legal entity as necessary to achieve competitivenessand profitability for new work. We also found many companiesare new to contracting with the federal government. These newentrants are encountering significant compliance mandates ingovernment accounting such as approval of their accountingsystem and the need for approved rates including forwardpricing agreements. Additionally, for companies entering federalgovernment contracting, becoming either modified or full CostAccounting Standards (CAS) compliant and creating a disclosurestatement as well as an accounting system that segregates costsis a concern.2017 Government Contractor Survey 7
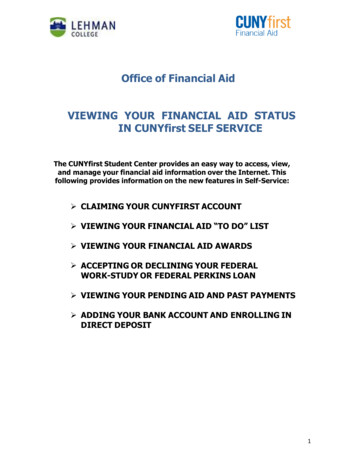
81 percent of respondents have already made changes to theirorganization or cost structure. This can partially be attributableto recent trends in increased competition that drives downpricing and profit percentages on federal contracts. Companieshave found it necessary to review current pricing techniquesto determine if adjustments are necessary to win a greaterpercentage of proposals. Additionally, oversight by agenciessuch as the DCAA have required changes to be compliant withgovernment regulations.Labor multipliers or “wrap rates”201720162015Company Site2.12.12.2Customer Site1.91.81.8Over time, we have seen a great deal of consistency amongstaverage wrap rates for both on-site and off-site multipliers.Because contractors often classify and account for the sameindirect costs in different cost pools or vary in the way theyaccount for items such as uncompensated overtime, the totalmultiplier of indirect costs on direct labor is an importantbenchmark to preface the comparisons of indirect rates forfringe benefits, overhead, G&A and material handling thatappear on the pages of the survey that follow. It is equallyimportant to recognize that the data below are averages, withthe range of multipliers for on-site rates from a low of 1.47 toas high as 3, while the range for customer site multipliers isfrom 1.4 to 2.3. These ranges reflect the types of work beingperformed by survey respondents. Based on complexity andskills offered, ranges can result in higher or lower cost structuresbeing used and the degree to which the customer is basing theirpricing decision on “best value” versus “lowest price technicallyacceptable” (LPTA) criteria.8 2017 Government Contractor SurveyFringe benefitsMany government contractors offering professional servicesaccount for fringe benefits in a separate burden pool thatis allocated to projects and other indirect cost pools as arate applied to total labor costs. The fringe benefits poolgenerally includes costs for payroll taxes, paid time off, healthinsurance, retirement plans and other employee benefits.Some contractors include employee bonuses in the fringebenefits pool while others charge benefits to other indirect costpools or as a direct charge to projects. It is important to notethat large bonuses can have a significant impact on indirectcost rates. We asked respondents if they include bonuses intheir fringe benefits pool. 49 percent responded that they doinclude bonuses in their fringe benefit pool. This represents aslight increase compared to the 2016 survey where 44 percentincluded bonuses in the fringe benefit pool.Extent to which respondents include bonusesin fringe poolsYes 49%No 44%Not applicable 7%49 44 7DExcluding the effect of bonuses on fringe rates, the medianoverall fringe benefit rate was 36 percent in this survey, which iscomparable to the 37 percent rate in the 2016 survey.
On-site overhead ratesThe overall median on-site overhead rate reported by this year’ssurvey respondents was 50 percent, lower than the 60 percentreported in the 2016 survey. As is the case with surveys of thistype where respondents vary from year to year, we cautionreaders to this fact and recommend data of this type to be usedonly as directional in nature.Off-site overhead ratesOff-site or customer location overhead rates varied quite widelyacross this year’s respondents, but on average were identical tothe 2016 survey as the median off-site rate was 33 percent. Wealso note that many contractors maintain multiple off-site ratesto match the cost characteristics of a particular geographiclocation or customer set to the related contracts.Base for overhead rates allocations*Base for off-site overhead ratesDirect labor 29%Direct labor and associatefringes 31%Direct labor IR&D labor/B&P labor 14%Direct labor IR&D/B&P andassociated fringes 9%Other 7%Pool not applicable 10%29 31 149710D* IR&D/B&P “independent research and development/bid and proposal”Firms that offer professional services to federal agencies usuallymaintain indirect cost pools to accumulate the costs of indirectcharges for management and support time as well as otherindirect expenses associated with the direct charging personnelwho perform the contract statement of work. These indirectcost pools are usually referred to as labor overhead and aregenerally allocated to contracts by a rate applied to directlabor costs. Some government contractors include the fringebenefits associated with the direct labor costs in the allocationbase rather than in the labor overhead pool. While moving fringebenefits associated with direct labor from the numerator tothe denominator yields a lower calculated overhead rate, thesum total of the costs for direct labor, fringe benefits and laboroverhead remain the same under either method. Our 2017 surveydetermined that 74 percent of overhead rates were calculatedon the basis of direct labor or direct labor with fringes and/or independent research and development/bid and proposal(IR&D/B&P) costs.Direct labor 22%Direct labor and associatefringes 39%Direct labor IR&D labor/B&P labor 6%Direct labor IR&D/B&P andassociated fringes 8%Other 6%Pool not applicable 19%22 39 6819DOften a company will establish an off-site overhead rate whenthe pool costs and allocation base costs associated with theoff-site location are significantly different than the normaloverhead rate for the entity. Typically, off-site overheadrates exclude facilities and other infrastructure costs beingprovided to contractors by clients for contract performance.In those instances, the normal on-site overhead rate (usuallyhigher) would not represent an appropriate causal/beneficialrelationship to personnel working at client locations.We asked the surveyed companies to share their primary basisfor establishing off-site overhead rates, and approximately75 percent used direct labor and derivatives of direct labor forfringe benefits and IR&D/B&P labor.2017 Government Contractor Survey 9
The key driver for creation of multiple overhead ratesLocation(geographical offices)Products vs. servicesCustomer (e.g., governmentvs. commercial)24.2%3%15.2%Function (e.g.,manufacturing, engineering)Market(e.g., high tech, consulting)No differentiation occurs33.3%6.1%45.5%We asked surveyed companies if they have multiple overheadrates and how their rates are differentiated. 46 percent ofrespondents report no differentiation, implying they use a singleoverhead and/or G&A rate across all departments of theirorganization. Of those that do differentiate overhead rates,33 percent of respondents differentiate their rates by function,which implies they developed separate overhead rates for majorfunctions of their organization. Finally, 24 percent of respondentsreported that they developed separate indirect rates bygeographical location to better represent economic differences.10 2017 Government Contractor SurveyG&A ratesThe survey requested general and administrative (G&A) ratesfrom respondents; using the information they shared, wedetermined that G&A rates varied significantly, ranging from5 to 30 percent. This is primarily attributable to the allocationbase utilized in calculating the G&A rate. The use of a total costinput (TCI) base would typically result in a lower G&A rate sinceall costs other than G&A costs are included in the allocationbase. A value-added cost input (VACI) base would typicallyresult in a slightly higher G&A rate since the allocation baseexcludes G&A costs, direct materials and direct subcontracts. Anallocation base other than TCI and VACI based on a single directcost element or hours may result in higher G&A rates since theallocation base would typically have lower overall costs.The table below shows the relative consistency of G&A ratesacross the broad group of respondents in recent surveys.G&A rates by year of surveyG&A Rates byAllocation BaseTotal CostInputValue-AddedCost InputMedian G&A 201214%15%201113%16%201013%15%
Allocation base or methodTotal cost input(total cost less G&A) 38%Value-added cost input(total cost input lesssubcontracts and materials) 38%Direct labor 16%Not applicable 8%38 38 168DThe cost structures of most government contractors includea G&A expense pool. G&A typically includes the cost ofheadquarters functions such as executive management,accounting, legal, contract administration, human resources,and sales and marketing. G&A frequently includes the companyfunded portion of IR&D and B&P costs. The G&A pool is usuallyallocated to projects at a rate applied to TCI or VACI, althoughother methods are authorized in CAS 410 where neither TCI norVACI would yield equitable results. TCI is the sum of total costsexcluding G&A expenses while VACI is total costs excluding G&A,direct materials, and direct subcontracts.Material handling and subcontract administrative ratesMany government contractors that allocate G&A on a VACIbase also establish a material handling rate/subcontractadministration rate. Other government contractors apply anindirect cost rate to the costs for direct materials and directsubcontracts that is lower than the full G&A rate applied to othercosts in the VACI base. The material/subcontract rate typicallyincludes the costs of the company’s procurement function, thecosts of warehousing the items when the company is procuringinventory, and charges for contract administration, legal andprogram management as appropriate.For the 2017 survey, the respondents’ material/subcontractrates varied from slightly below 2 percent to 9 percent.The median material handling rate in this year’s surveyfrom all respondents, where applicable, was 3.2 percent.The median subcontract administration rate in this year’ssurvey was 3.8 percent.Actual rates vs. provisional ratesActual rates higher 42%Based on the survey results, 38 percent of companies usea TCI base and 38 percent use a VACI base, while a smallerpercentage, 16 percent, use a direct labor allocation base.Approximately the same 42%Actual rates lower 8%Not applicable 8%42 42 8D2017 Government Contractor Survey 11
We surveyed companies to compare differences between actualrates and provisional billing rates used for invoicing in 2017.Approximately 42 percent that actual rates were higher,42 percent stated noted no differences, and 8 percent statedthat actual rates were lower than provisional billing rates. Ininstances where the actual rates are higher than provisionalbilling rates, contractors should review their estimating practicesto determine if practices followed in developing provisionalbilling rates should be adjusted to be more aligned with actualrates incurred. Additionally, contractors are usually allowed tomake in-year adjustments to provisional billing rates if it can bedemonstrated that large variances are consistently occurring ona monthly basis that will result in larger invoice adjustments atyear-end or at contract close-out.14 5 32418DCauses of actual rates vs. provisional ratesActual indirect costs greater thanprojected 14%Actual indirect costs less thanprojected 5%No difference in actual rates vs.provisional rates 32%Actual base less than projected 41%Actual base more than projected 8%12 2017 Government Contractor SurveyPrimary causes for difference in actual versusprovisional ratesWe surveyed companies to determine the primary reasonsfor differences in actual versus provisional billing rates asshown above. For the instances where actuals were higherthan provisional rates, the reasons cited were that the actualindirect costs were greater than projected and/or the actualbase was less than that projected. For those where actualrates were less than projected rates, the reasons cited wereindirect costs were less than projected and/or the actual basegreater than projected.31 25 22DPassing on additional actual costs to customersAll of the additional costs 31%Some, but not all of the additionalcosts 25%None of the additional costs 22%Not applicable — No costreimbursable contracts 22%
We surveyed companies to determine if actual rates exceedprovisional rates on cost-reimbursable contracts and howmuch of the additional costs are recoverable. The surveyresponses showed that 31 percent of companies are ableto recover all additional costs and another 25 percent wereable to recover some of those additional costs. The surveyresponses showed that 22 percent of companies were unableto recover any of those costs resulting from higher actual ratesthan provisional rates.For instances where companies failed to collect all or anyadditional costs on contracts where actual rates exceededprovisional rates, numerous reasons were cited, including:Revised provisional billing rates at year-end reflectingactual rates incurredRequest approval for the DCAAor other cognizant office to billfor the rate variance 27%Bill the rate variance immediateswithout approval 12%Wait for government tocomplete its incurred cost auditprior to billing 19%Wait for contract closeout to billthe rate variance 7% Ceilings placed on indirect rates in the contract;Other method for revising 7% Fixed G&A rates;No revisions are made 28% Customer relationship; Immateriality; Remaining funding limited or none remaining; Administratively burdensome;Trends in indirect ratesIndirect rates are increasing 28%Indirect rates are decreasing 40% De-obligation o
government contractor or a business considering entering the government market, Grant Thornton hopes you will find the information in this survey to be useful in managing your business now and planning for the future. The 2017 survey is part of Grant Thornton's continued thought leadership within the government contracting community and