Transcription
EY Food andAgriculture NavigatorEY Global Agribusiness2021 H2 Semiannual Report
Contents1Trends in food and agriculture2Agriculture sub-sectors3Consumers Water Animal Protein Cannabis Aquaculture North America Controlled environment agriculture Dairy EU Food delivery systems Grains Asia Food labeling Cotton Sugar North America Fruits and Vegetables EU Seeds Asia Biofuel Consumer trends under COVID-19 Equipment Food start-ups focused on consumers Food at home expenditureFood away from home expenditurePage 2
1Trends in food and agriculturePage 3
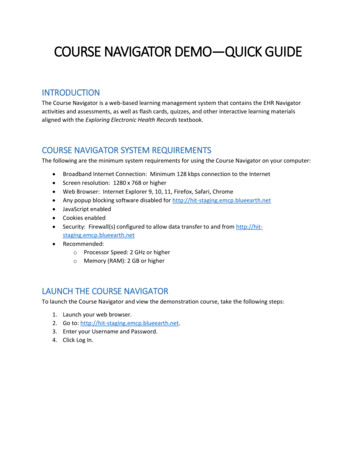
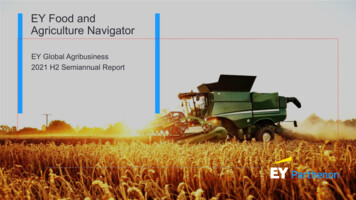
Water: Approximately 70% of the earth’s limited freshwater supply is used to grow crops andraise livestock around the world; a freshwater supply that is under increasing stressGlobal Water Supplyand UsesOnly 1% of the earth’swater supply is readilyavailable as ableFreshwater1%Domestic10%Globally, approximately70% of all freshwater isused for agricultureAgriculture70%Agricultural Water Use Agricultural use is defined as the annual quantity of self-supplied water withdrawn for irrigation, livestock, and aquaculture purposes. The amount of agriculturalwater use averages 70% of total water withdrawals globally, but varies significantly by region, country and income level–Low use: Many northern countries use very low portions of water withdrawals for agricultural purposes (e.g. Germany at 2%, Canada at 7%, Sweden at 3%)–Medium use: The U.S. and Russia are estimated to use roughly 40% and 30% of withdrawn water for agricultural use respectively–High use: Lower income countries and those closer to the equator use a significantly higher portion of water withdrawals for agricultural purposes (e.g. India at90%, Peru at 81%, Egypt at 79%)Source: Nasa Earth Data, Ourworldindata.orgPage 4
Water: While crucial for growing crops and raising livestock, water is also critically important fortransforming and making end products that are safe and of high qualityAgricultural and Industrial Water Use Overview Agriculture: Water use occurs in the field for irrigation (constituting most ofthe 70% of water use figure) and in a variety of ways to wash, sanitize andcool livestock.–Source of supply: Primarily water is either pumped from private localwells or acquired/delivered from local surface water supplies given howchallenging and expensive it is to move water great distances–Agriculture use example: When irrigating, lower water use crops likegrapes can thrive on 2 acre-feet of water1 per planted acre or less, whilecrops like almonds or alfalfa hay can require 3 to 4 acre-feet per acre Industrial: Water is used for many activities ranging from handwashing andsanitation to processing uses like chilling, scalding, cleaning, and wasteconveyance.–Source of supply: Industrial water also comes from private wells andsurface supply, but given the proximity of processing facilities to urbanareas in many regions, it is often delivered through local water utilitieswho control pricing and must weigh industrial demand with domestic use–Industrial use example: Beef slaughter is estimated to require between150-450 gallons per head for carcass washing and waste processingSource to Consume Lifecycle Water akeTransformForestryVegetablesAgricultural WineryMeat processingPackagedFoodIndustrialProductsFruit & eAnimal venienceFood ServiceInstitutionalE-commerceIndustrial Use1. One acre-foot of water can be visualized as covering a football field with water 1 foot in depth. It is equal to approximately 326,000 gallons of water.Source: Food Northwest, USDA, Cal Polytechnic University ITRCPage 5
Water: The current food system will require more water to produce sufficient food for the growingpopulation, but stressors continue to add upPopulation Growth and Competing DemandsWith a projected population of 10 billion people by 2050, estimated agricultural productionwill need to expand by nearly 70%, and agriculture will be asked to do more with less Agrowing population demands more freshwater for human consumption and industrial uses.Domestic water withdrawals have increased more than 600% since the 1960s. Much of thepredicted population growth by 2050 is expected to occur in highly water-stressed regions Lackof freshwater supply may also contribute to the ongoing reduction in arable land asdecreased productivity due to insufficient water will make farming unprofitable in some regionsLegal & Regulatory IssuesAs water becomes more scarce and supplies are threatened, governments and rights-holderswill become more aggressive in protecting access to critical water resourcesRecent Headlines1.Overpopulation and water scarcity leading to world future food crisis2.Researchers warn of Ethiopian dam’s impacts on Egypt’s agriculture, economy3.Supreme Court gives Georgia win in water war with Florida4.China’s plans for Himalayan super dam stoke fears in India5.First water cuts in US West supply to hammer Arizona farmers6.Running out of water: how climate change fuels a crisis in the US west7.Aging infrastructure in a fast-growing city: Inside Charlotte Water after mainbreaks Historicwater rights regimes are beginning to come under scrutiny as some create a system ofhaves and have nots when water is in short supply, reducing total regional agricultural output Watersources that were previously unregulated are likely to become regulated as drought orcontamination threatens the supply Water-relatedsupplylegal disputes are boiling up around the globe as would-be users look to secure“First water cuts inUS West supply tohammer Arizonafarmers” (APNews)“America’sWaterUnfractured Isin Need of aMajor Overhaul”(FOX)“Supreme Courtgives Georgia winin water war withFlorida” (AP News)“China’s plansfor Himalayansuper damstoke fears inIndia”(Phys.org)Aging InfrastructureWater infrastructure includes groundwater wells, surface-water intakes, dams, reservoirs,storage tanks, drinking-water facilities, pipes and aqueducts Muchof the US water infrastructure, including major dams, was built or last updated in the1940s. Many of the nations dams are in desperate need of repair, receiving a “D” safety gradefrom the American Society of Civil Engineers Urbaninfrastructure is also in disrepair, as there is a water main break every two minutes andan estimated 6 billion gallons of treated water is lost each day in the U.S.Source: World Bank, CalMatters, Yale Climate Connections, Circle of Blue, University of Michigan Center for Sustainable Systems, World Resources InstitutePage 6
Water: The warming climate will exacerbate stressors on the water supply and change the watercycle in ways that make interannual precipitation more variable and less predictableWater CycleImpacts of a Warming Climate Reducedsnowpack and greater runoff will eliminate a significant amount of naturalwater storage that would traditionally melt throughout the summer providing a steadyflow of water to use for irrigation in critical months. This reduction will add stress toaging dams and infrastructure and could force governments to undertake largeinvestments in less efficient manmade storage Moreintense storms with increased wind and flood events will damage or destroycrops in wet and dry regions. In dry regions, floodwaters will fail to percolate dry soilto replenish overused groundwater supplies Drysoils cause greater amounts of evaporation and plant transpiration, forcing evenmore water application to maintain crops. This forces greater groundwaterwithdrawal in drought stricken regions, creating a multitude of other problems As mountain runoff occurs earlier in the spring, it will reduce streamflow later in theseason and cause for warmer streamflow, both of which can kill young fish anddisrupt commercial aquaculture efforts Sealevel rise will cause saltwater intrusion into delta regions and can causeincreased seawater intrusion into groundwater aquifers used for both agriculturalsupply and regional drinking waterSource: United Nations IPCC, Nasa, USDA National Agricultural Library, Wisconsin Potato and Vegetable Growers AssociationPage 7
Water: As stressors mount, identifying and mitigating water risk now and preparing to adapt to anunpredictable water future has never been more importantNowSolve the Now Current estimates suggest the cost of inaction on water security isat least 5x higher than the cost of actionRisk Assessment Understand current operational and supplychain use. Identify and quantify areas ofgreatest riskDevelop Stewardship Plan & Goals Identify impactful, attainable goals. Tie goalcompletion to internal assessment metricsacross the organization to instill a culture ofsavingsIdentify & Implement Risk Mitigation Projects Risk AssessmentAlign projects to goals, but look for uniqueprojects to capture enhanced value. Watercost savings can be significant and reexamining how much and where water isneeded can open the door to new ways ofdoing businessDevelopStewardshipPlan & GoalsIdentify &Implement RiskMitigationProjectsNextBeyondExploring what’s Next It’s imperative that water-relatedplanning remains flexible and agile.The world’s responses to water stresswill impose new burdens and createnew challenges and opportunitiesImagining the Beyond Having a plan and remaining agile willenable business continuity, butimagining the beyond will position acompany to take on whatever waterchallenges may occurQuestions to explore: How is climate change impactingwater supplies critical to myoperations?How does your business respond if Water prices double, triple, or more, orif tiered pricing structures imposeharsh penalties for overuse? What new regulatory burdens orrestrictions could be coming? Am Iprepared if I need to provide or labelwater traceability information? Do I have a backup plan in the eventof infrastructure failure at or near afacility? Sustainability Reporting Beyond required reporting and disclosures,reporting on water stewardship as part of anESG plan can help a company appeal toinvestors and consumers alikeSource: BarclaysSustainabilityReporting Should I diversify my supply base,source from new producers, newregions, or those employing newmethods of farming and production?Have new technologies beendeveloped that could change my wateruse or that of my suppliers? Water markets are developedthroughout the country allowing rightsholders to buy, sell, and transferwater? Would you have a new asset atyour disposal? Workers flee water-stressed regions,abandoning growing and processingoperations? Dry regions allocate water only tobusinesses using it most efficiently oreffectively (i.e. on crops native to theregion, or on highest value crops,etc.)?Page 8
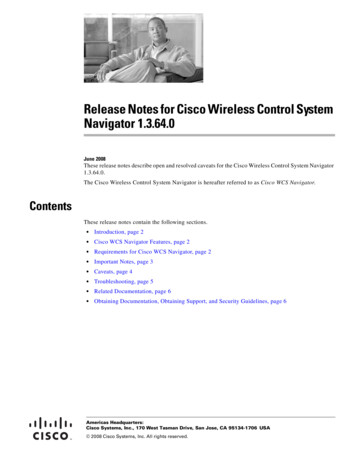
Cannabis: Growing market projections and increased investments in cannabis innovation couldlead to a new business for cannabis seeds and geneticsMajor cannabis companies and producers are making major investments in seedsand genetics, leading to the possibility of a new business for seeds and genetics 120 100 80Based on comparable seed markets (slide 8) the total market for cannabisseeds and genetics could range from 6 billion - 20 billion by 2030 60An industry-wide push for higher yields, consistency, and the ability to createunique and novel strains are among the drivers for innovation and development incannabis seed and genetics 20 140Global Market for Cannabis Seeds & Genetics 40 02020 2021 2022 2023 2024 2025 2026 2027 2028 2029 2030Total Cannabis MarketAxisTitle 18 16 14 12 10 8 6 4 2 0Seeds & Geneics LowSeeds & Genetics High 25 20Drivers for Cannabis Seeds & Genetics Innovation 15 10Increased Increased YieldUniqueCharacteristicsInnovation andR&D 5 020202021 2022 2023 2024 2025 2026 2027 2028 2029Seeds & Geneics Low Axis TitleSeeds & Genetics HighSource: Market Watch; Global Newswire; Cannabis Investing News; EY Parthenon Analysis2030Page 9BillionsAs the United States, among other countries, continues to increase socialacceptance and make moves toward federal legalization of cannabis, theglobal market for cannabis is projected to reach 130 billion by 2030Billions BillionsGlobal Cannabis Seeds & Genetics Market GrowthProjections for growth in the global cannabis market present opportunities forincreased innovation and new business opportunities
Cannabis: Innovation in seeds and genetics for corn and cotton improved production capacityand created new business opportunities for proprietary, licensed productsAnnual Crop Value Axis TitleValue of Cotton Seed MarketThe corn and cotton markets respectively say rapid growth in the 1990’s due to theintroduction and transgenic cotton and marker selected breeding in corn. These innovationsnot only improved yields and quality, but introduced a new business for seeds and geneticswhich today values in the billions of dollarsAnnual Crop Value 10 9 8 7 6 5 4 3 2 1 0Value of Corn Seed MarketTargets for Value CreationCommercialized seedsalesHigh quality seedproduction The value of a cannabis seeds and genetics market could capture 30-40% if the variableinput costs of production The innovation in corn and cotton seeds and genetics present a developed business modelfor cannabis seeds and genetics to both use proprietary breeding methods for in-houseproduction as well as licence products and methods to producers across the industryRobust germplasmKnowledge of modernbreeding techniques As with corn, cotton, and other crops which have benefited from innovation, investments inseeds and genetics has the potential to lower input costs associated with labor, materials,and production timeIdentified geneticcharacteristicsEnforceable intellectualpropertySource: USDA; University of Georgia Extension; University of Illinios Extension; National Corn Growers AssociationPage 10Billions 80 70 60 50 40 30 20 10 9 1,600 1,400 1,200 1,000 800 600 400 200 0BillionsCorn Seed Market Value and Annual Crop GrowthMillions 8 7 6 5 4 3 2 1 9BillionsCotton Seed Market Value and Annual Crop Growth
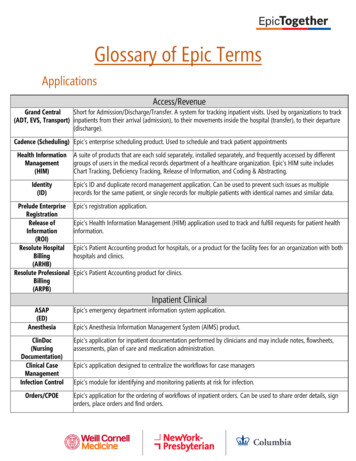
Controlled environment agriculture: indoor farming may grow by 40% over the next five years(CAGR 7.2%) as demand increases for alternative production methodsMarket ConsiderationsControlled Environment Agriculture Growth Projections Increasesin the global population, particularly around urban centers, and decreases in naturalresources, such as cultivable land, will drive demand for novel agriculture systems such as CEA. Asclimate change increases volatility in traditional agriculture, CEA production offers analternative method in which conditions can be managed with much more control.capital requirements is a key limiting factor to market growth, as CEA systems requireintensive energy use, specialized equipment, and highly-trained labor. Theequipment manufacturing segment of CEA is expected to grow considerably, from anexpected 23.4B in 2021 to 41.9B in 2026 (CAGR 12.4%). USD billion High302026, the largest projected individual crops by revenue in CEA include herbs ( 2.8B), lettuce( 2.1B), tomato ( 1.7B), spinach ( 1.2B), basil ( 1.2B), and perennial flowers ( 1.1B).20By Production SystemCAGR: uaponics10Hydropnics stry DefinitionsControlled Environment Agriculture (CEA): The growing of crops in an indoorenvironment controlled for factors such as temperature, lighting, humidity, etc.Soil-based: plants grown in soil in a pesticide-free settingHydroponics: soilless method using water fortified with mineral nutrients and oxygen USD billionProduction Systems3020By Facility TypeCAGR: 7.2%17.018.119.420.822.323.925.6OtherWater CulturesContainers10Vertical FarmsGreenhousesAquaponics: blend of aquaculture / hydroponics, growing fish and plants in an integrated systemHybrid: plants grown in multiple systems in a single facilityAeroponics: soilless method using nutrient-rich mistSource: Mordor Intelligence, Autogrow & Agriculture Consulting, Crunchbase0Total202020212022202320242025Page 112026
Controlled environment agriculture: indoor crop production is highly fragmented with manyplayers, while equipment suppliers is concentrated among large manufacturersMajor ProducersMajor Equipment ManufacturersAeroFarmsSignifyAeroFarms operates aeroponic growing systems,leveraging modular stackable systems, to produceprimarily leafy greens and microgreens forrestaurant and retail. In October 2021, AeroFarmsand Spring Valley Acquisition Corp. called off aSPAC merger that would have taken AeroFarmspublic at a valuation of 1.2 billion.The CEA landscape is highly fragmented atSignify Holdings is a Netherlands-based producer ofadvanced LED and connected lighting systems.Signify offers lighting systems specifically for verticalfarming and other CEA operations.BrightFarmstypes and crops, as well as the fragmentedBrightFarms uses hydroponic greenhouses to produceproducts consisting primarily of leafy greens and basil. InAugust, 2021, BrightFarms was acquired by CoxEnterprises, a media and communications conglomerate,for an undisclosed amount.Bowery FarmingBowery Farming touts a proprietary hydroponic growingsystem that leveraging artificial intelligence to producehigher quality crops while reducing input needs. Boweryprimarily produces leafy greens, basil and herbs. InMay, 2021, Bowery Farming raised 300 million inSeries C funding at a valuation of 2.3 billion.the producer level, driven by highvariability in farming methods, facilitynature of the marketing chain.Equipment manufacturing is moreconsolidated as a segment of the CEAindustry, with major players holdingroughly 55% of the market share.Source: Crunchbase, AeroFarms, Food Dive, BrightFarms, Bowery Farming, Bloomberg, Signify, Argus Controls, Mordor IntelligenceHydrofarmHydrofarm is a manufacturer and distributor ofhydroponics equipment and supplies for CEAcompanies. In 2021, Hydrofarm announcedacquisitions of several nutrient producers House &Garden Inc. and Greenstar Plant Products,Argus ControlsArgus Controls is a Canada-based provider ofautomated control systems for various methods ofCEA production. Argus systems include sensors andinjectors to automate activities around monitoring andnutrient control.Page 12
Food delivery systems: Food delivery systems continue driving and enabling innovation acrossmany segments of the food system.Expanded use of food delivery services,especially due to COVID-19, have drivencrop growers and food manufacturers tocreate products that can accommodate adifferent delivery system to consumers. Forexample, one potato product manufacturerre-engineered their products to ensurefreshness longer when placed in deliverycontainers.Meal kit and subscription services isexpected to grow to over 16bn USD globallyby 2025. Many of these subscription servicesinclude boutique brand foods in their productportfolio. Consumer demand of uniquebrands has continued to rise in recent yearstoo with consumers , especially millennialand Gen Z consumers, preferring a boutiqueor unknown food brand over name brandproducts.Source: New York Times, Statista, EY Food System hensSmallerPackersRising consumer trust to receive foodproducts from non-traditional sources, suchas dark stores and subscription services,paired with increasing availability of fooddelivery services that also make onlineordering more readily available have allowedcommercial cooking facilities withoutstorefronts or indoor dining capabilities,ghost kitchens, to grow to a 46bn USDmarket. .Online farm to table markets allow producersto directly market products to consumerswho are hungry for products, especiallymeats, that they can directly trace to aspecific farm and even animal. Becauseproducers are direct marketing theseproducts, they are able to leverage smallermeat packers for slaughter and processing –shifting business away from the large meatpackers who have seen high levels ofscrutiny in recent years.Page 13
Food Labeling: Product information available to consumers through food labeling has changedover time as companies shift to provide relevant information1990Nutrition Labeling andEducation Act (NLEA)& Organic FoodsProduction Act pass1994Inception of theNutrition FactsLabel (NFL)1995Quality SystemsVerification Programsimplemented to verifyprivate label claims2006Trans Fat added tolist of nutrientsrequired on theNutrition Facts Label2010Increased use of voluntaryhealth and nutrition claims –highlighting low calorie, wholegrains, high fiber, and lowsugar2016Nutrition Facts Label updated:serving sizes update, caloriesdisplayed in larger font, addedsugars declared, updateddaily values, new nutrientsrequired, and new footnote2021 and BeyondVoluntary health andnutrition claims continue tomake their way to consumerfood productsPurpose of LabelProvide consumers with nutritioninformation in order to make betterdecisions and decrease health carecostsAddresses use of particularpesticides and fertilizers that are notpreferred by a set of consumersIndicates lack of antibiotic use,which leads to antibiotic resistancethat can then impact human healthLabeled products verified ascontaining no more than 0.9% GEcontent, by weightWho sets thestandard?Regulation?FDA & USDA set and enforce thestandards for the nutrition facts labelUSDA sets the standards andUSDA or USDA-accredited certifierenforce the standardsStandards set by private entities orthird-party verification with somegovernment oversightStandards set by private entities orthird-party verification with somegovernment oversightConsumer Response/ImplicationsComplex pieces of information thatconsumers find difficult to understandConsumers might not understandwhat pesticides/fertilizers are or arenot organic; therefore, not know whatthey label representsThe human health benefits are notcommonly known to consumers.Additionally, changes in regulationstandards make it difficult to interpretSome labeled products do not haveGE versions in production,consumers might believe non-GEproducts are saferSource: USDA, ERSPage 14
Food Labeling: However, it has been argued that these labels are misleading, hard tounderstand, and consumers’ ability to interpret them variesIncreasing Consumer Interest in Understanding Food Labels As we move toward a consumer driven supply chain, consumers areincreasingly more interested in the methods used to produce their foods;however, consumers are more removed from the farm than ever before Over the last 10 years there has been a significant increase in onlinesearches for the meaning of GMO and organic as it relates to food productsGoogle Trends for GMO & Organic MeaningCase Study: Non-GMO Pink Himalayan Sea Salt One example of this common food labelmisunderstanding is the Non-GMO ProjectVerified label on Pink Himalayan Sea Salt Cargill Salt has seen an increase in consumerdemand for Non-GMO salt despite the fact thatsalt itself is not genetically modified The International Food Information Council(IFIC) found that 40% of consumers viewproducts containing Non-GMO ingredients ashealthier than identical products using GMOingredientsPremium for Non-GMO Salt 0.0812010-012012-012014-012016-01GMO meaning2018-01Organic meaning2020-01 Research found that consumers arewilling to pay a premium for Non-GMOsalt However, when controlling for any kindof farm experience, this premiumdecreases1 Interestingly, the effect of having acollege degree increases the NonGMO premium1WilsonSource: Google Trends, Cargill, Food Business News, Food Policyand Lusk 2020Page 15
2Agriculture sub-sectorsPage 16
Agenda AnimalProtein Aquaculture Dairy Grains Cotton Sugar Fruits and Vegetables Seeds Biofuel EquipmentPage 17
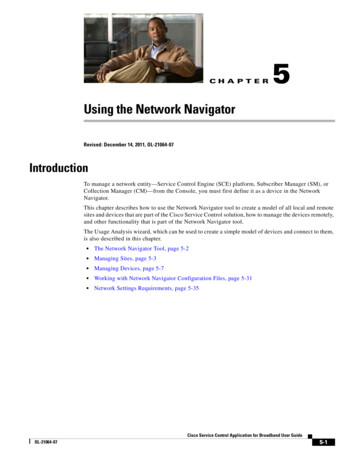
Animal Protein: Global meat production is expected to grow by 13% over the next decade toreach 373 Mt by 2030World Meat Prices (US 0003000150010002030North 02020World Meat Production (million Mt)*in constant 2020 US Global meat production is expected to increase by 13% ( 44 Mt) over the next decade to reach 373 million metric tons (Mt) by 2030, led by rise in per animal productivity (interms of average slaughter weight, improved breeding, and better feed formulations) along with herd expansion in China and the Americas. Additionally, growth in global meat production and consumption is largely led by rise in poultry production Rapid expansion in production of poultry meat is expected from sustained productivity gains in China, Brazil, and the US as well as from investments made in the EU (dueto lower production costs in Hungary, Poland and Romania). A shift away from pork in the short term (due to slow recovery from ASF (African Swine Fever) outbreak in China, Philippines and Vietnam, and environmental and publicconcerns in the EU) is expected to benefit poultry in the medium term. One-third of the overall increase in total meat consumption is attributed to pork. China is expected to account for 70% of this total increase by 2030.Nominal meat prices are expected to rise for all meat categories by 2030, however the ratio of nominal meat prices over feed prices is expected to decline. Nominal meat prices for beef, pork and poultry will recover in 2021, driven by demand recovery from the pandemic in high income countries and rise in consumer incomeand expenditure, especially in middle-income countries.Sources: OECD, Consumer EYK AnalysisPage 18
Animal Protein: Global meat exports are expected to react 40 Mt by 2030; Meat trade isincreasingly dominated by poultryTop Exporters (million nUSChina0 510World Meat Market at Glance (Mt & c.w.e**)Top Importers (million tons)403530252015105005202010BeefCovid-19 impact: The overall economic impact of the pandemic is anticipated to be short-livedand mainly impact the meat sector through reduced demand for higher valued meat products. Reduced incomes in net meat-importing, low-income countries is driving consumers toshift towards cheaper meat alternatives. Logistical hurdles, reduced food service and lower household spending havetemporarily curtailed demand for meat in some key consuming and importing countries. The combined share of exports from the EU and the US is expected to remain stable andaccount for 60% of global world meat exports during 2021-2030. Asia is expected to account for 52% of global trade by 2030 and a significant increase inpoultry meat imports is expected in the Philippines and Vietnam. A gradual decline in Chinese meat imports is expected due to the recovery of pigmeatproduction from African Swine Fever outbreak.2021Pork2022PoultryLambRegional Meat Production and Trade (Mt) ericaImportsNote: *Numbers have been extracted from OECD-FAO Agricultural Outlook 2021-2030 Database, **c.w.e. is carcass weight equivalent;Sources: OECD, Consumer EYK AnalysisPage 19EuropeOceania
Animal Protein: International meat prices grew by 15% during January to July 2021, led byincreased global demand amidst inadequate rise in global supplies from major exporting nationsInternational Meat Price Indexes (US , Dec-20 till Jul-21)*US Percent Change in Meat Prices 5.610595-2.9-3.5 -4.0-4.0-10%-15%-10.4JanuaryFebruaryMarchImports y-21Total Meat Price IndicesPandemic-related supply chain disruption and demand shocks in the US and global markets led to fluctuations in import and export meat prices in 2020. In the US, the pandemic forced shutdown of meat processing plants (poultry and pig facilities) while in-home food consumption rose. Domestic supply shortfalls caused an increase in demand for foreign meat, creating offsetting declines in both export and import meat prices in April.Since January 2021, international meat prices have grown by 14.9%, led by increased global demand amidst inadequate increases in global supplies from major exportingcountries. The Total Meat Price Index was 19.6% up from July 2020, witnessing a steep rise in prices for poultry meat, driven by increased imports by East Asia amidst limitedproduction expansion in the region. Conversely, pork prices fell following a decline in imports by China due to the African Swine Fever outbreak in certain pig farms.Note: *Numbers have been extracted from FAO Meat Market Review, August 2021;Source: U.S. Bureau of Labor Statistics; FAO, Consumer EYK AnalysisPage 20
Agenda AnimalProtein Aquaculture Dairy Grains Cotton Sugar Fruits and Vegetables Seeds Biofuel EquipmentPage 21
Aquaculture: Global aquaculture production is expected to overtake capture production in 2027and account for 52% of total fish production by 2030150Global Fisheries Production(Mt)30001002000500World Aquaculture Prices (US /t)40001000020202020 2021 2022 2023 2024 2025 2026 2027 2028 2029 2030Fish from aquacultureFish from captureGlobal aquaculture production is expected to reach 103 Mt by 2030, growing by 23% over the nextdecade, compared with 52.7% in the previous decade. Growth in aquaculture production is expected to slow due to reduced productivity gains, more stringentenvironmental regulations and increasing competitive challenges locating new production facilities. Covid-19 impact: Both demand an
EY refers to the global organization, and may refer to one or more, of the member firms of Ernst & Young Global Limited, each of which is a separate legal entity. Ernst & Young Global Limited, a UK company limited by guarantee, does not provide services to clients. Information about how EY collects and uses personal data and a description of the