Transcription
Chapter: 2/Preprimary, Elementary, and Secondary EducationSection: TechnologyImpact of the Coronavirus Pandemic on the Elementaryand Secondary Education SystemIn September 2020, among adults who had children under age 18 enrolled in a public orprivate school, 67 percent reported that classes had moved to a distance learning formatusing online resources and 59 percent reported that computers were provided by thechildren’s school or school district.The emergence of the coronavirus pandemic broughtmajor disruptions to American society. Health systemswere stressed,1 millions of jobs were lost,2 businesses wereshuttered,3 and many schools were closed.4 The traditionalelementary and secondary education structure, whichtypically emphasizes an interactive in-person classroomenvironment, quickly transitioned to online educationprograms in the spring of 2020 in an effort to mitigatethe spread of the coronavirus. Although online programshave enabled educational activities to continue whileschools have been physically closed, concerns have beenraised about whether inequities in access to these onlineprograms could exacerbate gaps in student performancethat existed prior to the pandemic.5,6 Studies of householdinternet access have revealed that lower income studentstypically have lower levels of home access to the internet(see indicator Children’s Internet Access at Home).Similarly, findings from 2019 National Assessment ofEducational Progress (NAEP) showed that the percentagesof students with digital tools available at home greatlyvaried by socioeconomic status, locale, and state.7Using data from the 2020 Household Pulse Survey(HPS),8 this spotlight discusses how children’s access totechnology and distance learning programs at home haschanged during the pandemic. The HPS is conducted bythe Census Bureau with seven other federal statisticalagency partners, including the National Center forEducation Statistics (NCES). The HPS has provided weeklyor biweekly national and state estimates since April 23,2020, when data collection began. The survey gathersinformation from adults about their employment status,spending patterns, food security, housing, mental health,access to health care, transportation, and householdeducational activities. This spotlight focuses on adults18 years old and over who had children under age 18 inthe home9 enrolled in school. It provides a comparisonbetween April 2020 (when HPS data collection began nearthe beginning of the pandemic) and September 2020 (nearthe beginning of the 2020–21 school year) on three topics:classes that had moved to a distance learning format usingonline resources, availability of computers and internetaccess to children for educational purposes, and schoolsor school districts as providers of computers and internet.Findings related to September 2020 are also presented byracial/ethnic group and household income level.According to HPS data, 52 million adults had childrenunder age 18 in the home enrolled in school in September2020 (i.e., coinciding with the September 2 to September14 data collection).10 Overall, 89 percent of these adultsreported that classes for their children were affected insome way by the pandemic and two-thirds (67 percent)reported that classes for their children had moved toa distance learning format using online resources.11 Bycomparison, in April 2020 (i.e., coinciding with the April23 to May 5 data collection) nearly all adults reported thattheir children’s classes were affected by the pandemic(99.6 percent) and a higher percentage reported that theirchildren’s classes had moved to a distance learning formatusing online resources (72 percent).12The Condition of Education 2021 1
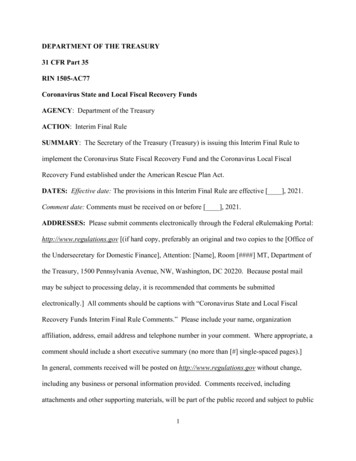
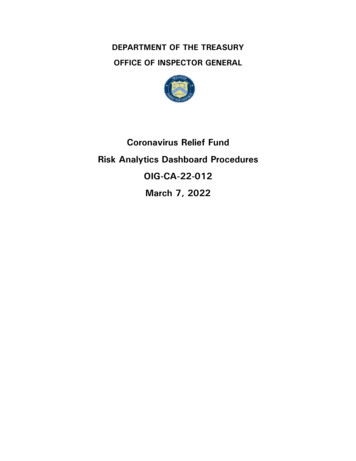
Impact of the Coronavirus Pandemic on the Elementary andSecondary Education SystemChapter: 2/Preprimary, Elementary, and Secondary EducationSection: TechnologyFigure 1. Among adults 18 years old and over who had children under age 18 in the home enrolled in school, percentagereporting that classes for children had moved to a distance learning format using online resources, by race/ethnicity:September 2 to 14, hiteBlackHispanicAsianRace/ethnicity¹ Total includes other racial/ethnic groups not separately shown.NOTE: Race categories exclude persons of Hispanic ethnicity. Data in this figure are considered experimental and do not meet NCES standards for response rates. Thesurvey question refers to enrollment at any time during the 2020–21 school year.SOURCE: U.S. Department of Commerce, Bureau of the Census, Household Pulse Survey, collection period of September 2 to 14, 2020. See Digest of EducationStatistics 2020, table 218.80.The percentage of adults reporting that classes for theirchildren had moved to a distance learning format usingonline resources varied across racial/ethnic groups. InSeptember 2020, the percentage was highest for Asianadults (81 percent), followed by Hispanic and Black adults(71 and 68 percent, respectively), and lowest for Whiteadults (64 percent).The Condition of Education 2021 2
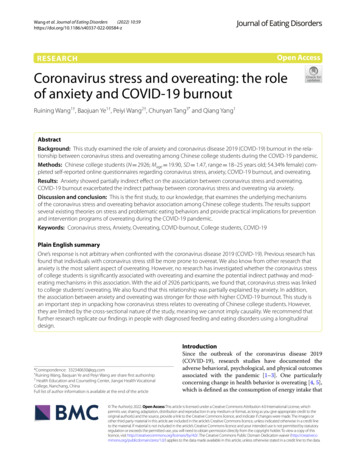
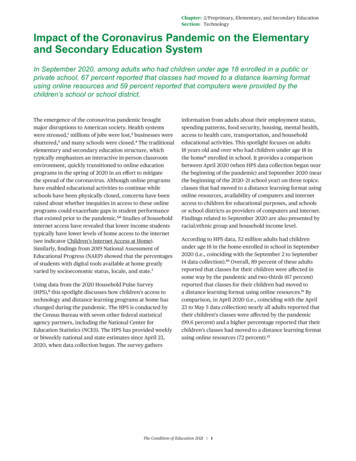
Impact of the Coronavirus Pandemic on the Elementary andSecondary Education SystemChapter: 2/Preprimary, Elementary, and Secondary EducationSection: TechnologyFigure 2. Among adults 18 years old and over who had children under age 18 in the home enrolled in school, percentagereporting that classes for children had moved to a distance learning format using online resources, by income level:September 2 to 14, 2020Percent1009080706365Less than 25,000 25,000 to 49,999686870 50,000 to 74,999 75,000 to 99,999 100,000 to 149,999726050403020100 150,000 or moreHousehold income level in 2019NOTE: Although rounded numbers are displayed, the figures are based on unrounded data. Data in this figure are considered experimental and do not meet NCESstandards for response rates. The survey question refers to enrollment at any time during the 2020–21 school year.SOURCE: U.S. Department of Commerce, Bureau of the Census, Household Pulse Survey, collection period of September 2 to 14, 2020. See Digest of EducationStatistics 2020, table 218.80.The percentage of adults reporting that classes for theirchildren had moved to a distance learning format usingonline resources also varied across households withdifferent levels of 2019 income. In September 2020,the percentage of adults reporting distance learningwas higher for those with a 2019 household income of 150,000 or more (72 percent) than for adults in thefour household income levels under 100,000 (rangingfrom 63 to 68 percent). In addition, the percentage ofadults with a household income of 100,000 to 149,999(70 percent) was higher than the percentages of adultswith a household income of less than 25,000 (63 percent)and 25,000 to 49,999 (65 percent).In September 2020, some 91 percent of adults reportedthat computers were always or usually available tochildren for educational purposes, compared with88 percent in April 2020. Additionally, 93 percent ofadults reported in September 2020 that internet accesswas always or usually available to children for educationalpurposes, compared with 91 percent in April 2020.The Condition of Education 2021 3
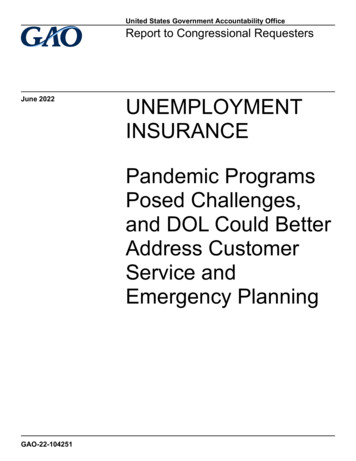
Chapter: 2/Preprimary, Elementary, and Secondary EducationSection: TechnologyImpact of the Coronavirus Pandemic on the Elementary andSecondary Education SystemFigure 3. Among adults 18 years old and over who had children under age 18 in the home enrolled in school, percentagereporting that computers and internet access were always or usually available to children for educational purposes, byrace/ethnicity: September 2 to 14, 100ComputersInternet otal includes other racial/ethnic groups not separately shown.NOTE: Race categories exclude persons of Hispanic ethnicity. Although rounded numbers are displayed, the figures are based on unrounded data. Data in this figure areconsidered experimental and do not meet NCES standards for response rates. The survey question refers to enrollment at any time during the 2020–21 school year.SOURCE: U.S. Department of Commerce, Bureau of the Census, Household Pulse Survey, collection period of September 2 to 14, 2020. See Digest of EducationStatistics 2020, table 218.85.1Both the percentage of adults reporting that computerswere always or usually available to children foreducational purposes and the percentage reporting thatinternet access was always or usually available to childrenfor educational purposes varied across racial/ethnicgroups. For example, in September 2020, the percentageof adults reporting that computers were always or usuallyavailable for educational purposes was highest for Asianadults (97 percent), followed by White adults (93 percent),and lower for Black and Hispanic adults (90 and88 percent, respectively). The same pattern was observedfor internet access.The Condition of Education 2021 4
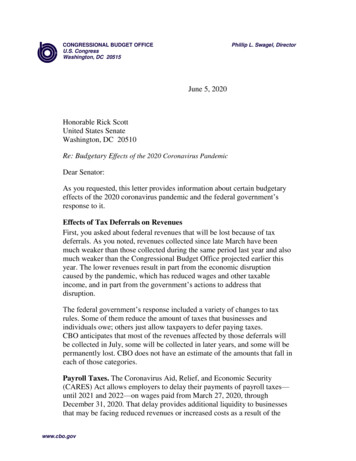
Chapter: 2/Preprimary, Elementary, and Secondary EducationSection: TechnologyImpact of the Coronavirus Pandemic on the Elementary andSecondary Education SystemFigure 4. Among adults 18 years old and over who had children under age 18 in the home enrolled in school, percentagereporting that computers and internet access were always or usually available to children for educational purposes, byincome level: September 2 to 14, 3020100ComputersInternet accessHousehold income level in 2019Less than 25,000 25,000 to 49,999 50,000 to 74,999 75,000 to 99,999 100,000 to 149,999 150,000 or moreNOTE: Although rounded numbers are displayed, the figures are based on unrounded data. Data in this figure are considered experimental and do not meet NCESstandards for response rates. The survey question refers to enrollment at any time during the 2020–21 school year.SOURCE: U.S. Department of Commerce, Bureau of the Census, Household Pulse Survey, collection period of September 2 to 14, 2020. See Digest of EducationStatistics 2020, table 218.85.The percentage of adults reporting that computers werealways or usually available to children for educationalpurposes and the percentage reporting that internetaccess was always or usually available to children foreducational purposes also varied across 2019 householdincome levels. In general, the percentage of adults whoreported that these resources were always or usuallyavailable increased with household income. For example,in September 2020, the percentage of adults reportingthat computers were always or usually available washighest for the two household income levels at or above 100,000 (96 percent for 100,000 to 149,999 and98 percent for 150,000 or more), followed by the twohousehold income levels between 50,000 and 99,999(92 percent for 50,000 to 74,999 and 93 percent for 75,000 to 99,999), and lowest for the two householdincome levels below 50,000 (83 percent for less than 25,000 and 87 percent for 25,000 to 49,999). Similarly,the percentage of adults reporting that internet accesswas always or usually available was higher for the threehousehold income levels at or above 75,000 (rangingfrom 96 to 97 percent) than for the three householdincome levels below 75,000 (ranging from 83 to93 percent).In September 2020, some 59 percent of adults reported atthat time that computers were provided by the children’sschool or school district, which was higher than thecorresponding percentage (39 percent). Some 4 percentof adults reported in September 2020 that internet accesswas paid for by the children’s school or school district,which was also higher than the corresponding percentagein April 2020 (2 percent).The Condition of Education 2021 5
Chapter: 2/Preprimary, Elementary, and Secondary EducationSection: TechnologyImpact of the Coronavirus Pandemic on the Elementary andSecondary Education SystemFigure 5. Among adults 18 years old and over who had children under 18 in the home enrolled in school, percentage reportingthat computers were provided and internet access was paid for by schools or school districts, by race/ethnicity:September 2 to 14, ters753!Internet accessRace/ethnicityTotal1WhiteBlackHispanicAsian! Interpret data with caution. The coefficient of variation (CV) for this estimate is between 30 and 50 percent.1Total includes other racial/ethnic groups not separately shown.NOTE: Race categories exclude persons of Hispanic ethnicity. Although rounded numbers are displayed, the figures are based on unrounded data. Data in this figure areconsidered experimental and do not meet NCES standards for response rates. The survey question refers to enrollment at any time during the 2020–21 school year.SOURCE: U.S. Department of Commerce, Bureau of the Census, Household Pulse Survey, collection period of September 2 to 14, 2020. See Digest of EducationStatistics 2020, table 218.90.The percentage of adults reporting that their children’sschool or school district provided computers and thepercentage reporting that their children’s school or schooldistrict paid for internet access varied across racial/ethnicgroups. In September 2020, the percentages of adults whoreported that their children’s school or school districtprovided computers were higher for Hispanic adults(68 percent) and Black adults (65 percent) than for Whiteand Asian adults (55 percent each). The percentage ofadults who reported that internet access was paid for bytheir children’s school or school district was also higherfor Black adults (7 percent) than for White and Asian adults(3 percent each). However, the percentage of Hispanicadults (5 percent) who reported that internet access waspaid for was not measurably different from the percentagefor any other racial/ethnic group.The Condition of Education 2021 6
Chapter: 2/Preprimary, Elementary, and Secondary EducationSection: TechnologyImpact of the Coronavirus Pandemic on the Elementary andSecondary Education SystemFigure 6. Among adults 18 years old and over who had children under 18 in the home enrolled in school, percentage reportingthat computers were provided and internet access was paid for by schools or school districts, by income level:September 2 to 14, uters63331Internet accessHousehold income level in 2019Less than 25,000 25,000 to 49,999 50,000 to 74,999 75,000 to 99,999 100,000 to 149,999 150,000 or moreNOTE: Although rounded numbers are displayed, the figures are based on unrounded data. Data in this figure are considered experimental and do not meet NCESstandards for response rates. The survey question refers to enrollment at any time during the 2020–21 school year.SOURCE: U.S. Department of Commerce, Bureau of the Census, Household Pulse Survey, collection period of September 2 to 14, 2020. See Digest of EducationStatistics 2020, table 218.90.In September 2020, both the percentage of adultsreporting that their children’s school or school districtprovided computers and the percentage reporting thattheir children’s school or school district paid for internetaccess were generally higher for those with lower 2019household incomes. For example, the percentages ofadults reporting that internet access was paid for by theirchildren’s school or school district were highest for thosein the two bottom household income levels (8 percentfor less than 25,000 and 6 percent for 25,000 to 49,999), while the percentage was lowest for those with ahousehold income of 150,000 or more (1 percent).The Condition of Education 2021 7
Impact of the Coronavirus Pandemic on the Elementary andSecondary Education SystemChapter: 2/Preprimary, Elementary, and Secondary EducationSection: TechnologyEndnotes:1 Melvin, S.C., Wiggins, C., Burse, N., Thompson, E., and Monger,M. (2020, July). The Role of Public Health in COVID-19 EmergencyResponse Efforts From a Rural Health Perspective (PreventingChronic Disease, Vol. 17, E70), Centers for Disease Control andPrevention. Retrieved February 9, 2021, from https://www.cdc.gov/pcd/issues/2020/20 0256.htm#T2 down. Blumenthal,D., Fowler, E.J., Abrams, M., and Collins, S.R. (2020, July).COVID-19—Implications for the Health Care System, New EnglandJournal of Medicine, 383, 1438–1488. Retrieved February 9, 2021,from 8.2 Handwerker, E.W., Meyer, P.B., Piacentini, J., Schultz, M.,and Sveikauskas, L. (2020, December). Employment Recoveryin the Wake of the COVID-19 Pandemic (Monthly Labor Review),U.S. Bureau of Labor Statistics. Retrieved February 9, 2021,from ntrecovery.htm.3 U.S. Bureau of Labor Statistics. (2021, January 27), QuarterlyData Series on Business Employment Dynamics News Release(Economic News Release). Retrieved February 9, 2021, fromhttps://www.bls.gov/news.release/cewbd.htm.4 Education Week. (2020, March 6). Map: Coronavirus and SchoolClosures in 2019–2020. Retrieved February 9, 2021, from and-schoolclosures-in-2019-2020/2020/03.5 U.S. Department of Education, National Center for EducationStatistics, The Condition of Education 2020, Reading Performance.Retrieved February 9, 2021, from https://nces.ed.gov/programs/coe/indicator/cnb; and Mathematics Performance. RetrievedFebruary 9, 2021, from https://nces.ed.gov/programs/coe/indicator/cnc.6 U.S. Department of Education, National Center for EducationStatistics, National Assessment of Educational Progress, ResultsFrom the 2019 Mathematics and Reading Assessments at Grade 12.Retrieved February 9, 2021, from ortive files/2019 infographic G12 mathreading.pdf.7 U.S. Department of Education, National Center for EducationStatistics, NAEP PLUS. Are U.S. Students Prepared to Learn OnlineWhen Schools Need to be Closed? [Blog post]. Retrieved February9, 2021, from earning.aspx.8 The speed of the survey development and the pace of thedata collection efforts led to policies and procedures forthe experimental HPS that were not always consistent withtraditional federal survey operations. For example, the timelinefor the surveys meant that opportunities to follow up withnonrespondents were very limited. This has led to response ratesof 1 to 10 percent, which are much lower than the typical targetresponse rate set in most federal surveys. While the responseshave been statistically adjusted so that they represent the nationand states in terms of geographic distribution, sex, race/ethnicity,age, and educational attainment, the impact of survey bias hasnot been fully explored.9 On average, each household had 1.97 children during the periodof September 2 to September 14, 2020.10 The survey question refers to enrollment at any time during the2020–21 school year.11 Since this survey is designed to represent adults 18 yearsold and over, the percentages reflect the responses of adultsconcerning children under 18 within their households, not thepercentages of the students themselves.12 About 66 million adults reported that they had children underage 18 in the home enrolled at a public or private school for theperiod of April 23 to May 5, 2020.Reference tables: Digest of Education Statistics 2020, tables218.80, 218.85, and 218.90Glossary: Distance education; Household; Private school; Publicschool or institution; Racial/ethnic groupRelated indicators and resources: Children’s Internet Accessat Home; Impact of the Coronavirus Pandemic on Fall Plansfor Postsecondary Education; Student Access to Digital LearningResources Outside of the ClassroomThe Condition of Education 2021 8
2/Preprimary, Elementary, and Secondary Education Section: Technolo1y Impact of the Coronavirus Pandemic on the Elementary and Secondary Education System In September 2020, among adults who had children under age 18 enrolled in a public or private school, 67 percent reported that classes had moved to a distance learning format