Transcription
SPECIAL PROJECT REPORTComparison of Performance of the WashingtonMetropolitan Area Transit Authority (WMATA) to theChicago Transit Authority (CTA)May 13, 2021
BackgroundOIG was requested by the Board Vice Chair to compare the performance of the CTA to WMATAto determine whether or not the two transit authorities’ policies, practices, and operationalphilosophies resulted in different performance outcomes. In several national transit reports,CTA is reported to operate with lower costs and better asset utilization than most other largetransit authorities. Our review sought to understand the reported data and to determine if therewere any operational or business practices employed by CTA that WMATA may want toconsider in future strategic planning efforts.Our benchmarking was a high-level review only, and we have predominantly relied on datafrom the FTA National Transit Data Base to obtain comparable historical data, where available.We obtained additional data from CTA Financial Statements and Board materials, and wespoke with CTA to understand their current challenges and the maturity of some of their morecritical business programs.We also interviewed WMATA senior leadership and program managers (Operations, Finance,Planning) and staff and discussed their thoughts about pandemic recovery and adjusting toshifting demands. We garnered insights from WMATA staff who worked at CTA previously.They provided very helpful observations from their experiences in both organizations. We alsointerviewed WMATA staff who routinely benchmark WMATA to U.S. and foreign transitperformance standards and metrics. The Office of Transit Performance Management(PERF) provided valuable assistance in clarifying WMATA’s key focus areas and metrics forperformance management, performance reporting, and performance improvement, includingits use of routine benchmarking with other transit properties. 1OIG used FY 2019 as our ‘base’ year for CTA and WMATA as these are the latest FTA DataBase records available. 2 We recognize there are differences in Fiscal Year start and endperiods between the two authorities; however, we did not attempt to obtain monthlyperformance data as performance and fiscal trends for both authorities track consistently.We extended our review to include service and performance impacts through the FY 20202021 pandemic period as data were available. We then reviewed both WMATA and CTA’srevised FY 2022 and out-year budget and planning assumptions to draw some further parallels.To better understand CTA’s and WMATA’s relative performance, we reviewed and comparedother aspects of both authorities, including: governance models;funding and financing sources;operating and farebox recovery philosophies;similarities and differences in major expense drivers;1The PERF is a unit within the Operations Budget, Performance and Planning (OBPP). The OBPP provides administrative and analyticalsupport for the Chief Operating Officer and operating departments. OBPP responsibilities include COO budget management and analysis,rail transportation and technical training, workforce availability management, bus and rail service planning and scheduling, and transitperformance management.2WMATA’s fiscal year is July 1 to June 30. CTA’s fiscal year is January to December.-2-“This document contains sensitive confidential information and is the property of the WMATA Office of Inspector General (OIG). It shall not be copied or reproduced without the written consent ofthe OIG. This document is for OFFICIAL USE ONLY. Its disclosure to unauthorized persons is prohibited in accordance with WMATA P/I 7.8.10/5 – Code of Ethics, Section 5.07. It must beprotected during transmission, handling and storage in accordance with WMATA P/I 15.12/2 – Data Sensitivity.”
pandemic impacts and response; and,strategic implications for paths forward.During the CTA review and this benchmarking exercise, it became apparent that CTA and otherauthorities are looking beyond the pandemic and are undertaking deeper, longer term reviewsof their mission and services to find ways to make their services more relevant.A number of transits had been experiencing slow and steady ridership declines year-over-yearheading into the pandemic. The pandemic impacts may have accelerated these declines andare leading transit authorities into uncharted territory; however, the responses from WMATA,CTA, and several other transit authorities show a strong willingness to use non-traditional waysto reimagine their service offerings and increase their relevance to their customers andstakeholders.We conclude our report with lessons learned and observations for both the Board and WMATAmanagement consideration and further upcoming strategic planning discussions.Executive SummaryAny high-level comparison with another urban/suburban transit authority has to be qualifiedwith the caveat that some results may be materially affected by variable demographics, transituse culture, and other factors that contribute to different outcomes; however, there remainfindings that are worthy of review and consideration for applying best or better practice oversimilar activities.Key observations from the CTA benchmarking include: CTA and WMATA are comparable transit authorities;CTA has lower costs to operate, overall, partly because CTA has a smaller workforce,no significant police/paratransit accountabilities, and a large part-time work force;CTA’s bus and rail systems, by design and practice, have had greater connectivity;CTA has higher average daily hours per peak bus;Both CTA and WMATA are reviewing the adequacy of bus and rail network design,scheduling, and affordability to increase modal share and ensure equity;Pandemic impacts and response were similar in employee and customer safety actionsand protocols; however, CTA ran near full service throughout the pandemic; andWMATA reduced service but accelerated capital and maintenance work with greateraccess to key assets; and,CTA is projecting a faster return to pre-pandemic ridership levels (80 percent recoveryby 2023).Key Observations for Board and Management Strategic Planning: WMATA has multiple programs, planning efforts, and outreach underway to underpinnew strategies and present options to the Board;Federal relief funding buys time, not solutions;-3-“This document contains sensitive confidential information and is the property of the WMATA Office of Inspector General (OIG). It shall not be copied or reproduced without the written consent ofthe OIG. This document is for OFFICIAL USE ONLY. Its disclosure to unauthorized persons is prohibited in accordance with WMATA P/I 7.8.10/5 – Code of Ethics, Section 5.07. It must beprotected during transmission, handling and storage in accordance with WMATA P/I 15.12/2 – Data Sensitivity.”
Better/new metrics are needed to define success;Given uncertainties, designing in scalability and agility in operations and capital planningis necessary;Some assumptions in the current Strategic Plan are no longer valid;WMATA’s Strategic Plan needs to be tied to Business Plan Outcomes:Mid-day, non-peak, and all-day service options offer potential opportunities for attractingridership and increasing revenues;Managing labor expenses, overheads and productivity remain critical;WMATA’s business systems are not all mature;WMATA’s Board has a shared responsibility with management to ensure effectivestrategic planning.These findings are discussed in greater detail in the remainder of our Report.-4-“This document contains sensitive confidential information and is the property of the WMATA Office of Inspector General (OIG). It shall not be copied or reproduced without the written consent ofthe OIG. This document is for OFFICIAL USE ONLY. Its disclosure to unauthorized persons is prohibited in accordance with WMATA P/I 7.8.10/5 – Code of Ethics, Section 5.07. It must beprotected during transmission, handling and storage in accordance with WMATA P/I 15.12/2 – Data Sensitivity.”
I.Baseline Comparison Between CTA and WMATACTASuburban & Urban2nd Largest U.S, System3.5 million populationservedOperates More as “OneSystem”More Bus-Centric/Higher Transfer Rate(40%)CTA Lower CostsFewer employees,lower fringe rates, andflexible work rulesLess Complex SystemSimilarly SizedMarketsRail-Bus Network DesignCosts to OperateOperatingExpense/Passenger MileOperatingExpense/Vehicle MileWMATASuburban & Urban5th Largest U.S. System3.7 million populationservedOperates More As “TwoSystems”More Rail-Centric/Lower Transfer Rate(14%)WMATA Higher CostsFTE Reductions since2017Police & Security CostsWMATA-OwnedMTPDSupplied By RegionalTransit Authority (RTA)and PACEMandated by StateStatute ( 50% forRegional TransitAuthority)39.4% TotalFlexibilities with PartTime Work ForceParatransit ServicesWMATA-OwnedMetro AccessNo substantive changesMajor Bus/Rail FleetProcurementsOperated Full ServiceDuring Pandemic5-Year Capital PlanContract- Chicago PDCautiously OptimisticUp to 80% PrePandemic Ridership byFY 2023Farebox RecoveryWork RulesPandemic ResponsePost Pandemic RecoveryPace-5-No mandateRail Recovery HigherBus Recovery Lower45.1% TotalMore ConstrainedNo substantive changesMajor Bus/Rail FleetProcurementsReduced Service-PhasedRestart AcceleratedCapital and MOW/MOEMore Conservative34% of Pre-pandemicRidership in FY 2022“This document contains sensitive confidential information and is the property of the WMATA Office of Inspector General (OIG). It shall not be copied or reproduced without the written consent ofthe OIG. This document is for OFFICIAL USE ONLY. Its disclosure to unauthorized persons is prohibited in accordance with WMATA P/I 7.8.10/5 – Code of Ethics, Section 5.07. It must beprotected during transmission, handling and storage in accordance with WMATA P/I 15.12/2 – Data Sensitivity.”
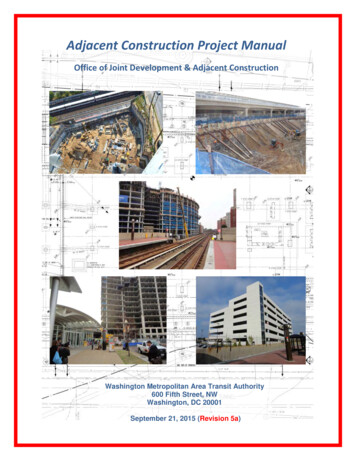
CTA and WMATA Rail SystemsCTA Rail SystemWMATA Rail System118 miles224 Miles - 145 Stations-91 StationsWMATA and CTA Bus Systems-6-“This document contains sensitive confidential information and is the property of the WMATA Office of Inspector General (OIG). It shall not be copied or reproduced without the written consent ofthe OIG. This document is for OFFICIAL USE ONLY. Its disclosure to unauthorized persons is prohibited in accordance with WMATA P/I 7.8.10/5 – Code of Ethics, Section 5.07. It must beprotected during transmission, handling and storage in accordance with WMATA P/I 15.12/2 – Data Sensitivity.”
Base System Comparison for CTA and WMATA for FY 2019ATTRIBUTE/METRICService AreaCTA310 sq miles3.5 millionpop.WMATA950 sq miles3.72 million pop.CommentsSimilar population served; CHI Metro isalso served by Metra commuter rail andPACE (6-county suburban bus systemsw/regional paratransit). Washingtonregion is served by MDOT/MARC/VRE/VDOT.CTA has 20% more buses running longerdaily hoursWMATA has twice as many separatelydesignated bus routes. Bus servicesdiscussed later in report.Annual Psgr. Miles1.960 B1.705 BBus ServiceCoverage129 routes1,536 miles10,768 stopsRail ServiceCoverage102.8 miles145 stations269 routes2,369 miles11,129 stops 2,554 bus shelters118 miles91 stationsFleet – ServiceNeedsRailBusFare Revenues1164 RailCars1566 Busses920 Rail Cars1286 BussesFleet count represents Vehicles Operatedin Maximum Service. Average age of busfleets very similar. 588.7 M All 309.5 M Rail 279.2 M Bus 653.8 M All 533.5 M Rail 120.3 M BusWMATA is more rail-centric; revenuesfrom on-call service (on demand) areexcludedOperating Expenses 1.448 B Tot. .623 B Rail .824 B Bus 2.019 B Tot.* 1.113 B Rail .732 B BusSignificant delta is Rail OperatingExpenses 78.7 % higher.Operating Expense/Vehicle Revenue Mile(RM) 11.45 Total 8.47 Rail 15.61 Bus 13.98 Total 13.07 Rail 19.56 BusWMATA 22% Higher TotalWMATA 54% Higher RailWMATA 25% Higher BusOperating Expense/Passenger Mile (PM) 0.74 Total 0.45 Rail 1.42 Bus 1.18 Total 0.85 Rail 1.99 Bus59% Higher Total89% Higher Rail40% Higher BusOperating ExpenseLabor 1.15 B 1.31 B 1.17 B**After adjustments for police/paratransit,almost identical total labor costs.Operating ExpenseMaterials & Supplies 108.0 M 137.9 MComparableOperating ExpenseFuel & PowerOperating ExpensePolice & SecurityParatransit 71.9 M 88.6 MComparable 14.9 M 63.7 M 18.2 M(PACE) 162.0 MWMATA’s Police Department accounts for 48.8 million in annual expense difference.PACE para-transit accounts for 143.8million expense difference.CTA’s “L” service is "heavy rail rapidtransit," above ground, in subway tunnelsand tubes, and at grade/ expresswaymedians. Red and Blue Lines operate24/7. CTA’s stations are closer.* (Excludes demand response) ** Adjusted for Police and Paratransit-7-“This document contains sensitive confidential information and is the property of the WMATA Office of Inspector General (OIG). It shall not be copied or reproduced without the written consent ofthe OIG. This document is for OFFICIAL USE ONLY. Its disclosure to unauthorized persons is prohibited in accordance with WMATA P/I 7.8.10/5 – Code of Ethics, Section 5.07. It must beprotected during transmission, handling and storage in accordance with WMATA P/I 15.12/2 – Data Sensitivity.”
II.CTA and WMATA Have Similar Regional Governance ModelsCTAWMATAIndependent Governmental AgencyInterstate Compact AgencyCreated by the Metropolitan TransitAuthority Act (70-ILCS-3605)Created by MD, VA & DC effectiveFebruary 20, 1967, with Consent ofCongressOverseen by 7- member boardOverseen by 8 voting & 8 alternatedirectorsAppointments made by Governor &Mayor of Chicago (Governorapproves Mayor’s appointees;Illinois State Senate & Mayorapprove Governor appointees)MD, DC, VA & Federal Governmentappoint 2 voting & 2 alternatedirectors each. (VA – Directorsappointed by Northern VA Transp.Commission; DC – Council; MD byWash. Suburban Transit Commission;and for the Federal Government, GSAHeavy suburban and commuter railnetwork by RTA agenciesMetra and PACEHeavy suburban and commuter railnetwork operated by VRE and MARC& inter-connected bus network from all3 jurisdictionsServices are wholly within onestateMulti-jurisdictional authority requiring afinancial plan that includes capitalfunding agreement, 6-yr capitalimprovement program, & annualbudget.-8-“This document contains sensitive confidential information and is the property of the WMATA Office of Inspector General (OIG). It shall not be copied or reproduced without the written consent ofthe OIG. This document is for OFFICIAL USE ONLY. Its disclosure to unauthorized persons is prohibited in accordance with WMATA P/I 7.8.10/5 – Code of Ethics, Section 5.07. It must beprotected during transmission, handling and storage in accordance with WMATA P/I 15.12/2 – Data Sensitivity.”
OIG ObservationsWMATA, unlike CTA where services are wholly within one state, is a multijurisdictional authority that is more complex to govern, fund, and operate.The challenges faced by CTA and WMATA’s boards, and all transit boards in apost-pandemic setting, are to determine how best to align their services toimprove accessibility. The boards, representing many interests outside theauthorities’ control, have a shared responsibility to help management increaseaccessibility and rail/bus mobility options. Support can extend beyond transit-totransit connectivity and include other aspects of transportation planning,including land use planning; transit-oriented development; highway planning;traffic pattern management; and, congestion pricing, among others.-9-“This document contains sensitive confidential information and is the property of the WMATA Office of Inspector General (OIG). It shall not be copied or reproduced without the written consent ofthe OIG. This document is for OFFICIAL USE ONLY. Its disclosure to unauthorized persons is prohibited in accordance with WMATA P/I 7.8.10/5 – Code of Ethics, Section 5.07. It must beprotected during transmission, handling and storage in accordance with WMATA P/I 15.12/2 – Data Sensitivity.”
III.CTA and WMATA’s Operating ExpensesAs reported to FTA, CTA’s 2019 operating expenses were 1.448 billion as compared toWMATA’s operating expenses of 2.019 billon. The pie charts below identify the majorexpense categories for each authority. Adjusting for police and paratransit, WMATA’sOperating Expenses were 1.826 billion.CTA Annual Operating ExpensesWMATA Annual Operating Expenses 33WMATA’s designation of 407,639,172 million “Other Operating Expenses” includes: Services 281,307,449; Utilities 88,577,882;Casualty & Liability 34,502,146; and, Miscellaneous 3,251,695, totaling 407,639,172. Source, WMATA Finance.- 10 -“This document contains sensitive confidential information and is the property of the WMATA Office of Inspector General (OIG). It shall not be copied or reproduced without the written consent ofthe OIG. This document is for OFFICIAL USE ONLY. Its disclosure to unauthorized persons is prohibited in accordance with WMATA P/I 7.8.10/5 – Code of Ethics, Section 5.07. It must beprotected during transmission, handling and storage in accordance with WMATA P/I 15.12/2 – Data Sensitivity.”
Operating Expense Per Passenger MileUsing one metric, it is accurate to say that CTA has lower costs to operate per passenger milefor both bus and rail service. In the chart below (prepared by CTA), CTA uses a single metric,Operating Cost/Passenger Mile, to illustrate how its cost of .69 Operating Cost/PassengerMile compares to other large transits. 4OIG ObservationsThis performance metric is important and has merit, but like any single metric, itneeds full context that accounts for differences in the various transits’ operatingenvironments.Police and Paratransit expenses account for approximately 192 million annuallyfor WMATA. CTA does not own those services and relies on external agencies;therefore these costs are borne mostly by those agencies. After removing thosecosts, WMATA’s operating expense per passenger mile changes from 1.05 to 0.94. The majority of the remaining difference in expenses is primarily the resultof staffing and collective bargaining agreements.4Invest in Transit, The 2018-2023 Regional Transit Strategic Plan for Chicago and Northeastern Illinois, February 2020, p. 2.- 11 -“This document contains sensitive confidential information and is the property of the WMATA Office of Inspector General (OIG). It shall not be copied or reproduced without the written consent ofthe OIG. This document is for OFFICIAL USE ONLY. Its disclosure to unauthorized persons is prohibited in accordance with WMATA P/I 7.8.10/5 – Code of Ethics, Section 5.07. It must beprotected during transmission, handling and storage in accordance with WMATA P/I 15.12/2 – Data Sensitivity.”
IV.CTA and WMATA Funding and Financing SourcesOn average, directly generated revenues fund 36.2 percent of public transit operating expensesin the United States. 5 Local and State sources fund 33.2 percent and 22.8 percent,respectively; and, the Federal Government directly funds the remaining 7.8 percent. 6 MostFederal funding is used for capital expenses, with the notable exception of the CARES Act andCoronavirus Response and Relief Supplemental Appropriations Act, which provided operatingfunds to help transits manage the pandemic impacts.FY 2019 Funding Sources for U. S. Transit OperationsFor CTA, the State of Illinois authorizes the parent Regional Transit Authority (RTA) to assessa sales tax throughout the six-county Northeastern Illinois region. The sales tax is collected bythe Illinois Department of Revenue and held in trust for the RTA. The sales tax rates differ byarea served in order to recognize the levels of transit service provided in the six-county region.In Cook County the RTA imposes a 1.25% sales tax whereas in DuPage, Kane, Lake,McHenry, and Will Counties the rate is .50%. The RTA sales tax was expected to generateapproximately 1.3 billion in 2020 for regional services.In 2008, the City of Chicago began imposing an additional Real Estate Transfer Tax (RETT)on real property located in the City. There is a supplemental tax of 1.50 per 500 of the transferprice imposed on all real estate sales within the City for the purpose of providing financialassistance to the CTA. This supplemental tax rate is in addition to the tax rate of 3.75 per 500 of the transfer price that the City already imposed prior to 2008. The CTA’s portion of theRETT was projected to be approximately 69 million in 2020.5Directly generated revenues include fare revenues, advertising, parking, etc. Federal funding can benefit WMATA indirectly throughprograms that facilitate WMATA’s services, e.g. – grants for dedicated bus highway lanes.62018 National Transit Summaries and Trends, Office of Budget and Policy December 2019; NTD Report Year 2018.- 12 -“This document contains sensitive confidential information and is the property of the WMATA Office of Inspector General (OIG). It shall not be copied or reproduced without the written consent ofthe OIG. This document is for OFFICIAL USE ONLY. Its disclosure to unauthorized persons is prohibited in accordance with WMATA P/I 7.8.10/5 – Code of Ethics, Section 5.07. It must beprotected during transmission, handling and storage in accordance with WMATA P/I 15.12/2 – Data Sensitivity.”
OIG ObservationsWhen comparing CTA with WMATA, the sources of operating funds are very similar, withthe exception of local tax support for CTA.- 13 -“This document contains sensitive confidential information and is the property of the WMATA Office of Inspector General (OIG). It shall not be copied or reproduced without the written consent ofthe OIG. This document is for OFFICIAL USE ONLY. Its disclosure to unauthorized persons is prohibited in accordance with WMATA P/I 7.8.10/5 – Code of Ethics, Section 5.07. It must beprotected during transmission, handling and storage in accordance with WMATA P/I 15.12/2 – Data Sensitivity.”
V.CTA and WMATA – Pricing Strategies and Farebox RecoveryPricing StrategiesImportant differences between CTA and WMATA are the authorities’ approaches to farestrategies and service coverage for the rail and bus networks. Transit providers across theU.S. have developed different business models in structuring, maintaining, and pricing theirservices. These approaches are often defined, and sometimes mandated, by the transitproviders’ public or quasi-public status: Cities/Counties operate services as a government social utility;Transit Authorities empowered by multiple jurisdictions operate services for their jointbenefit within prescribed budget allowances and constraints of the locality/region;State-owned and controlled services are heavily controlled by State DOTs and by Statestatutes; and,Independent contractors maintain and operate bus and rail services under serviceagreements, with ownership usually retained by the contracting entity.OIG ObservationsBecause of these differing operating philosophies, comparisons among andbetween transit authorities can be difficult. CTA and WMATA are more similar inthat they are independent authorities governed by boards.Transit Operators by Type in the United StatesNationally, 29 percent of transit providers, like CTA and WMATA, are independent publicauthorities led by boards. 772018 National Transit Summaries and Trends, Office of Budget and Policy December 2019; NTD Report Year 2018.- 14 -“This document contains sensitive confidential information and is the property of the WMATA Office of Inspector General (OIG). It shall not be copied or reproduced without the written consent ofthe OIG. This document is for OFFICIAL USE ONLY. Its disclosure to unauthorized persons is prohibited in accordance with WMATA P/I 7.8.10/5 – Code of Ethics, Section 5.07. It must beprotected during transmission, handling and storage in accordance with WMATA P/I 15.12/2 – Data Sensitivity.”
Farebox Recovery – Balancing Ridership and AccessFarebox recovery is one of the more common metrics by which transits measure theeffectiveness of their operations. CTA, like WMATA, generates revenue from both farebox andnon-farebox revenues. CTA also receives supplemental funding for operating expenses fromthe RTA. The RTA oversees local transportation operators in the six-county Chicagometropolitan area. State law requires that the three RTA agencies, CTA, Metra (the suburbanrail system) and Pace (the suburban bus system) recover collectively at least 50 percent ofoperating costs from farebox and other system revenues. 8 Historically, and consistent withmany transit operations, CTA’s rail services cover more of their operating expenses than busservices ( 50%). During the pandemic, the Illinois statutory farebox recovery mandate waspaused, but a number of transit advocates are calling for a revision or revocation of thisstatutory requirement going forward. 9Unlike CTA and WMATA, a small number of U.S. transit providers view their transit servicesalmost as a ‘social utility’ (managing farebox recovery to a bare minimum that just meets FTAfunding requirements of 20% recovery). Others operate their services using a quasi-privatebusiness model (mandated goals for farebox recovery) and also emphasize more traditionalfinancial performance metrics (sales; revenue growth and yield; return on assets). Dependingupon the over-arching operating philosophy, transits adopt fare strategies that support theirauthorities’ mandates. CTA’s fare strategies are largely dictated by State statute; the RTArequires that all authorities collectively obtain at least a 50 percent farebox recovery fromoperating their services.WMATA, as a multi-jurisdictional transportation provider, has adopted fare strategies that seekto balance service levels among the three jurisdictions served, and maintain a fare structureand pricing strategy that provide higher levels of return for rail and greater levels of access forbus. WMATA predominantly uses a mileage-based fare structure, with longer trips requiringhigher fares. WMATA has not sought to prioritize rail ridership over revenues and,subsequently, WMATA posts one of the highest farebox recovery rates for rail in the U.S.Another important point is that comparing farebox recovery rates between bus and rail may notbe fair or meaningful. WMATA has a farebox recovery from rail, historically greater than 50percent (48 percent in 2019), and a lower recovery from bus operations, about 20 percent (17percent in 2019). CTA’s recovery rates for rail are similar, but CTA posts a much higher fareboxrecovery for bus (34 percent), due to greater use of its fleet in peak hours and use of part-timeemployees. 108RTA required PACE to achieve a 30.3 percent farebox recovery in 2019. Source: PACE THE SUBURBAN BUS DIVISION OF THEREGIONAL TRANSPORTATION AUTHORITY NORTHEASTERN ILLINOIS ANNUAL FINANCIAL REPORT, 2019.9“Public transit is critical to Chicago’s COVID-19 response,” Active Transportation Alliance; ical-to-chicagos-covid-19-response10Metro Fare Policy Primer, Final Report, WMATA Fare Strategy Working Group, May 2019, p. 19, and FTA NTD for 2019.- 15 -“This document contains sensitive confidential information and is the property of the WMATA Office of Inspector General (OIG). It shall not be copied or reproduced without the written consent ofthe OIG. This document is for OFFICIAL USE ONLY. Its disclosure to unauthorized persons is prohibited in accordance with WMATA P/I 7.8.10/5 – Code of Ethics, Section 5.07. It must beprotected during transmission, handling and storage in accordance with WMATA P/I 15.12/2 – Data Sensitivity.”
Average Farebox Recover Ratio - Heavy Rail & InternationalTransit SystemsCTA50%WMATA Metrorail48%U.S. Heavy Rail Average41%U.S. Commuter Rail Average40%Int'l Transit System Average63%0%10%20%30%40%50%60%70%80%90%100%Average Farebox Recover Ratio - U.S. Bus SystemsCTA34%WMATA Metrobus17%National Bus Average24%0%10%20%30%- 16 -40%50%60%70%80%90%100%“This document contains sensitive confidential information and is the property of the WMATA Office of Inspector General (OIG). It shall not be copied or reproduced without the written consent ofthe OIG. This document is for OFFICIAL USE ONLY. Its disclosure to unauthorized persons is prohibited in accordance with WMATA P/I 7.8.10/5 – Code of Ethics, Section 5.07. It must beprotected during transmission, handling and storage in accordance with WMATA P/I 15.12/2 – Data Sensitivity.”
VI.CTA’s Bus and Rail Systems Have Service FlexibilityFrom the planning and scheduling perspective, CTA is generally very efficient at serving busand rail ridership markets and is sensitive to service demand. The CTA Service Standards andavailability of part-time workers (bus operators, motor operators, conductors, flaggers and rapidtransit operators) allow more flexibility to adjust schedules. 11 For instance, both bus and railheadways are increased and scalable during AM and PM rush hours, and then decreased asneeded.Service frequencies can also be timely adjusted for specific markets. The CTA Red Line canbe operated more frequently southbound in the AM rush than northbound. In the evening, thispattern is reversed so there is more Red Line service going northbound thansouthbound. Each CTA rail line is scheduled independently, and there is more leeway toadjust service levels based on the Service Standards.In the chart below, for our base year, CTA operated 22 percent more buses, had greaterAverage Daily Hours of Service Per Peak Bus, and generated 94 percent more passenger tripsthan WMATA’s bus services. WMATA’s average daily hours of service per peak bus were onlyeight hours versus a peer average of ten hours. 12WMATA recognizes there are more opportunities in its bus market and launched theWashington Area Bus Transformation Project in September 2019, concluding that the bussystem was not keeping pace with the population growth and demand for faster, more reliableservice. WMATA was progressing with its bus network transformation when the pandemic11WAGES
WMATA's Board has a shared responsibility with management effective to ensure strategic planning. These findings are discussed in greater detail in the remainder of our Report. - 5 - "This document contains sensitive confidential information and is the property of the WMATA Office of Inspector General (OIG). It shall not be copied or .


![Office 2010 Professional Plus Com Ativador Serial Keyl [EXCLUSIVE]](/img/61/office-2010-professional-plus-com-ativador-serial-keyl-exclusive.jpg)
