Transcription
1Southeast Wisconsin’sPewaukee LakeBiological Evaluation 2000Wisconsin Lutheran College, Biology Dept.Technical Bulletin 002, May 2001Prepared byAngela L. SchmoldtRobert C. Anderson, PhDProject sponsored byMiller Friends of the Field andThe Foundation for Wildlife Conservation, Inc.
2IntroductionPewaukee Lake in Waukesha County, Wisconsin is an urban lake that is a veryimportant recreational source to the area. The valley that Pewaukee Lake fills wasdeepened by a glacier and then blocked off in the west end to form a basin. This initiallake was known as Snail Lake (Fennelman 1910). Then, around 1838, a dam was built inthe only outlet, Pewaukee River, and the present lake was formed. The dam raised thewater level approximately six feet, which caused the previously swampy east basin of thelake to flood (SEWRPC 1984). The building of the dam caused Pewaukee Lake tobecome the popular recreational lake that it is today.Pewaukee Lake has four inlet sources, Zion Creek, Audley Creek, and twounnamed tributaries (SEWRPC 1984). It is also fed by springs, especially along the northside (Fennelman 1910). The lake covers 2,446 acres and has a volume of 34,552 acrefeet. Approximately 15 percent of the lake area is less that five feet deep, 60 percent ofthe lake area is between five and 20 feet deep, and 25 percent has a depth of more that 20feet. The mean depth is 15 feet and the maximum depth is 45 feet. Pewaukee Lake is 1.4miles wide at its widest point and is 4.5 miles long. The west basin is considerablydeeper than the east basin. Muck is the predominant bottom sediment type, coveringapproximately 83 percent of the lake bottom. The remainder is 11 percent sand andgravel and 6 percent silt and rubble (SEWRPC 1984).The area of land that drains directly into Pewaukee Lake is 14,817 acres. Thisland is becoming increasingly populated and has been an urban area since 1930.Projections (SEWRPC 1996) indicate by 2010, 53.5 percent of the watershed will be
3urban land use and the remaining rural land use (mainly agriculture). The lake is almostcompletely surrounded by residential development.Pewaukee Lake was studied and classified as a eutrophic lake by Aqua Tech, Inc.in 1972 and by the Southeastern Wisconsin Regional Planning Commission (SEWRPC)in 1984. The purpose of this study is to determine the present state of Pewaukee Lakeand to initiate an annual monitoring program of Pewaukee Lake. To determine thepresent trophic status of Pewaukee Lake, benthic macroinvertebrate populations,zooplankton populations, and water chemistry were evaluated.Benthic macroinvertebrates can be used as water quality indicators since they arecontinually exposed to changes in both oxygen levels and nutrient levels (Saether 1979).Benthic macroinvertebrate populations are a result of what has already happened to thelake because they cannot easily move to a better environment if the conditions are notfavorable. The current populations will reflect conditions that have existed in the lake forsome time. According to the EPA (1999), benthic macroinvertebrate communitystructure will respond to dissolved oxygen levels and organic enrichment, both of whichare characteristics used to measure trophic levels of a lake.Zooplankton populations can also be used to indicate water quality and reflectpast problems of the lake. Zooplankton levels are controlled by both higher and lowertrophic levels. This means zooplankton levels reflect fish predation (high trophic levels)and nutrient levels which effect algae growth (low trophic levels). If there are lownumbers of large zooplankton, it indicates predation of zooplankton by planktivorousforage fish. If there are high numbers of zooplankton, it indicates an unlimited foodsupply, which could be caused by high nutrient levels in the lake. If both situations are
4found, few large zooplankton and many small zooplankton, then both extensive fishpredation and high nutrient levels may be influencing the zooplankton population (EPA1999). Zooplankton species composition has also been found to indicate the condition oflakes. For example, an increase in cladoceran populations may indicate an increase ineutrophication (Harman et al. 1997).Chemical and physical parameters measured in this study included dissolvedoxygen, water clarity, conductivity, pH, temperature, reactive phosphorous, nitrate,chloride, and ammonia. These measurements allow determination of the trophic statusof the lake and help predict future problems. They also will help determine if the lake iscapable of supporting a normal aquatic community. The dissolved oxygen readings areespecially important in determining the future of a lake by indicating how much life thelake can sustain. Chloride and ammonia levels can indicate pollution from surface waterrunoff. Phosphorous and nitrogen forecast potential plant and algae growth (Kevern etal. 1996).Through evaluation of the biological and chemical parameters described above,an overall assessment of the conditions of Pewaukee Lake was determined. It is hopedthat this information will be used in future lake management decisions and in establishingan annual monitoring program.MethodsBenthic macroinvertebrates, zooplankton, and water chemistry samples werecollected from various sites in Pewaukee Lake during the summer of 2000. The ninesample stations chosen represent three main parts of the lake (Figure 1).
5Benthic macroinvertebrate samples were collected at each site in June, July, andAugust of 2000. Samples were taken with a standard Eckman Dredge (150mm x150mm). Three grabs were done at each site. The contents of the dredge were emptiedinto Standard Mesh SS screen #30 (541 µm) bottomed bucket. This was used to filter outall the fine sediment and retain the organisms. The remaining sediment and the organismswere poured into a white basin so that all the organisms could be removed using forceps.Benthic macroinvertebrates were preserved in 90% ethanol and taken to the laboratory tobe counted and identified. Edmondson (1959), Merrit and Cummins (1978), and Pennek(1953) keys were used in identification. Finally, the number of benthicmacroinvertebrates per square meter of sediment was calculated.Zooplankton were sampled at three sites during July and August of 2000.Samples were taken at sites W2, M2 and E2 (figure 1) between 10:00 am and 12:00 pmto avoid variation due to vertical migration patterns of zooplankton. Two replicatesamples of water were pumped through a 153 µm zooplankton net from the surface, middepth, and near the bottom of sites W2 and E2. At site M2, samples were taken from thesurface, half the distance to the thermocline, at the thermocline, half the distance to thebottom from the thermocline, and at the bottom and filtered through the same net. Theduration of pumping was timed so that the equivalent of 5 gallons of water was pumpedat each depth. After the zooplankton were collected, club soda was administered to relaxthem prior to preservation in 80% ethanol.Three 1 ml subsamples were taken from each zooplankton sample jar and placedin a Sedgwick-Rafter cell for identification and enumeration. The contents of the samplejars were stirred during subsampling to insure a homogenous distribution of zooplankton
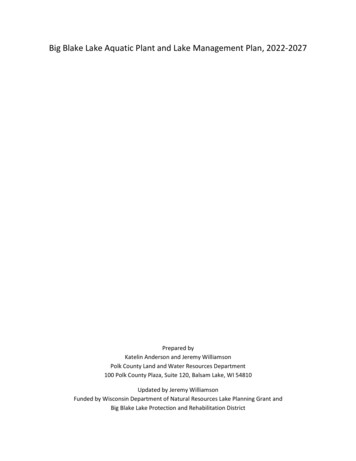
6in the sample. Edmondson (1959) and Pennak (1953) were used for identification.Finally, an estimate of the number of zooplankton in 1 liter of water was calculated.The water chemistry of Pewaukee Lake was also evaluated during the second andfourth weeks in July and the second week in August of 2000. Measurements were takenat the same sites and depths as the zooplankton. Chloride, nitrate, ammonia, and reactivephosphorus were measured using the Hach Drel 2000 Basic Water Quality Laboratory.Dissolved oxygen and water temperature were measured at half-meter increments fromthe surface to the bottom each time zooplankton or benthic macroinvertebrates werecollected using the Data Sonde 4 Hydrolab. Water clarity was measured with a Secchidisc. Time, weather, and lake conditions were also recorded.ResultsIn June, July, and August of 2000, a total of 544 benthic macroinvertebrates werecollected from Pewaukee Lake. Analysis of the sample revealed 18 different types of
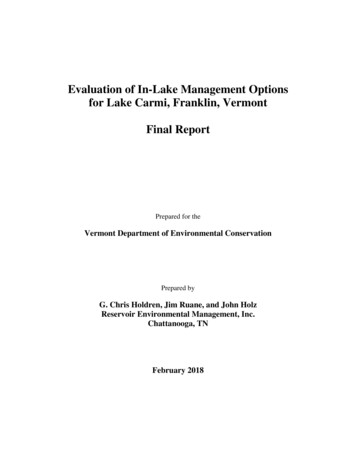
7organisms ranging from scuds to mayfly nymphs to midge larvae. The most commonmacroinvertebrate was Prodiamesa in the family Chironomidae (non-biting midges),which were found throughout the lake each month. Amphipoda, Emphemenoptera, andMegaloptera larvae were mostly found in the west and east ends of the lake. Leacheswere found mainly in the east end of the lake, and Chaoborus larvae were found only inthe deepest part of the lake where oxygen levels are low (Tables 1, 2, and 3).The west end and the middle sites had about the same number of benthicmacroinvertebrates, while the eastern sites were considerably lower in numbers persquare meter. And even though the number of macroinvertebrates per square meter ateach location seems to have no consistent pattern (Figures 2, 3, and 4), the averagenumber of organisms found per square meter in each part of the lake decreased as thesummer progressed (Figure 5).Table 1 : Estimated number of benthic macroinvertebrates per square meter in Pewaukee Lake, based on Echman dredgesamples taken in June,2000.W1Order: AmphipodaGammaridaeHaustoriidaeOrder: EmphemenopteraCaenidaeEphemeridaeOrder: MegalopteraSialidaeCeratopogonidaeFamily: eloanypusFamily: HirudineaOrder: OligocheateTubificidaeFamily: .91195
8Table 2 : Estimated number of benthic macroinvertebrates per square meter in Pewaukee Lake, based on Echman dredge samples taken inJuly,2000.W1Order: AmphipodaGammaridaeHaustoriidaeOrder: EmphemenopteraCaenidaeEphemeridaeOrder: MegalopteraSialidaeCeratopogonidaeFamily: eloanypusFamily: HirudineaOrder: OligocheateTubificidaeFamily: 49.388.9957.8Table 3 : Estimated number of benthic macroinvertebrates per square meter in Pewaukee Lake, based on Eckman dredge samples taken inAugust,2000.W1Order: AmphipodaGammaridaeHaustoriidaeOrder: EmphemenopteraCaenidaeEphemeridaeOrder: MegalopteraSialidaeCeratopogonidaeFamily: eloanypusFamily: HirudineaOrder: OligocheateTubificidaeFamily: 534.639.59.94.949.4128.444.424.629.619.8547.8
300Benthic 502JuneJulyAugust3002502001501000500W1W2W3M1Figure 2: Estimated number of benthic macroinvertebrates persquare meter in the west end of Pewaukee Lake, based onEckman dredge samples taken in June, July, and August of 2000.2300250200150100500E1E2E3Figure 4: Estimated number of benthic macroinvertebrates persquare meter in the east end of Pewaukee Lake, based on Eckmandredge samples taken in June, July, and August of 2000.M2M3Figure 3: Estimated number of benthic macroinvertebrates persquare meter in the middle of Pewaukee Lake, based on Eckmandredge samples taken in June, July, and August of 2000JuneJulyAugust350Benthic macroinvertebrates/m 2JuneJulyAugust350Benthic macroinvertebrates/mBenthic MiddleFigure 5: Average number of benthic macroinvertebratesper square meter in the west, middle, and east sections ofPewaukee Lake during June, July, and August of 2000.
10A total of 1,990 zooplankton were identified and enumerated in July and Augustof 2000 with 14 different types found. The most common zooplankton was the cyclopoidcopepod which was found throughout the lake except in the waters that had very littledissolved oxygen. There were consistently more copepods than cladocerans foundthroughout the lake and throughout the summer. A variety of Daphnia species werefound mainly in the shallow middle waters of Pewaukee Lake in July, and Diaphanosomabirgi were found only in August. Nearly no zooplankton were found below thethermocline in the middle of the lake (Tables 4, 5, and 6). In July, at the west end, thezooplankton density was greatest near the bottom of the water column while in Augustthe density was greatest near the surface (Figure 6). In the east end, the zooplanktondensity was greatest near the bottom of the water column in July and August (Figure 8).In the middle of Pewaukee Lake, the greatest concentration of zooplankton was found inthe surface waters and near the thermocline (Figure 7). Just as the number of benthicmacroinvertebrates per square meter decreased throughout the summer, the number ofzooplankton per liter also decreased at each site throughout the lake as the summerprogressed as shown in Figure 9.Table 4 : Estimated number of zooplankton per liter of water from Pewaukee Lake in July, 2000.Copepoda CyclopoidaCopepoda CalanoidNaulpiiAllona costaChydorus sphaericusEubosmina coregoniBosmina longirostrisCeriodaphnia sp.Daphnia pulicariaDaphnia pulexDaphnia longiremisDaphnia longispinaDaphnia magnaDiaphanosoma birgiCopepoda TotalCladocera 1.65.53.20.846.818.365.1MIDDLESurface 23.33.219.12.45.50.80573531.91104.9
11Table 5 : Estimated number of zooplankton per liter of water from Pewaukee Lake in August, 2000.Copepoda CyclopoidaCopepoda CalanoidNaulpiiAllona costaChydorus sphaericusEubosmina coregoniBosmina longirostrisCeriodaphnia sp.Daphnia pulicariaDaphnia pulexDaphnia longiremisDaphnia longispinaDaphnia magnaDiaphanosoma birgiCopepoda TotalCladocera MIDDLESurface 37.402.41.66.4128.40000.8048.4224.5188824.4Table 6 : Estimated number of zooplankton per liter of water from the middle of Pewaukee Lake in July and August, 2000.Copepoda CyclopoidaCopepoda CalanoidNaulpiiAllona costaChydorus sphaericusEubosmina coregoniBosmina longirostrisCeriodaphnia sp.Daphnia pulicariaDaphnia pulexDaphnia longiremisDaphnia longispinaDaphnia magnaDiaphanosoma birgiCopepoda TotalCladocera 00000.80.8
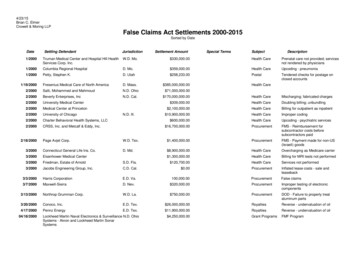
urfaceMid-depthFigure 6: Estimated number of zooplankton per liter of water in thewest end of Pewaukee Lake in July and August of terZooplankton/liter8Sample Depth (m)Figure 7: Estimated number of zooplankton per liter ofwater in the middle of Pewaukee Lake in July and Augustof urfaceMid-depthBottomFigure 8: Estimated number of zooplankton per liter of waterin the east end of Pewaukee Lake in July and August of 2000.WestMiddleEastFigure 9: Average number of zooplankton per liter of water inthe west, middle, and east sections of Pewaukee Lake in Julyand August of 2000.Nitrate, ammonia, reactive phosphorous, and chloride levels in water samplestaken at each zooplankton site were assessed. Chemical analysis of nitrates ranged from0 to 3.4 mg/liter of water with the higher levels below the thermocline in the middle ofthe lake. No apparent pattern was found in the water column in the east and west ends ofthe lake. Ammonia ranged from 0 to 0.5 mg/liter of water, and is similar to nitrate in that
13the significantly higher concentrations were also measured below the thermocline. Theconcentrations of reactive phosphorous ranged from 0 to1.2 mg/liter of water with againthe higher levels beneath the thermocline. Also, the east end had lower concentrations ofphosphorus than the rest of the lake. The amount of chloride ranged from 90 to 145 mg/liter of water. This chemical had the highest concentrations throughout the lake and wasevenly distributed in the water column (Figure 4mSumSurfaceNDMid-depth 0ce160140120100806040200rfaReactive id-depth21.5m12.5151.52nd WeekJuly,20004th Week July,20002nd Week Aug,20003m2E23.5.52.5Nitrate SurfaceM23.532.521.510.5038mW23.5Figure 10: Levels of nitrite, ammonia, reactive phosphorous, and chloride (mg/L) at sample sites W2, M2, and E2 in Pewaukee Lake during thesecond and fourth weeks of July and the second week in August of 2000.
14The physical parameters of Pewaukee Lake changed throughout the summer.Dissolved oxygen concentrations decreased as temperature increased and water claritydecreased from June to August. The levels of dissolved oxygen were rarely low enoughto impact the organisms except below the thermocline. In the west end of the lake, watertemperatures ranged from 17 C in June to 24 C in August and dissolved oxygen rangedfrom 16 mg/liter at the surface in June to 0 mg/liter near the substrate in July (Figure 11).In the middle section of the lake, temperatures ranged from 14 C in June and 24 C inAugust and concentrations of dissolved oxygen went from 10 mg/liter at the surface inJune to 0 mg/liter below the thermocline during June through August (Figure 12). In theeast end, the temperatures ranged from 21 C in June to 25.5 C in August and dissolvedoxygen ranged from 10 mg/liter near the surface in June to 3 mg/liter near the substrate inAugust (Figure 13). The water clarity generally decreased from June to August with thebetter clarity in the west and middle sections than in the east end of the lake (Figure 14).
15July2m 3m 4m 4.8mSample Depth17.2179.416.89.216.6916.40m1m2m3mSample Depth22.85222.8122.75022.70m 0.5m 1m 1.5m 2m 2.5m 3m 3.5mSample DepthSample 3.823.623.423.22322.822.622.422.222765432100m0.5m 1m1.5m 2m2.5m 3m3.5m 4m4.5m 5mTemperature (C)17.49.623Temperature (C)17.6Temperature (C)Dissolved 3.0563.1724.223.175m9.524.483m17.19.624.60.5m 1m 1.5m 2m 2.25mSample rature (C)9.8222.40Temperature (C)17.30.5m1m1.5mSample Depth32m17.4Temperature (C)Dissolved Oxygen (mg/L)109.910.2W30m3m17.50m24Dissolved Oxygen (mg/L)1.5mSample 4.122.555m1624.2222.661m10Dissolved Oxygen(mg/L)1724.3322.770m10.54Dissolved Oxygen(mg/L)1824.45Dissolved Oxygen(mg/L)11Dissolved Oxygen (mg/L)1924.56Dissolved Oxygen (mg/L)Dissolved Oxygen (mg/L)11.57Temperature (C)20August824.6Temperature (C)2112Temperature (C)W18220.June12.5Sample DepthSample DepthFigure 11: Dissolved oxygen (mg/L) and temperature (C) readings taken in Pewaukee Lake in June, July, and August of 2000 at samplestations W1, W2, and W3 with the Data Sonde 4 Hydrolab.JulyAugust6.7523.2200.511.522.533.544.4. 4Sample Depth (m)5.424.87.524.77.47.324.67.224.57.1724.40 0.5 1 1.5 2 2.5 3 3.5 4 4.4Sample Depth (m)13Sample Depth 22.6022.40 0.5 1 1.5 2 2.5 3 3.5 4 4.5 5Sample Depth (m)Figure 12: Dissolved oxygen (mg/L) and temperature (C) readings taken in Pewaukee Lake in June, July, and August of 2000 atsample stations M1, M2, and M3 with the Data Sonde 4 Hydrolab.Temperature (C)8.624.97.7102Dissolved Oxygen(mg/L)21.4Dissolved Oxygen(mg/L)8.815325Temperature (C)Dissolved Oxygen(mg/L)7.9Temperature (C)M321.6205Sample Depth (m)9256013.51259107.5Sample Depth603071010Dissolved olved Oxygen(mg/L)8Sample Depth (m)8Temperature (C)2023.2623.2430Temperature (C)Dissolved Oxygen (mg/L)10109876543210Temperature (C)M22523.286.65Sample Depth 934.5923.386.9559.123.471.9.27.05Temperature 824.969.3Temperature (C)M1Dissolved Oxygen(mg/L)9.4Dissolved Oxygen(mg/L)June
16July421220.520012Sample Depth 5208.6158.55108.558.4500.51Sample Depth (m)22.52221.50.5 1 1.5 2 2.5 2.75Sample Depth olved OxygenTemperature102.258.711.5Sample Depth (m)241223.58.7524.5025.50.511.52Sample Depth (m)250.511.52Sample Depth ure (C)20.652.25Temperature (C)Dissolved Oxygen(mg/L)20.756.70.511.52Sample Depth (m)2606.726.6623.23Temperature (C)E323.46.5Dissolved Oxygen(mg/L)8.26.68725.5Temperature (C)8.423.6Temperature (C)21.812Sample Depth (m)7.5109876543210228.623.80Temperature (C)Dissolved Oxygen(mg/L)92482.48.808.526Dissolved Oxygen(mg/L)21.524.2Dissolved Oxygen(mg/L)22Dissolved Oxygen(mg/L)6Dissolved Oxygen(mg/L)Dissolved Oxygen(mg/L)22.5July10987654321024.4Temperature (C)824.69Temperature (C)230E29.523.5Temperature (C)E12410Dissolved Oxygen(mg/L)June12August01.500.51Sample Depth (m)1.53.53.53332.52.52.521.51Depth (m)3.5Depth (m)Depth (m)Figure 13: Dissolved oxygen (mg/L) and temperature (C) readings taken in Pewaukee Lake in June, July, and August of 2000 atsample stations E1, E2, and E3 with the Data Sonde 4 0M1M2M3E1Figure 14: Average Secchi disk readings taken at each sample station in Pewaukee Lake during the summer of 2000.E2E3
17DiscussionThe goal of this study was to evaluate the present state of Pewaukee Lake andidentify its trophic status based on benthic macroinvertebrate and zooplanktonpopulations as well as the chemical and physical parameters of the lake. The trophicstatus of a lake is a function of its productivity and how it relates to and affects waterclarity, dissolved oxygen, and flora/fauna populations (Harman et al. 1997). It isimportant to remember that the trophic status of a lake is not the same as the waterquality of the lake (Carlson 1977). The quality of Pewaukee Lake’s water may affect itstrophic status and increase its rate of trophication; however, a high trophic status (i.e.eutrophic) does not necessarily indicate poor water quality.The productivity of a lake depends on the nutrient levels of the lake. Nutrients arethe substances needed by algae and aquatic plants for normal growth. The three mainnutrients are carbon, phosphorous, and nitrogen. Carbon is generally not a concern forlakes; it is plentiful and non-polluting. Phosphorous is found only in small amounts innature, so it is usually the limiting factor of plant and algae growth. Nitrogen is foundnaturally in organic matter. Growth of plants and algae is important because they are theprimary producers of a lake system. If phosphorous and nitrogen are found in highquantities and the plant and algal growth is not limited, the lake is highly productive(Kevern et al. 1996).As a lake acquires more nutrients, its trophic status increases because itsproductivity increases. A eutrophic lake is nutrient rich and is characterized by manybiotic and abiotic factors. A eutrophic lake typically has a large phytoplanktonpopulation, which leads to poor water clarity. It also has high populations of zooplankton
18and planktivores. A eutrophic lake has deep muck, anoxic conditions in the deep water,shallow weed beds, and often has good fishing. Eutrophication is a natural process thatnormally takes thousands of years to complete. However, urbanization can hasten theeutrophication process so that it could take place in one to two human generations(Kevern et al. 1996). It has been determined that algal and invertebrate communities aresubject to significant impacts of human land use practices (Hall et al. 1999). It is ourconcern that this is happening to Pewaukee Lake.According to the EPA (1999), the benthic macroinvertebrate assemblage typicallycorresponds to and can be classified by the three basic habitats along the bottom of thelake: littoral, sublittoral, and profundal. The littoral habitat (sample sites W1, W3, E1,E2, and E3) should have a large, diverse population that is highly variable. Thesublittoral zone (sites W2, M1, and M3) should have a less diverse population but it isalso more stable. The profundal habitat (site M2) should have a population that is mostlycomposed of chironomids, oligocheates, and chaoborus. Our benthic macroinvertebratesamples from these three habitats in Pewaukee Lake were all similar to the typicalprofundal zone macroinvertebrate community. Variation from the typicalmacroinvertebrate assemblage in lakes is often viewed as a response to stress resultingfrom pollution in the watershed. The EPA (1999) has compiled a set of metrics toevaluate this stress (Table 7). Applying the EPA metrics to the benthic macroinvertebrateTable 7: EPA benthic macroinvertebrate metrics (1999)MetricNo. of taxaShanon-Weiner Index%contribution of dominant taxon% oligeocheate% non-insectResponse to StressReducedReducedElevatedElevated under organic enrichmentReduced
19collections in Pewaukee Lake reveal that three of the five metrics indicate the lake isstressed. It is also noted that the number of benthic macroinvertebrate taxa has decreasedover the past three decades based on comparison of results in this study to those obtainedby Aqua Tech in 1972. The percent contribution of the dominant taxa has dramaticallyincreased since 1972 and the Shannon Weiner Index of Diversity has decreased. (Table8). The stress producing these changes is most likely related to input of excess nutrientsand pollutants from the surrounding watershed as this area continues to develop.Table 8: Pewaukee Lake macroinvertebrate metricsMetricNo. of taxaShanon-Weiner Index%contribution of dominant taxon% oligeocheate% 77**40.60584%0%0%200030.38290%0%0%*Data Source: Aqua Tech, Inc., 1972**Data Source: SEWRPC, 1984An interesting observation is that none of the sample sites contained live sails.Snails at one time must have been very abundant since Pewaukee Lake used to be calledSnail Lake. We also noted that at some of our sample sites, the substrate was composedof almost all snail shells. Snails are intolerant to low–oxygen levels (Feltmate andWilliams 1992). The decrease in dissolved oxygen levels along with copper sulfate andarsenic treatments many years ago appear to have nearly eliminated the snail population.This is yet another piece of evidence of Pewaukee Lake’s decline.However, according to the benthic macroinvertebrate population Pewaukee Lakeis not as eutrophic as it could be. Wiederholm (1980) found that as a lake becomesincreasingly eutrophic the chironomid portion of the benthic community decreases while
20the oligocheat component increases. This occurs because oligocheats are more tolerantof low oxygen conditions. This shift toward oligocheats has not occured in PewaukeeLake, there were many more chironomids found than oligiocheates.The results of the zooplantkon population analysis of Pewaukee Lake are not asclear in evaluating the condition of Pewaukee Lake. Gulati (1982) stated that as a lakebecomes more eutrophic, calanoid copepods become less significant and cyclopoidcopepods and cladocerans dominate. Cyclopoids and cladocerans have dominatedPewaukee Lake since 1971 however the ratio between the two classes improved from1971 to 1976 and has remained the same since 1976 (Figure 15). This stable relationship0%19%17%81%100%*May, 1971**July, 1976**August, 197719%15%85%July, 200081%August, 2000Figure 15: Percentage of total populations of Cladocerans and Cyclopoid Copepods compared topercentage of total population of Calanoid Copepods in 1971, 1976,1977, and 2000.*Data Source: Aqua Tech, Inc., 1972**Data Source: SEWRPC, 1984Cladoceransand CyclopoidCopepodsCalanoidCopepods83%
21given Gulati’s hypothesis could indicate a leveling of the eutrophication process inPewaukee Lake as a response to lake management practices such as aquatic plantharvesting. Gulati (1982) also stated that the dominance of small claderans, especiallyChydorus , Diaphanosoma, and Ceriodaphnia, indicates the availability of nanosestonwhich is often found in eutrophic lakes rich in bacterial flora, fine detritus, and ultrananoplankton. The ratio of the small cladocera to the total pop
Pewaukee Lake Biological Evaluation 2000 Wisconsin Lutheran College, Biology Dept. Technical Bulletin 002, May 2001 Prepared by Angela L. Schmoldt Robert C. Anderson, PhD Project sponsored by Miller Friends of the Field and The Foundation for Wildlife Conservation, Inc. 2