Transcription
Characterization of the 1B-Type ω-Gliadinsfrom Triticum aestivum Cultivar ButteFrances M. DuPont,1,2 William H. Vensel,2 Ronald Chan,2 and Donald D. Kasarda2ABSTRACTCereal Chem. 77(5):607–614ω-Gliadins were purified from wheat (Triticum aestivum L. ‘Butte’)flour and characterized. Although reversed-phase HPLC (RP-HPLC) separated the 1B-encoded ω-gliadins into two fractions, 1B1 and 1B2, thesefractions had nearly identical amino acid compositions, three similar protein bands in SDS-PAGE, 10 similar spots in two-dimensional PAGE, andtwo similar N-terminal amino acid sequences. The main components had arange in mass of 48,900–51,500 when estimated by mass spectrometry,significantly less than the mass estimated by SDS-PAGE. The 1B fractions were digested with thermolysin, the peptides were separated by RPHPLC, the peptide mass was determined, and nine peptides from eachfraction were sequenced with nearly identical results for the 1B1 and 1B2digests. A possible consensus sequence of the 1B-encoded ω-gliadin internalrepeat was QQQXP, where X was F, I, or L in descending order ofoccurrence. The 1D-encoded ω-gliadins were purified by RP-HPLC as asingle fraction that had one band in SDS-PAGE, two spots in two-dimensional PAGE, two components with mass of 41,923 and 42,770 detectedby mass spectrometry, and two N-terminal sequences. Circular dichroism(CD) spectra for the 1B and 1D ω-gliadins were similar and were suggestive of mainly flexible random structure with a significant amount ofthe left-handed polyproline II helical conformation in the 1D components.The ω-gliadin components of wheat flour are sulfur-poor prolamins with no cysteine. Closely related components that containcysteine are referred to as D-glutenin subunits (Masci et al 1998).The ω-gliadins are composed almost entirely of high-glutamine,high-proline repeats and are related to the rye ω-secalins and thebarley C-hordeins (Tatham and Shewry 1995). Several distinct ωgliadins were identified in wheat based on electrophoretic patternsand N-terminal sequences, and their genes were localized to theGli-B1 and Gli-D1 loci on the short arms of chromosome 1B and1D, respectively (Kasarda et al 1983, Lafiandra et al 1984, Tathamand Shewry 1995, Zhao et al 1999). Additional ω-gliadin-like proteins, with genes located at the Gli-A1 locus on the short arm ofchromosome 1A are less well characterized. Wheat was estimatedto have at least 15–18 copies of ω-gliadin genes (Sabelli andShewry 1991). In this article, we refer to the Gli-A1, Gli-B1, andGli-D1 encoded ω-gliadins as the 1A, 1B, and 1D ω-gliadins.Sulfur availability and the ratio of sulfur to nitrogen in the soilaffect dough elasticity and resistance and loaf volume, probablybecause of the effect of sulfur-to-nitrogen ratios on the gluten protein composition of wheat flour (Zhao et al 1999). The relativeabundance of the sulfur-poor prolamins, particularly the ω-gliadins,and the intermediate-sulfur high molecular weight glutenin subunits(HMW-GS), increased when wheat plants were depleted of sulfur(Wrigley et al 1984, Zhao et al 1999) but the significance of changesin ω-gliadin amounts to dough quality is unknown. Because the ωgliadins have no cysteines, they do not form intra- or intermoleculardisulfide bonds and do not participate covalently in the formationof gluten polymers. The role of ω-gliadins in dough formation andtheir significance to flour quality is not well defined (Tatham andShewry 1995).To understand the contributions of gluten proteins to the viscoelastic properties of wheat flour dough, it is essential to developphysical models of the individual components. Obtaining gene andprotein sequence information is the first step in developing thesemodels. Although the primary structure of many gliadins and glu-tenins has been determined by extensive protein and gene-sequencing efforts, no sequences of cDNA or genomic clones have beenreported for ω-gliadins from wheat. In this study, we purified 1Bω-gliadins from a wheat flour extract and characterized them byN-terminal amino acid sequencing, matrix assisted laser desorptionionization – time of flight (MALDI-TOF) mass spectrometry, andcircular dichroism spectroscopy (CD). The 1B proteins were digestedusing thermolysin, and the resulting peptides were characterized byMALDI-TOF and N-terminal sequence. We also compared the 1Bω-gliadins with the 1D ω-gliadins from the same flour extract byamino acid composition analysis, N-terminal sequencing, massspectrometry, and CD.1 Correspondingauthor. Phone: 510-559-5702. Fax: 510-559-5818. E-mail:fmd@pw.usda.gov2 USDA Agricultural Research Service, Western Regional Research Center, 800Buchanan St., Albany, CA 94710. Names are necessary to report factually onavailable data; however, the USDA neither guarantees nor warrants the standardof the product, and the use of the name by the USDA implies no approval of theproduct to the exclusion of others that may also be suitable.Publication no. C-2000-0814-04R.This article is in the public domain and not copyrightable. It may be freely reprinted with customary crediting of the source. American Association of CerealChemists, Inc., 2000MATERIALS AND METHODSMaterialsWheat plants (Triticum aestivum L. ‘Butte’) were grown in thegreenhouse as previously described (Hurkman et al 1998). The plantswere moved to a growth chamber after anthesis and exposed to ahigh temperature regime including 5 hr at 40 C daily for 15 days.Grain was harvested at maturity and ground to flour using a Quadramatic Jr. mill (C. W. Brabender, South Hakensack, NJ). Proteinwas determined using a nitrogen analyzer (Leco Corporation, St.Joseph, MI) and a protein-to-N ratio of 5.7. The grain from theheat-treated plants was 20% protein. Flour at 16% protein fromgreenhouse-grown plants was used for some experiments.Protein Extractionn-Propanol (10 mL, 50%, v/v) was added to 1.5 g of flour in a15-mL Falcon polypropylene centrifuge tube with a screw top (BectonDickinson, Franklin Lakes, NJ), which was rotated for 20 min at22 C using a hybridization oven (Robbins Scientific, Sunnyvale,CA), then centrifuged in an Eppendorf 5810R desk-top centrifuge(Brinkman Instruments, New York, NY) at 4,500 g for 20 min.The supernatant was saved, the extraction was repeated twice, andthe three supernatants were pooled and dried in a freeze-dry system (FreeZone, Labconco, Kansas City, MO) with a –80 C collectorcoil. Dried samples were stored at –20 C. Protein was determinedby N analysis. As reported previously (Fu and Sapirstein 1996),50% propanol extracted all of the gliadins along with a small amountof HMW-GS and LMW-GS. For large-scale preparation of ωgliadins with reduced contamination by HMW-GS, 30 g of flourwas extracted by stirring at room temperature with 300 mL of 40%ethanol, followed by centrifugation at 5,800 g in a Sorval GSA rotor(Kendro Laboratory Products, Newtown, CT). The supernatantwas centrifuged a second time, decanted, mixed with two volumesVol. 77, No. 5, 2000607
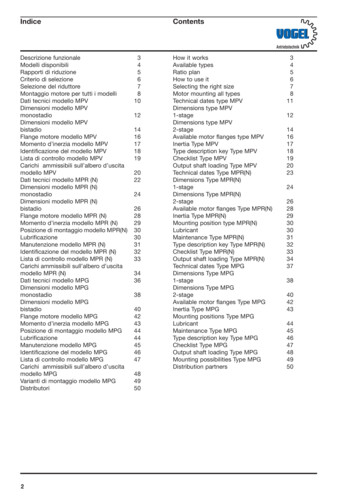
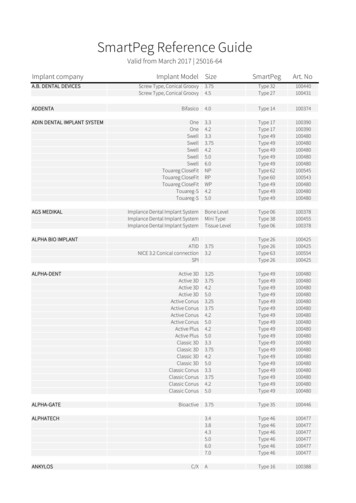
of 1.5M NaCl, placed at 4 C overnight, and then centrifuged at1,500 g to pellet the gliadins. The gliadin-enriched pellet wasrinsed with H2O, dissolved in 50 mL of 0.1M acetic acid, andfreeze-dried. The proteins (100 mg) were resuspended in 6 mL of0.1M acetic acid and separated on a BioGel P-100 (BioRad,Hercules, CA) column with 0.05M acetic acid as eluant. Fractionsenriched in ω-gliadins were freeze-dried. The large preparationswere used mainly for CD.RP-HPLCFreeze-dried proteins were dissolved at a concentration of 1 mgof protein/mL in 6M guanidine HCL adjusted to pH 8.0 with Tris,plus 50 mM DTT, and 500 µL was applied to a Vydac (Hesperia,CA) 218TP C18 semipreparative RP-HPLC column (3-nm porediameter, 10-mm i.d., 250-mm length). HPLC (HP Series 1100) wasused to elute the proteins using a gradient of 10–90% (v/v) acetonitrile in 0.05% trifluroracetic acid (TFA) at 1.5 mL/min at 50 C.SDS-PAGEFreeze-dried 50% propanol extract from the equivalent of 50 µgof flour was suspended in 50 µL of sample buffer (Novex NuPage,Invitrogen, Carlsbad, CA) with Novex NuPAGE antioxidant byvortexing for 1 hr at 22 C in a microtube mixer (MT-360, TomySeiko, Tokyo, Japan), then centrifuged for 10 min at 14,000 rpm ina microfuge. The supernatant solution was transferred to a clean tubeand 5 µL was loaded onto a Novex NuPAGE 4–12% acrylamide, bisTris gel and separated using the Novex MES SDS running buffer.HPLC fractions were freeze-dried, resuspended in 20 µL of samplebuffer, and 5 µL was loaded onto the gel. The Mark12 protein standard (Invitrogen) was used. Gels were stained overnight using BrilliantBlue G (Sigma, St. Louis, MO) in 20% methanol and destainedwith water (Kasarda et al 1998).Two-Dimensional PAGESamples from HPLC-purified fractions were separated by twodimensional PAGE (Hurkman and Tanaka 1986) with the followingmodifications: a 3–10% ampholyte mixture was used, the isoelectric focusing gel was run for only 1 hr, giving nonequilibriumconditions, and the second dimension gel was a Novex 4-12%acrylamide, bis-Tris gel.Thermolysin DigestionFreeze-dried protein (83 µg) was suspended in 1.0 mL of 50 mMTris, pH 6.8, 4M urea, 2 mM CaCl2 by stirring for 3 hr using asmall stir bar in a microfuge tube, then 1.7 µg of thermolysin (cat.161586, Boehringer Mannheim, Indianapolis, IN) was added andthe protein was digested overnight with constant stirring at roomtemperature ( 22 C). The digest was acidified by adding 20 µL ofglacial acetic acid, filtered, and injected onto the HPLC. Peptideswere eluted as described above.MALDI-TOF Mass SpectrometryProtein samples, purified by RP-HPLC and dried in a centrifugal evaporator (Savant Speed-Vac, GMI, St. Paul, MN), weredissolved in 50 µL of 30% (v/v) acetonitrile containing 0.1% TFA,and mixed with an equal volume of saturated matrix (3,5-dimethoxy4-hydroxycinnamic acid) dissolved in 30% acetonitrile, 0.1% TFA.Samples ( 0.5 µL) were spotted onto an MALDI target, allowedto dry at room temperature, and analyzed. HPLC-purified peptidesfrom the thermolysin digestion were spotted onto dried matrix ratherthan being mixed with it. For the peptides, the matrix was a mixtureof 20 g/L α-cyano-4-hydroxy-trans-cinnamic acid (Aldrich, Milwaukee, WI) and 5 g/L nitrocellulose dissolved in acetone-propanol(1:1) (Schevchenko et al 1996). The target surface for the peptideswas prepared using 0.5 µL of matrix solution deposited on theMALDI target to produce a thin film of matrix after rapid evaporation of the solvent. Small portions of the sample (typically 0.5µL) were then deposited onto the dried matrix and allowed to dry.The dried spots were washed by applying 10 µL of 0.1% TFA.After 10 sec, the TFA solution was removed by vacuum aspiration. Spectra were taken in the positive ion mode using a MALDImass spectrometer (Reflex II, Bruker Daltonics, Billerica, MA).The instrument was operated in the linear mode for proteins, butthe delayed extraction and reflectron mode was used for peptides.External calibration for proteins was performed using both the doubleand single-charged ion of bovine serum albumin. For peptides, thematrix ion (α-cyano-4-hydroxy-trans-cinnamic acid), adrenocorticotropic hormone (clip 18–31) and insulin were used as calibrants.Amino Acid CompositionAmino acid composition was determined by the University ofCalifornia-Davis Protein Structure Laboratory using ion-exchangechromatography followed by a postcolumn ninhydrin reaction todetect the amino acids (Ozols 1990).Fig. 1. Reverse-phase HPLC elution pattern of proteins extracted fromButte flour with 50% propanol. Proteins were reduced before being appliedto HPLC column. Position of 1B and 1D ω-gliadin peaks, other gliadins, andsmall amounts of HMW-GS and LMW-GS are indicated. * Peak containing a putative 1A-code ω-gliadin; ** peak containing another unknownthat coelutes with the HMW-GS.608CEREAL CHEMISTRYFig. 2. SDS-PAGE analysis of a 50% propanol extract of Butte flour (lane1) and three fractions obtained by reverse-phase HPLC of the propanolextract: 1B1, 1B2, and 1D ω-gliadin fractions (lanes 2–4, respectively).Positions of molecular mass markers ( 10–3) indicated on the right. Allsamples reduced with dithiothreitol.
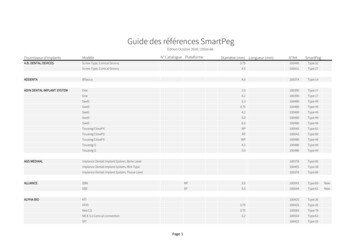
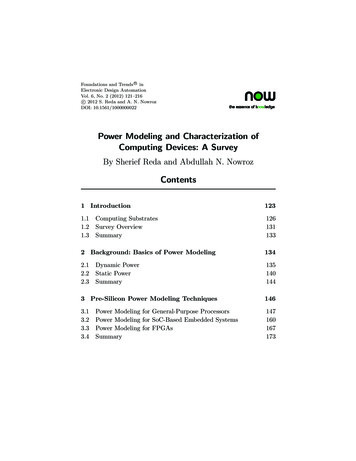
Edman SequencingProteins and peptides were sequenced using an automatic proteinsequencer (model 477A, Applied Biosystems, Foster City, CA)equipped with an online 120A HPLC system for identification ofphenylthiohydantoin (PTH)-amino acids. The sample of protein orpeptide to be sequenced was dissolved in 20 µL of 50% (v/v)acetonitrile containing 0.1% TFA, immediately applied to a preconditioned coated glass fiber filter (Biobrene, Applied Biosystems)and dried. A standard cleavage time of 5 min at 48 C was used forthe ω-gliadins. The peptides from the thermolysin digest weresequenced using a cleavage time of 10 min at 53 C (Vensel andKasarda 1991). Sequence determination was made by visual inspection of the chromatograms and by examination of the data asanalyzed by the data analysis software (vers. 1.61, Applied Biosystems).CDCD spectroscopy was conducted using a spectropolarimeter (modelJ-715, Jasco, Easton, MD). Measurements were made at 20 C in a0.01-cm pathlength cell with a scan speed of 50 nm/min and resolution of 0.1 nm. Sensitivity was 50 millidegrees. Spectra were recorded as an average of 10 scans. Bandwidth was 1.0 nm and responsewas 4 sec. The solvent was 1 mM phosphoric acid (pH 3), and asolvent blank run under the same conditions was subtracted fromthe protein scan. The HPLC-purified protein samples were repurified by HPLC, freeze-dried, redissolved in water, and again freezedried to diminish the amount of TFA in the sample. Initially, proteinconcentrations of the two fractions were determined relative toone another by weight. The dried protein samples ( 2–3 mg) wereplaced in a freeze-drying flask and equilibrated overnight ( 15 hr)on the freeze-dryer at a pressure of 12 Pa. The exact weight of theprotein sample was determined immediately after the sample wasremoved from the freeze-dryer and it was dissolved in a weighedamount of solvent at a concentration of 1 mg/mL. The samplesdissolved readily and there was no obvious turbidity. Before CDFig. 3. Two-dimensional PAGE analysis of the 1B1 (A), 1B2 (B), and 1D(C) ω-gliadin HPLC fractions.measurements were made, the sample was clarified by centrifugationat 10,000 g, which did not change the concentration significantlyas indicated by the ultraviolet (UV) absorption at 275 nm. Althoughthe solution was clear, there was slight aggregation noted as lightscattering in the 350–300 nm range of the UV spectrum for the 1Bfraction.The actual concentration of the 1D ω-gliadin sample was determined from the UV spectra of the protein solutions using the extinction coefficient of 0.332 (absorption of a 1 mg/mL solution, 1-cmpath, at 275 nm) for a similar protein, ω-gliadin 17, (Popineau etal 1986). The concentrations of the 1B ω-gliadin fractions wereadjusted on the basis of weight relative to those of the 1D fractions.Although the UV spectrum of ω-gliadin 30 (Popineau et al 1986)was similar to that of our 1B fractions (data not shown), the ratioof the absorbances at 258–275 nm for ω-gliadin 30 appeared to bedifferent from the ratio for our 1B components. [Note: the designations for the two spectra, component 30 vs. component 17, wereaccidentally reversed in Fig. 6 of the publication of Popineau et al(1986) according to a personal communication from Y. Popineau.]Spectra were analyzed for secondary structures by the method ofJohnson (1999).RESULTSPurification of ω-GliadinsThe proteins in the 50% propanol extract were reduced andseparated by RP-HPLC (Fig. 1). The protein peaks were identifiedFig. 4. Molecular mass of proteins in the ω-gliadin fractions determinedby MALDI-TOF analysis. Spectra, plotted as absolute intensity vs. massto-charge ratio (m/z) are shown for the 1B1 (A), 1B2 (B), and 1D (C) ωgliadin fractions.Vol. 77, No. 5, 2000609
based on retention times, SDS gel analysis of the apparent molecularmass of the proteins in each peak, and previous experience withseparation of wheat storage proteins (Kasarda et al 1983, 1998).The proteins in the first two peaks that eluted were classified as1B ω-gliadins (Figs. 1 and 2). They were followed by a peak of1D ω-gliadins. Two additional peaks of moderate height followedthe 1 D ω-gliadins. One contained an ω-gliadin-like protein, possibly a1A encoded ω-gliadin, and the other an unidentified protein ofsimilar mass to the ω-gliadins, which was not characterized further. Small amounts of HMW-GS eluted in the same range as thelater two peaks. For convenience, the 1B ω-gliadin peaks are referredto as 1B1 and 1B2, in order of elution. In the example shown inFig. 1, the flour was from heat-treated plants with a high percent protein. This flour sample was used because it was enriched in ω-gliadinscompared with the other proteins in the 50% propanol fraction.The proteins in the 50% propanol extract and in the HPLCfractions were analyzed by SDS-PAGE (Fig. 2). Results are shownTABLE IAmino Acid Compositions of 1B and 1D ω-Gliadin Fractionsfrom Butte D-ωonly for the extract and the first three HPLC fractions. The fiveHMW-GS were resolved at apparent molecular mass of 80,000–115,000 (lane 1), the cluster of ω-gliadins gave three bands withapparent molecular mass of 57,000–65,000 (lanes 1–4), andLMW-GS and other gliadins were resolved at apparent molecularmass of 34,000–55,000 (lane 1). The 1B1 and 1B2 peaks fromHPLC were each resolved by SDS-PAGE into three bands withapparent molecular mass of 60,000, 61,700, and 64,000 (lanes 2and 3) and the 1D peak was resolved into a single band withapparent molecular mass of 57,000 (lane 4). Two-dimensional PAGEresolved the 1B1 and 1B2 fraction into 10 proteins each, withnearly identical patterns for the two fractions (Fig. 3A–B). The 1Dfraction was resolved into two proteins (Fig. 3C). The apparentmolecular mass estimated from the gel of Fig. 3 was slightly higherthan those estimated from Fig. 2. This is not unusual when onedimensional gels are compared with two-dimensional gels, possiblybecause the initial retardation of the proteins by the first dimensiongel is greater than when solution is loaded directly as in onedimensional gels.Determination of Molecular Weight by Mass SpectrometryThe actual mass of the ω-gliadins was determined by MALDITOF analysis (Fig. 4). The 1B1 fraction was resolved into peakswith molecular mass of 48,900, 50,100, and 51,300 (Fig. 4A), the1B2 fraction was resolved into three peaks with molecular mass of49,085, 50,300, and 51,500 (Fig. 4B), and the 1D fraction wasresolved by MALDI-TOF into two peaks with molecular mass of41,923 and 42,770 (Fig. 4C). The mass of the 1B ω-gliadins was18–20% lower, and the mass of the 1D ω-gliadins was 27% lowerthan the apparent molecular mass determined by SDS-PAGE.Amino Acid CompositionThe total amino acid compositions of the three ω-gliadinfractions were determined (Table I). The amino acid compositionsof the 1B1and 1B2 ω-gliadin fractions were nearly identical. Asfor most gluten proteins, the principal amino acid components wereglutamine and proline. The 1B ω-gliadin fractions had glutamineto-proline ratios of 2.75, and the 1D ω-gliadin fraction had aglutamine-to-proline ratio of 1.48. All glutamic acid was assumedto be in the form of glutamine (Wieser et al 1982), which is approximately correct, as indicated by the amount of ammonia released.abTryp and Cys were not determined.Not included in total.TABLE IIN-Terminal Amino Acid Sequences for Proteinsin 1B and 1D ω-Gliadin Fractions from Butte FlourCompared with Published N-Terminal Amino Acid SequencesProteinDetermination of N-Terminal Amino Acid SequencesN-terminal amino acid sequences were determined for the proteins in the 1B1, 1B2, and 1D ω-gliadin fractions (Table II). Thesequence data for the 1B1 and 1B2 ω-gliadins are compared withthe N-terminal sequences of three ω-gliadins from T. longissimaand to the previously published N-terminal sequence of a 1Bencoded ω-gliadin from T. aestivum. The 1B1 and 1B2 fractionsN-Terminal Amino Acid SequenceSequence for ω-gliadins from Triticum longissima (Odintsova and Egorov 1990).ω-5 (Kasarda et al 1983).c ω-5 (Kasarda et al 1983).d ω-5 (Kasarda et al 1983).ab610CEREAL CHEMISTRYFig. 5. Reverse-phase HPLC analysis of peptides obtained by digestingproteins in 1B1 (———) and 1B2 (- - - -) ω-gliadin fractions with thermolysin.Numbers indicate fractions collected for further analysis.
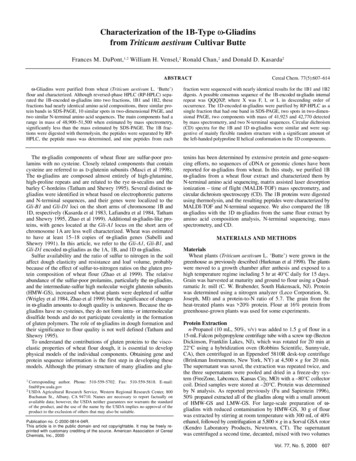
each were composed of at least three different proteins, on the basisof the N terminal amino acid sequences, differing in at least twopositions. Although leucine was the predominant amino acid atcycle 3, a definite methionine residue was also present in cycle 3at 67% of the leucine amount. The N-terminal sequence data forthe 1D ω-gliadin fraction gave two strong amino acid signals ateach amino acid position. The sequence pattern was almost identical to that from a combination of the previously published sequencesfor 1Dω-1 and 1Dω-2, in agreement with the two-dimensionalPAGE and the mass spectrometry data that indicated that the 1Dω-gliadin fraction contained at least two major peptides.Analysis of Thermolysin DigestsTo obtain internal sequence data for the 1B ω-gliadins, the 1B1and 1B2 fractions were separately digested using thermolysin,which cleaves proteins N-terminal to hydrophobic resides, such asL, I, T and F, unless a proline is on the C-terminal side of theresidue. The extent of the digestion was limited by performing thereaction at room temperature. When the peptides were separatedby RP-HPLC, the profiles for the 1B1 and 1B2 thermolysin digestswere almost identical, giving 20 peaks each (Fig. 5). RP-HPLCfractions containing the principal peptide peaks were collected,and the molecular mass of the peptides in each fraction were determined by MALDI-TOF analysis. The results for the correspondingfractions from the 1B1 and the 1B2 digests were compared. TheMALDI-TOF patterns of nine representative pairs of peptidefractions are shown in Fig. 6. Some fractions contained a singlepeptide as illustrated for fractions 1, 3, and 5, but others containedseveral peptides. The MALDI-TOF patterns for most of the 1B1and 1B2 peptide fractions were nearly identical, although somepeptides differed a small amount in mass, and a few peaks werefaint and harder to visualize in one or the other of the pairs.Seven peptides from the 1B1 and 1B2 digests were sequenced,along with an additional peptide from the 1B2 digest (Table III).The peptides that were sequenced were from RP-HPLC fractionsthat had one major component in the MALDI-TOF analysis. Thesequences for the 1B1 and 1B2 peptides were nearly identical. Thesequence of the peptide in the 1B1 fraction 1 was identical to thatof one of the 1B1 N-terminal amino acid sequences, except that itappeared to be truncated, because it was missing the first twoamino acids as a consequence of the thermolysin cleavage Nterminal to leucine. The sequence of the 1B2 fraction 1 wasidentical to the 1B2 N-terminal sequence that began with T. Thecleavage between residues 2 and 3 did not occur, presumablybecause of incomplete digestion by the thermolysin at room temperature. The other peptides that were sequenced were rich in prolineand glutamine. Some had unique patterns, but most containedrepeated patterns of two, three, or four glutamines (Q), followedpredominantly by FP, but sometimes with the F substituted by I orL. The repeated sequences are underlined in Table III.Circular DichroismBecause the amino acid composition and amino acid repeatsequences of the 1B ω-gliadins had more glutamine and lessproline than those of the 1D ω-gliadins, we compared their secondary structures using circular dichroism spectroscopy (Fig. 7).There was no significant difference between the spectra for the1B1 and 1B2 fractions (not shown). The CD spectra of the 1B and1D components were qualitatively quite similar, but the negativeband near 200 nm was more intense for the 1D fraction (Fig. 7).DISCUSSIONDespite extensive efforts to clone genes for gliadins andglutenins, some gene sequences appear to be rare or absent fromthe available cDNA and genomic libraries (Masci et al 1998,Altenbach 1998). It is possible that some highly repetitive genesequences are not replicated properly by the usual bacteria andphage combinations used to make the DNA libraries. In the caseof the 1B ω-gliadins, no cDNA or genomic clone has been reported,and the mass and peptide sequences reported in this article are theonly information available on the exact size and internal proteinsequence. Also, most physical studies of the ω-gliadins and Chordeins were conducted using protein preparations that wereprobably similar to our 1D ω-gliadin fraction. (Tatham and Shewry1985, Field et al 1986, Tatham et al 1989, I’Anson et al 1992,TABLE IIIN-Terminal Amino Acid Sequences for Selected Peptides from Thermolysin Digests of 1B ω-Gliadins FractionsFractionaabCycle NumberFraction numbers as in Fig. 5.Repeat regions with sequences consisting of QQ, QQQ, or QQQQ followed by FP, IP, or LP are underlined.Vol. 77, No. 5, 2000611
Thomson et al 1999). The electrophoretic patterns in Tatham andShewry (1985) indicate that their ω-gliadin fraction 1 was likely tobe similar to our 1D fraction, possibly also including 1A ω-gliadins,and their fraction 2 was probably similar to our 1B fraction, thoughthe results for fraction 2 were not shown. Because 1D ω-gliadinsand C-hordeins are similar to one another in sequence and composition, physical studies of one are likely to apply to the other.However, we are not aware of any physical studies that have clearlyfocused on proteins similar to our 1B ω-gliadins.We found that the molecular weights of the 1B and 1D ωgliadins were greatly overestimated by SDS-PAGE. This is oftentrue for gluten subunits, probably because the gluten peptide-SDScomplexes are more elongated than those of the protein molecularweight standards (Hamauzu et al 1974). It is also possible thatthey do not bind SDS as well as most other proteins because ofthe hydrophilic nature of these proteins and a scarcity of chargedside chains. Published estimates of the molecular weight of ωgliadins obtained by SDS-PAGE, gel filtration, and sedimentationequilibrium ultracentrifugation (Popineau et al 1986, Tatham andShewry 1995) vary widely. They are generally much higher thanthe molecular mass obtained by mass spectrometry in this study,except for one estimate, which is much lower (Hamauzu et al 1974).The surface hydrophobicity of the ω-gliadins must be lower thanfor other gluten subunits because they were the first peptides toelute from the RP-HPLC column and they are the most hydrophilicof the gluten proteins in terms of total amino acid composition.The Butte 1B ω-gliadin fractions were complex. They wereseparated into two peaks by RP-HPLC, which were each separatedinto three polypeptides by SDS-PAGE and mass spectrometry, andinto 10 polypeptides by two-dimensional PAGE. N-terminal sequencedata indicated that there were at least six different proteins. Theprimary structures of the 1B ω-gliadins must be very similar, however, because RP-HPLC of the thermolysin digests of both HPLCfractions gave almost identical elution profiles, peptide mass determined by MALDI-TOF was nearly identical, and the N-terminalsequences were essentially the same. The 1B ω-gliadin N-terminalsequences were similar to those of the ω-gliadins of T. longissima(Odintsova and Egorov 1990), which is related to T. speltoides, theancestor of the B genome. It is likely that all of the 1B ω-gliadinsoriginated by gene duplication from a single gene and that subsequent changes in protein sequence have been relatively minor.There was only one 1D ω-gliadin HPLC peak, and only one bandwas observed in SDS-PAGE. However, two peaks were observedby mass spectrometry and there were at least two different proteins,with N-terminal sequences beginning with ARE and KEL. Previously, these were separated by ion-exchange chromatography, char-Fig. 6. Molecular mass of peptides obtained by MALDI-TOF for nine of 20 fractions collected by reverse-phase HPLC after digesting 1B1 and 1B2 ωgliadin fractions with thermolysin. x-Axis scale for mass-to-charge ratio (m/z) of the peptides begins at 1,000; lower values were mostly noise. Numbersabove the principal peak or peaks in the spectra refer to RP-HPLC fraction numbers in Fig. 4; B1 or B2 indicate fractions from 1B1 or 1B2 digests.612CEREAL CHEMISTRY
acterized, and termed the ARE- and the KEL-type ω-gliadins (Kasardaet al 1983, Masci et al 1991). The ARE-type ω-gliadin is mostsimilar to the barley C-hordeins and the rye ω-secalins. The KELtype ω-gliadin is similar to the ARE-type except for the loss of thefirst eight residues and probably arose from a gene duplication.The amino acid compositions of the 1B and 1D ω-gliadin fractions from Butte were in good agreement with previously publishedresults (Charbonnier 1974, Kasarda et al 1983). The 1B ω-gliadinswith a glutamine-to-proline ratio of 2.8:1 have a greater proportion of glutamine than the 1D ω-gliadins or any other knowngluten proteins (Kasarda et al 1983, Tatham and Shewry 1995).The glutamine-to-proline ratio for the 1D ω-gliadins, in contrast,is 1.5:1. For both the 1B- and 1D-types, the combined glutamineand proline contents amounted to 74 mol% of the total. When thethird most predominant amino acid, phenylalanine, was included,these three amino acids made up 83% of the total. The 1B1 and1B2 internal peptides characterized in this study had glutaminerich repeats of QQXP, QQQXP, or QQQQXP, where X is F, I, orL in order of predominance. This repeat sequence is distinct fromthe PQQPFPQQ repeating sequence found both in hordeins (Tathamet al 1989) and in the gene sequence for a 1D-type ω-gliadin (O.D. Anderson, personal communication). When the genes for
Invitrogen, Carlsbad, CA) with Novex NuPAGE antioxidant by vortexing for 1 hr at 22 C in a microtube mixer (MT-360, Tomy Seiko, Tokyo, Japan), then centrifuged for 10 min at 14,000 rpm in a microfuge. The supernatant solution was transferred to a clean tube and 5 µL was loaded onto a Novex NuPAGE 4-12% acrylamide, bis-