Transcription
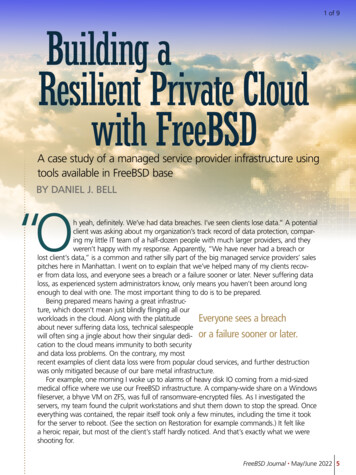
OPERATING SYSTEMSTeaching Operating Systems with FreeBSDthrough Tracing, Analysis, and ExperimentationG E O R G E V. N E V I L L E - N E I L A N D R O B E R T N . M . WAT S O NGeorge V. Neville-Neil workson networking and operatingsystem code for fun and profit.He also teaches courses onvarious subjects related toprogramming. His areas of interest are codespelunking, operating systems, networking,and time protocols. He is the coauthor withMarshall Kirk McKusick and Robert N. M.Watson of The Design and Implementation of theFreeBSD Operating System. For over 10 years hehas been the columnist better known as KodeVicious. He earned his bachelor’s degree incomputer science at Northeastern Universityin Boston, Massachusetts, and is a member ofACM, the USENIX Association, and IEEE. He isan avid bicyclist and traveler and currently livesin New York City. gnn@neville-neil.comDr. Robert N. M. Watson isa University Senior Lecturer(Associate Professor) insystems, security, andarchitecture at the Universityof Cambridge Computer Laboratory; FreeBSDdeveloper and past core team member;and member of the FreeBSD FoundationBoard of Directors. He leads a number ofcross-layer research projects spanningcomputer architecture, compilers, programanalysis, program transformation, operatingsystems, networking, and security. Recentwork includes the Capsicum security model,MAC Framework used for sandboxing insystems such as Junos and Apple iOS, CHERI(CPU with protected memory segments),and multithreading in the FreeBSD networkstack. He is a coauthor of The Design andImplementation of the FreeBSD Operating System(2nd edition). watson@freebsd.orgA version of this article originally appeared inthe FreeBSD Journal, April/May 2016 issue.8SPRING 2017Many people who study computer science at universities encountertheir first truly large system when studying operating systems.Until their first OS course, their projects are small, self-contained,and often written by only one person or a team of three or four. In this article,we suggest an approach to studying operating systems we have been using withgraduate students and practitioners that involves using a small ARMv7 boardand tracing. All of our materials are available online, with a BSD-like license.Since the first courses on operating systems were begun back in the 1970s, there have beenthree ways in which such classes have been taught. At the undergraduate level, there is the“trial by fire,” in which students extend or recreate classical elements and forms of OS design,including kernels, processes, and file systems. In trial-by-fire courses the students are givena very large system to work with, and they are expected to make small, but measurable,changes to it. Handing someone a couple million lines of C and expecting them to get something out of changing a hundred lines of it seems counterintuitive at the least.The second undergraduate style is the “toy system.” With a toy system the millions of linesare reduced to some tens of thousands, which makes understanding the system as a wholeeasier but severely constrains the types of problems that can be presented, and the lack offidelity, as compared to a real, fielded operating system, often means that students do notlearn a great deal about operating systems, or large systems in general. For graduate students,studying operating systems is done through a research readings course, where students read,present, discuss, and write about classic research where they are evaluated on a term projectand one or more exams.For practitioners, those who have already left the university, or those who entered computerscience from other fields, there have been even fewer options. One of the few examples of acourse aimed at practicing software engineers is the series “FreeBSD Kernel Internals” byMarshall Kirk McKusick, with whom both authors of this article worked on the most recentedition of The Design and Implementation of the FreeBSD Operating System. In the “FreeBSDKernel Internals” courses, students are walked through the internals of the FreeBSD operating system with a generous amount of code reading and review, but without modifying thesystem as part of the course.For university courses at both the undergraduate and graduate level, we felt there had to be amiddle way where we could use a real-world artifact such as FreeBSD, which is deployed inproducts around the world, while making sure the students didn’t get lost in the millions oflines of code at their disposal.Deep-Dive ExperimentationStarting in 2014, the authors undertook to build a pair of tightly coupled courses sharingpedagogy and teaching material. One version is designed for graduate students and taughtby Robert N. M. Watson at the University of Cambridge. The other version is a practitionercourse taught at conferences in industrial settings by George Neville-Neil.VO L . 42 , N O . 1www.usenix.org
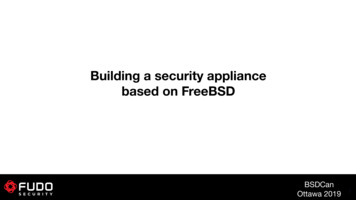
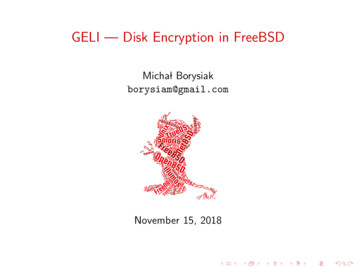
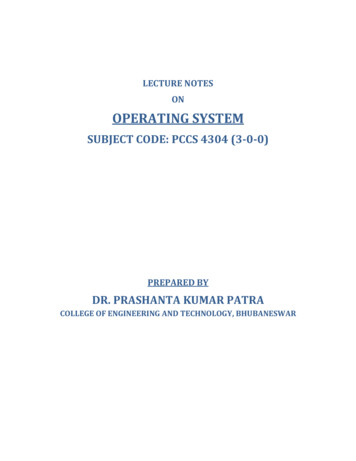
OPERATING SYSTEMSTeaching Operating Systems with FreeBSD through Tracing, Analysis, and Experimentationdtrace -n 'fbt::malloc:entry { trace(execname); trace(arg0); }'Kernel imagemalloc()DTrace - probe contextFunctionBoundaryTracingproviderdtrace roviderBuffersPer-script,per-CPUbuffer pairsDTrace outputDTrace doutbufferdtrace hCPU IDFUNCTION:NAME1 54297 temp:malloccsh1 54297 (copyout())dtrace -n 'dtmalloc::temp:malloc /execname “csh”/ { trace(execname); trace(arg3); }'Figure 1: DTrace is a critical part of the course’s teaching approach—students trace kernels and applications to understand their performance behavior.They also need to understand—at a high level—how DTrace works in order to reason about the “probe effect” on their measurements.In the deep-dive course, students learn about and analyze specific CPU/OS/protocol behaviors using tracing via DTrace(Figure 1) and the CPU performance counters. Using tracing toteach mitigates the risk of OS kernel hacking in a short course,while allowing the students to work on real-world systems ratherthan toys. For graduate students, we target research skills andnot just OS design. The deep-dive course is only possible due todevelopment of integrated tracing and profiling tools, including DTrace and Hardware Performance Monitoring Counter(hwpmc) support present in FreeBSD.The aims of the graduate course include teaching the method ology, skills, and knowledge required to understand and perform research on contemporary operating systems by teachingsystems-analysis methodology and practice, exploring realworld systems artifacts, developing scientific writing skills, andreading selected original systems research papers.The course is structured into a series of modules. Cambridgeteaches using eight-week academic terms, providing limitedteaching time compared to US-style 12-to-14-week semesters.However, students are expected to do substantial work outsideof the classroom, whether in the form of reading, writing, or labwork. For the Cambridge course, we had six one-hour lectures inwhich we covered theory, methodology, architecture, and practice, as well as five two-hour labs. The labs included 30 minutesof extra teaching time in the form of short lectures on artifacts,tools, and practical skills. The rest of the students’ time wasspent doing hands-on measurement and experimentation.www.usenix.orgReadings were also assigned, as is common in graduate levelcourses, and these included both selected portions of moduletexts and historic and contemporary research papers. Studentsproduced a series of lab reports based on experiments done in(and out) of labs. The lab reports are meant to refine scientificwriting style to make it suitable for systems research. Onepractice run was marked, with detailed feedback given, but notassessed, while the following two reports were assessed andmade up 50% of the final mark.Three textbooks were used in the course: The Design and Implementation of the FreeBSD Operating System (2nd edition) as thecore operating systems textbook; The Art of Computer SystemsPerformance Analysis: Techniques for Experimental Design,Measurement, Simulation, and Modeling, which shows the students how to measure and evaluate their lab work; and DTrace:Dynamic Tracing in Oracle Solaris, Mac OS X and FreeBSD,covering the use of the DTrace system.Although many courses are now taught on virtual-machine technology, we felt it was important to give the students experiencewith performance measurement. Instead of equipping a largeroom of servers, we decided, instead, to teach with one of the newand inexpensive embedded boards based around the ARM seriesof processors. Initially, we hoped to use the Raspberry Pi as it ispopular, cheap, and designed at the same university at which thecourse would first be taught. Unfortunately, the RPi availableat the time did not have proper performance counter supportin hardware due to a feature being left off the system-on-chipdesign when it was originally produced.SPRING 2017VO L . 42 , N O . 19
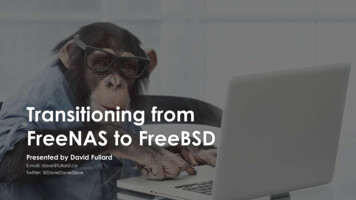
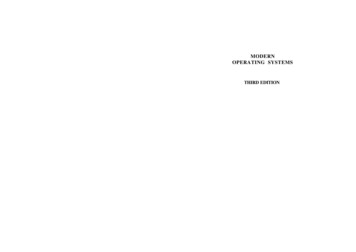
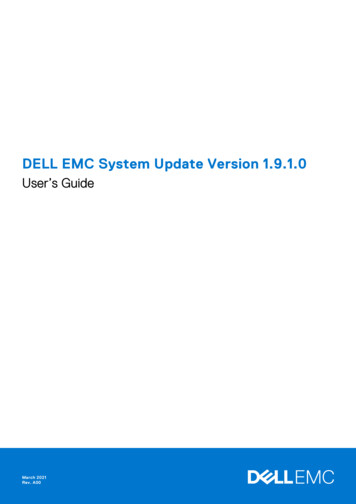
OPERATING SYSTEMSTeaching Operating Systems with FreeBSD through Tracing, Analysis, and k1stack1heap drtld/bin/dd/bin/dd/bin/ddheap arena1Figure 2: Students learn not just about the abstract notion of a UNIX “process,” but also the evolution of the approach over the decades: dynamic linking,multithreading, and contemporary memory allocators such as FreeBSD’s jemalloc.With the RPi out of the running, we chose the BeagleBone Black(BBB), which is built around a 1 GHz, 32-bit ARM Cortex A-8, asuperscalar processor with MMU and L1/L2 caches. Each student had one of these boards on which to do lab work. The BBBhas power, serial console, and network via USB. We providedthe software images on SD cards that formed the base of thestudents’ lab work. The software images contain the FreeBSDoperating system, with DTrace and support for the on-boardCPU performance counters, and a set of custom microbenchmarks. The benchmarks are used in the labs and cover areassuch as POSIX I/O, POSIX IPC, and networking over TCP.Eight Weeks, Three SectionsThe eight weeks of the course are broken up into three majorsections. In weeks one and two, there is a broad introduction toOS kernels and tracing. We want to give the students a feel forthe system they are working on and the tools they’ll be working with. During these first two weeks, students are assignedtheir first lab, in which they are expected to look at POSIX I/Operformance. I/O performance is measured using a syntheticbenchmark we provide in which students look at file blockI/O using a constant total size with a variable buffer size. Theconventional view is that increasing the buffer size will resultin fewer system calls and improved overall performance, butthat is not what the students will find. As buffer sizes grow,the working set first overflows the last-level cache, preventingfurther performance growth, and later exceeds the superpage10SPRING 2017VO L . 42 , N O . 1size, measurably decreasing performance as page faults requireadditional memory zeroing.The second section, covering weeks three through five, is dedicated to the process model (Figure 2). Because the process modelforms the basis of almost all modern programming systems, itis a core component of what we want the students to be able tounderstand and investigate during the course and afterwardsin their own research. While learning about the process model,the students are also exposed to their first microarchitecturalmeasurement lab in which they show the implications of IPC onL1 and L2 caching. The microarchitectural lab is the first onethat contributes to their final grade.The last section of the course is given over to networking, specifically the Transport Control Protocol (TCP, Figure 3). Duringweeks six through eight, the students are exposed to the TCPstate machine and also measure the effects of latency on bandwidth in data transfers. We’ve moved to an explicit iPython/Junyper Notebooks framework, hosted on the BBB, to driveDTrace/PMC experimentation, and provide a consistent dataanalysis and presentation framework. This allows the studentsto be more productive in focusing on OS internals and analysis.Challenges and RefinementsThe graduate course has been taught twice at Cambridge, andwe have reached out to other universities to talk with them aboutadopting the material we have produced. In teaching the course,www.usenix.org
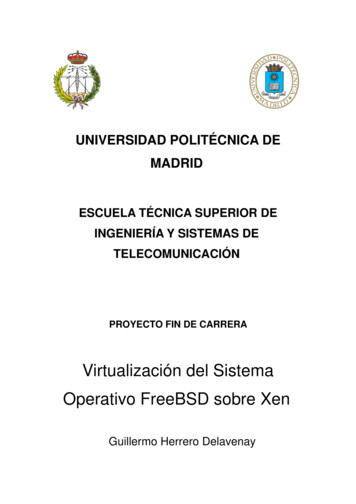
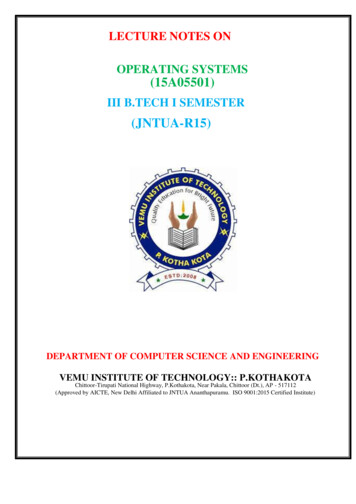
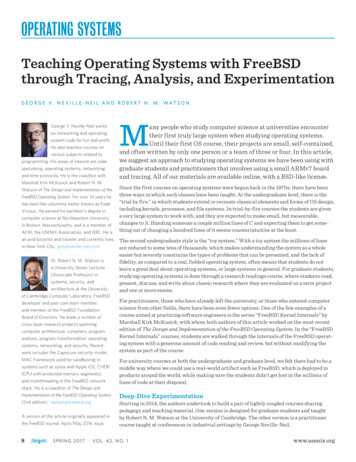
OPERATING SYSTEMSTeaching Operating Systems with FreeBSD through Tracing, Analysis, and ExperimentationNode ANode BCLOSEDSYN SENTSYNSYN / ACKACKESTABLISHEDCLOSEDTeaching PractitionersSYN RCVDDATA / ACKACKDATA / ACKDATA / ACKESTABLISHEDACKFIN WAIT-1FIN WAIT-2TIME WAIT CLOSEDFIN / ACKACKFIN / ACKACKCLOSE WAITLAST ACKCLOSEDFigure 3: Labs 3 and 4 of the course require students to track the TCPstate machine and congestion control using DTrace, and to simulate theeffects of latency on TCP behavior using FreeBSD’s DUMMYNET trafficcontrol facility.we discovered many things that worked, as well as a few challenges to be overcome as the material is refined. We can confirmthat tracing is a great way to teach complex systems because wewere able to get comprehensive and solid lab reports/analysisfrom the students, which was the overall goal of the course.The students were able to use cache hit vs. system-call rates toexplain IPC performance. They produced TCP time-sequenceplots and graphical versions of the TCP state machine all fromtrace output. Their lab reports had real explanations of interesting artifacts, including probe effects, superpages, DUMMYNETtimer effects, and even bugs in DTrace. Our experiment withusing an embedded board platform worked quite well—we couldnot have done most of these experiments on VMs. Overall, wefound that the labs were at the right level of difficulty, but thattoo many experimental questions led to less focused reports— aconcern addressed in the second round of teaching.On the technical side, we should have committed to one of R,Python, or iPython Notebooks for use by the students in doingtheir experimental evaluations and write-ups. Having a plethoraof choices meant that there were small problems in each, all ofwhich had to be solved and which slowed down the students’ prog-www.usenix.orgress. When teaching the course for the first time, there were severalplatform bumps, including USB target issues, DTrace for ARMv7bugs, and the four-argument limitation for DTrace on ARMv7.Teaching practitioners differs from teaching university studentsin several ways. First, we can assume more background, including some knowledge of programming and experience with UNIX.Second, practitioners often have real problems to solve, whichcan lead these students to be more focused and more involved inthe course work. We can’t assume everything, of course, sincemost of the students will not have been exposed to kernel internals or have a deep understanding of corner cases.Our goals for the practitioner course are to familiarize peoplewith the tools they will use, including DTrace, and to give thempractical techniques for dealing with their problems. Along theway we’ll educate them about how the OS works and dispel theirfears of ever understanding it. Contrary to popular belief, education is meant to dispel the students’ fear of a topic so that theycan appreciate it more fully and learn it more deeply.The practitioner’s course is currently two eight-hour days. Theplatform is the student’s laptop or a virtual machine. First taughtat AsiaBSDCon 2015, the course was subsequently taught atAsiaBSDCon 2016 and BSDCan 2016.Five-Day, 40-Hour Course Hardware orVM Platform Video RecordingsLike the graduate-level course, this course is broken down intoseveral sections and follows roughly the same narrative arc.We start by introducing DTrace using several simple and yetpowerful “one liners.” A DTrace one liner is a single commandthat yields an interesting result. This example one-liner displaysevery name lookup on the system at runtime.dtrace -n ’vfs:namei:lookup:entry \{ printf(“%s”, stringof(arg1));}’CPUID FUNCTION:NAME2 27847 lookup:entry /bin/ls2 27847 lookup:entry /libexec/ld-elf.so.12 27847 lookup:entry /etc2 27847 lookup:entry /etc/libmap.conf2 27847 lookup:entry /etc/libmap.confThe major modules are similar to the university course andcover locking, scheduler, files and the file system, and networking. The material is broken up so that each one-hour lecture isfollowed by a 30-minute lab in which students use the VMs ontheir laptops to modify examples given during the lectures orsolve a directed problem. Unlike classes where we have access tohardware, the students do not take any performance measurements with hwpmc(4) since the results would be unreliable anduninformative.SPRING 2017VO L . 42 , N O . 111
OPERATING SYSTEMSTeaching Operating Systems with FreeBSD through Tracing, Analysis, and ExperimentationHaving taught the practitioner course several times, we havelearned a few things. Perhaps the most surprising was that theclass really engages the students. Walking around the classduring the labs, we didn’t see a single person checking email orreading social media—they were actually solving the problems.The students often came up with novel answers to the problemspresented, and this was only after being exposed to DTrace fora few hours. Their solutions were interesting enough that weintegrated them back into the teaching during the next section.Finally, and obvious from the outset, handing a pre-built VMto the students significantly improves class startup time, witheveryone focused on the task at hand, rather than tweaking theirenvironment. Since the FreeBSD Project produces VM imagesfor all the popular VM systems along with each release, it is easyto have the students pre-load the VM before class, or to handthem one on a USB stick when they arrive.12SPRING 2017VO L . 42 , N O . 1It’s All Online!With the overall success of these courses, we have decided toput all the material online using a permissive, BSD-like publishing license. The main page can be found at www.teachbsd.org,and our GitHub repo, which contains all our teaching materialsfor both the graduate and practitioner courses, can be found athttps://github.com/teachbsd/course, where you can fork thematerial for your own purposes as well as send us pull requestsfor new features or any bugs found in the content. The third version of the Cambridge course (L41) with the Python lab environment will be online by May 2017 as the current course wraps up.We would value your feedback on the course and suggestions forimprovements as well—and please let us know if you are using itto teach!www.usenix.org
SAVE THE DATE!2017 USENIX Annual Technical ConferenceJULY 12–14, 2017, SANTA CLARA, CAwww.usenix.org/atc17The 2017 USENIX Annual Technical Conference will bring together leading systems researchers for cutting-edgesystems research and unlimited opportunities to gain insight into a variety of must-know topics, including virtualization, system and network management and troubleshooting, cloud computing, security, privacy, and trust,mobile and wireless, and more.Co-Located with USENIX ATC ’17SOUPS 2017: Thirteenth Symposium on Usable Privacy and SecurityJULY 12–14, 2017www.usenix.org/soups2017SOUPS 2017 will bring together an interdisciplinary group of researchers and practitioners in human computer interaction,security, and privacy. The program will feature technical papers, workshops and tutorials, a poster session, panels andinvited talks, and lightning talks.HotCloud ’17: 9th USENIX Workshop on Hot Topicsin Cloud ComputingJuly 10–11, 2017www.usenix.org/hotcloud17HotCloud brings together researchers and practitioners fromacademia and industry working on cloud computing technologies to share their perspectives, report on recent developments,discuss research in progress, and identify new/emerging “hot”trends in this important area. While cloud computing has gainedtraction over the past few years, many challenges remain in thedesign, implementation, and deployment of cloud computing.HotCloud is open to examining all models of cloud computing, including the scalable management of in-house servers,remotely hosted Infrastructure-as-a-Service (IaaS), infrastructureaugmented with tools and services that provide Platform-as-aService (PaaS), and Software-as-a-Service (SaaS).Submissions due: March 14, 2017Notice of Annual MeetingThe USENIX Association’s Annual Meeting with themembership and the Board of Directors will be held onThursday, July 13, in Santa Clara, CA, during the2017 USENIX Annual Technical Conference.HotStorage ’17: 9th USENIX Workshop on Hot Topicsin Storage and File SystemsJuly 10–11, 2017www.usenix.org/hotstorage17The purpose of the HotStorage workshop is to provide a forumfor the cutting edge in storage research, where researchers canexchange ideas and engage in discussions with their colleagues.The workshop seeks submissions that explore longer-term challenges and opportunities for the storage research community.Submissions should propose new research directions, advocatenon-traditional approaches, or report on noteworthy actualexperience in an emerging area. We particularly value submissions that effectively advocate fresh, unorthodox, unexpected,controversial, or counterintuitive ideas for advancing the stateof the art.Submissions will be judged on their originality, technical merit,topical relevance, and likelihood of leading to insightful discussions that will influence future storage systems research. Inkeeping with the goals of the HotStorage workshop, the reviewprocess will heavily favor submissions that are forward lookingand open ended, as opposed to those that summarize maturework or are intended as a stepping stone to a top-tier conferencepublication in the short term.Submissions due: March 16, 2017
Dynamic Tracing in Oracle Solaris, Mac OS X and FreeBSD, covering the use of the DTrace system. Although many courses are now taught on virtual-machine tech- . With the RPi out of the running, we chose the BeagleBone Black (BBB), which is built around a 1 GHz, 32-bit ARM Cortex A-8, a superscalar processor with MMU and L1/L2 caches. Each stu-