Transcription
Massachusetts Water Resources AuthorityMWRA’s Long-Range WaterSupply PlanningMay 2006
Why Are We Here? Confluence of these dynamics:– MWRA has excess capacity because of conservationmeasures– MWRA’s service area is surrounded by watersheds (orportions of watersheds) that are highly stressed– MWRA has a need for new sources of revenue as pressure onrates continues2
MWRA’s Water System3
The Watersheds4
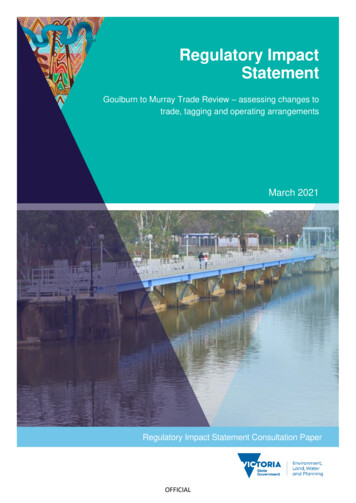
Conservatively, We Have 36 MGD AvailableDEP & Standard Practice Safe Yield35034050 mgd33032031030029036 mgd280270260WMA Registration12 mgdMWRA Practice Safe YieldWater Available to Non-MWRA Communitieswith DeficitsCommunities With Active InterestCushion for Partial Communities250Projected Growth to 2030240230MWRA 5-Year Average Demand220MWRA Current Demand5
MWRA Current Demand350DEP & Standard Practice Safe Yield340330320310300290280270260WMA RegistrationMWRA Practice Safe YieldWater Available to Non-MWRA Communitieswith DeficitsCommunities With Active InterestCushion for Partial Communities250Projected Growth to 2030240230MWRA 5-Year Average Demand220MWRA Current Demand6
“Safe Yield” DEP Safe Yield & Standard Engineering355 mgd All Time Highest Usage 1980342 mgd WSCAC 1984318 mgd WMA Registration312 mgd MWRA300 mgdNet of 31 million gallons of required releases7
MWRA Current Demand350DEP & Standard Practice Safe Yield340330320310300290280270260WMA RegistrationMWRA Practice Safe YieldWater Available to Non-MWRA Communitieswith DeficitsCommunities With Active InterestCushion for Partial Communities250Projected Growth to 2030240230MWRA 5-Year Average Demand220MWRA Current Demand8
MWRA Current DemandMWRA Water Demand vs. System Safe YieldMillion Gallons Per Day350325300275System's Long-Term Safe Yield of 300 MGD*25022520085 86 87 88 89 90 91 92 93 94 95 96 97 98 99 00 01 02 03 04*Includes temporary supply to Cambridge during construction of local w ater treatment plant9
City of Boston Water Demand 1910 - 0
Projected Growth to 2030350DEP & Standard Practice Safe Yield340330320310300290280270260WMA RegistrationMWRA Practice Safe YieldWater Available to Non-MWRA Communitieswith DeficitsCommunities With Active InterestCushion for Partial Communities250Projected Growth to 2030240230MWRA 5-Year Average Demand220MWRA Current Demand11
A Conservative Look At Demand: What the Future HoldsBased on 2030 projections (using MAPC and Pioneer Valley RegionalPlanning Commission employment and population projections)230 mgd - baseline (5 year average for existing service area now) 3.5 mgd from new communities now pursuing MWRA admission 12.3 mgd from new population and employment through 2030245.8 mgdBased on EOEA Build-out analysis:230 mgd - baseline (5 year average for existing service area now) 3.5 mgd from new communities now pursuing MWRA admission 24.8 mgd from new population and employment at build-out258.3 mgd12
Cushion for Partially-Supplied Communities350DEP & Standard Practice Safe Yield340330320310300290280270260WMA RegistrationMWRA Practice Safe YieldWater Available to Non-MWRA Communitieswith DeficitsCommunities With Active InterestCushion for Partial Communities250Projected Growth to 2030240230MWRA 5-Year Average Demand220MWRA Current Demand13
What Can Be Expected From Local Sources? MWRA typically provides 14 mgd of water to 12 partially supplied communities to supplement31 mgd in local sources Cambridge, Worcester and Leominster only use MWRA in an emergency, typically relying on38 mgd in local .92.2Worcester23.60CambridgeMWRA14 MGDLocal69 MGD** “Cushion for partial communities”assumes 25% of local sources14
Communities With Active Interest350DEP & Standard Practice Safe Yield340330320310300290280270260WMA RegistrationMWRA Practice Safe YieldWater Available to Non-MWRA Communitieswith DeficitsCommunities With Active InterestCushion for Partial Communities250Projected Growth to 2030240230MWRA 5-Year Average Demand220MWRA Current Demand15
Potential Connections to MWRA Water System:Active InterestApplicantApplicable PolicyMWRAWithdrawalStatusWilmingtonNew Community1-1.5 mgd(average)SEIR/CWRMPanticipated to besubmitted in 2006Weymouth Naval AirStationTri-Town DevelopmentCorpNew Community/Local Body1.4 mgdMEPA NPC identifiedMWRA as preferredoptionEIR in preparationLeggs Hill/North Shore YMCASalem/MarbleheadWater Straddle. 018 mgdApplication to MWRAthis SpringTotal Proposed Withdrawals2 .418 –2.918 mgd16
Conservatively, We Have 36 MGD AvailableDEP & Standard Practice Safe Yield35034050 mgd33032031030029036 mgd280270260WMA Registration12 mgdMWRA Practice Safe YieldWater Available to Non-MWRA Communitieswith DeficitsCommunities With Active InterestCushion for Partial Communities250Projected Growth to 2030240230MWRA 5-Year Average Demand220MWRA Current Demand17
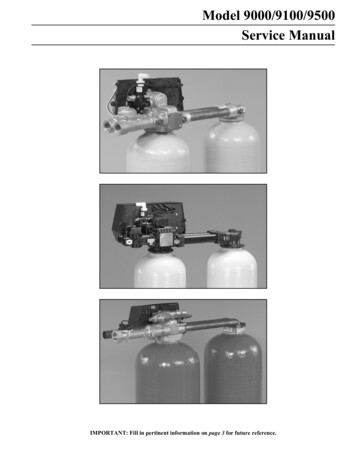
Quabbin Reservoir Level (% Full)100.0%80.0%60.0%1 in 20 years drought40.0%1 in 300 years 0018
MWRA’ s Estimates of Potential Supplemental DemandHingham/HullSharonTotal1.30.21.5Lynnfield Centre Water DistrictSalem pkintonMedwayMilford Water Co.FranklinTotalLancasterSterlingWest BoylstonBoylstonSouth HadleyTotalGrand Total0.90.20.80.20.30.73.10.20.90.50.10.52.210.6 mgd19
MWRA Water Service Area and Basins20
MWRA Water Service Area and Stressed Areas21
MWRA Water Service Area and Potential SystemExpansion22
Conservation IndicesCommunitySharonConservation IndicesResidential r6721West Boylston6820South Hadley Fire District 263Hingham/Hull Data Suspect23
Other Characteristics of the Potential MWRA Communities The overwhelming majority is already conserving. Given the location ofgrowth and the nature of water withdrawals, concerns over low flow andriver stress may persist, even where conservation is practiced Communities that join MWRA would be required to maintain conservationand leak detection programs now in place Communities would benefit from MWRA’s leak detection programs andconservation efforts Communities might also benefit from MWRA’s technical assistance oninfiltration/inflow reduction to also help reduce export of groundwater outof basins24
The Many Hurdles of Joining the System Prior to application to MWRA and the MWRA AdvisoryBoard, a number of approvals must first be obtained,including:– Local Community– MEPA Review– Water Resources Commission Review underInterbasin Transfer Act– Legislature– Governor– MWRA Advisory Board– MWRA Board of Directors25
The Many Hurdles of Joining the SystemMWRA must find that the safe yield of the watershed system, on the advice of the DCR, is sufficient to meet theprojected demandMWRA must find that no existing or potential source for the community has been abandoned, unless the Department ofEnvironmental Protection has declared that the source is unfit for drinking and cannot be economically restoredMWRA must find that a water management plan has been adopted by the community and approved by the WaterResources CommissionMWRA must find that effective demand management measures have been developed by the community, including theestablishment of lead detection and other appropriate system rehabilitation programsMWRA must find that a local source feasible for development has not been identified by either the community or DEPMWRA must find that a water use survey has been completed which identifies all users within the community thatconsume in excess of twenty million gallons per yearMWRA must find that any expansion of the MWRA water service system shall strive for:no negative impact on the interests of the current user communities; no negative impacts on water quality;no negative impact on the hydraulic performance of the MWRA water system; no negative impact on the environmentor on the interests of the watershed communities; and, shall attempt to achieve economic benefit for existing usercommunitiesMWRA must find that the community has met all legal requirements for admissionUpon admission, the community will pay fair compensation for past investment in the MWRA waterworks system byexisting user communities26
Which Communities are Not Included on MWRA’sPreliminary List Communities where factors such as distance and isolation fromMWRA and other technical difficulties preclude MWRA service. Communities where there is little water supply distributioninfrastructure Communities where there is the potential for reasonableconservation measures to fully address their future shortfalls orresolve existing river stress concerns27
Quabbin Storage and Required Releases Means the Swifthas WaterOrange is below normal and Red is very low. Green is average flow.28
Swift River Flow ContributionAverage Monthly Flows (cfs)40,00035,00001172010 CT R @ Holyoke01177000 Chicopee R @ Indian Orchard01175500 Sw ift R @ W Ware30,000Cfs25,00001173500 Ware R @ Gibbs Cr01176000 Quaboag R @ W Brimfield20,00015,00010,0005,0000Jan Feb Mar Apr May JunJulAug Sep Oct Nov Dec29
MGDRiver Releases10009008007006005004003002001000Jan/04 May/04 Sep/04Jan/05 May/05 Sep/05Swift River ReleaseJan/06Nashua River Release30
31
Environmental Aspects of System Expansion In the summer, streamflows in Massachusetts’s rivers largely consist ofbaseflow derived from adjacent aquifers and occasionally, releases fromsurface water storage The Ipswich River, Upper Charles River, Boston Harbor Basin, andSUASCO (Sudbury, Assabet, and Concord ) River basins are sources ofwater supply for partially supplied MWRA communities and communitiesbeyond MWRA’s water service area Most derive their water supply from ground water sources, where there isoften little storage. Therefore, withdrawals for water supply in thesummer exacerbate already naturally occurring low flows In contrast, MWRA’s multi-year reservoirs capture spring flows to supportsummer withdrawals and to dampen year- to year variation inprecipitation that might otherwise strain water resources32
Environmental Aspects of System Expansion“By properly coordinating the use of surface and groundwatersupplies, optimum regional water resource developmentseems most likely to be assured.”Source: Introduction to Hydrology, Warren Weissman MWRA’s proposition:– By properly coordinating use of MWRA’s multi-year reservoirswith groundwater withdrawals in stressed rivers (which oftensupport high population densities), more optimum waterresource planning can occur33
MWRA’s Capital Improvement Program1986 - 2016 700ActualBoston Harbor ProjectProjected 600Drinking WaterMetroWest TunnelWastewater Interception &Pumping, and Facilities 500Other WaterworksQuality ImprovementsImprovementsWaterworks Distribution &PumpingMillions 400Combined SewerOverflows 300Business andOperations Support 200 100 Y10FY12FY14FY1634
Combined Water & Sewer Rate Growth Comparison Among USCities: 1985 to 2003 841MWRA Service Area 570 143 700San Francisco 542 307 599Washington DC 542 262 576Philadelphia 505 384 551 386 361New Orleans 536 536Houston 447 391 330 337Indianapolis 0 100 200 300 4001985 5001994 600 700 800 900200335
FY2007 Proposed BudgetFY06 ProposedFY07Rate Revenue Requirement 518.5 563.5 612.2Rate Revenue IncreaseEstimated Annual Household Charges9.8%FY07FY088.7%FY08Based on 61,000 gallons (DEP weighted) 675 726Based on 90,000 gallons 996 1,071FY098.7%FY09 780FY10FY11FY12FY13FY14FY15FY16 665.4 700.2 730.7 759.2 763.2 770.6 759.18.7%FY10 8405.2%FY11 8834.4%FY12 9233.9%FY130.5%FY141.0%FY15 962 1,012 1,035-1.5%FY16 1,041 1,152 1,239 1,303 1,362 1,420 1,446 1,478 1,48736
Impact of Debt Service on Annual Revenue Requirement Debt service as a percentage of total MWRA budget is increasingsignificantly37
Economic Impacts Entrance fee revenue 5.2 million per 1 mgd (up-frontpayment/one-time impact) Hypothetically speaking, if 22 new communities joined in FY2007,using a total of 10 mgd– MWRA annual operating expenses would increase less than 1 million– 50 existing member communities would benefit because “ratebase” is larger, water assessments would be lowered by 4.5%for a total savings to communities of 7 million per year38
Boston Globe Editorial - May 20, 2006“Handled correctly, a modestexpansion could achieve bothenvironmental and smartgrowth goals.”“Both wildlife habitat and riverrecreation will benefit if theIpswich and other stressedbasins in EasternMassachusetts get somerelief.”39
It’s a Win - Win - Win Confluence of these dynamics:– MWRA has excess capacity because of conservationmeasures– MWRA’s service area is surrounded by watersheds (orportions of watersheds) that are highly stressed– MWRA has a need for new sources of revenue as pressure onrates continues40
All Time Highest Usage 1980 342 mgd WSCAC 1984 318 mgd . * Includes temporary supply to Cambridge during construction of local water treatment plant System's Long-Term Safe Yield of 300 MGD * 10 City of Boston Water Demand 1910 - 2004 60 80 . (Sudbury, Assabet, and Concord ) River basins are sources of water supply for partially .