Transcription
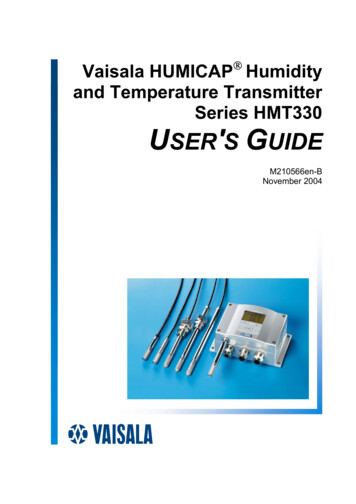
ENERGYVaisala 3TIER Services Global Solar Dataset/ Methodology and ValidationGlobal Horizontal Irradiance70180330 W/m2IntroductionSolar energy production is directly correlated to theamount of radiation received at a project location. Like allweather-driven renewable resources, solar radiation canvary rapidly over time and space, and understanding thisvariability is crucial in determining the financial viability ofa solar energy project.The three components of irradiance most critical fordetermining solar installation production values are globalhorizontal irradiance (GHI), direct normal irradiance (DNI),and diffuse horizontal irradiance (DIF). In this paper we arefocused on validating GHI, or the total amount of radiationreceived by a horizontal surface, which is the primaryresource in photovoltaic (PV) installations.Most financing options for solar projects requireinformation on expected yearly irradiance values asprojects typically have to service debt one to four timesper year. However, annual averages do not provide enoughinformation to determine accurate annual irradiance andpower production values.Depending on the characteristics of a site, studies haveshown that on average, annual irradiance means can differfrom the long-term mean by 5% for GHI and by as much as20% for DNI.1 Thus a long-term record of solar irradianceestimates is needed to calculate a realistic variance ofproduction values.The existing network of surface observation stationsis too sparse to quantify solar resources at most potentialsites. Also a vast majority of stations only provide a limitedshort-term record of the resource (months to a few years),are rarely located near proposed sites, and are oftenplagued with measurement errors. Calculating site-specificsolar irradiance values using geostationary satellite datais an accepted alternative.2 Within the global atmosphericsciences community, satellite-derived values have proven to bemore accurate than nearby surface observations for locationsthat are more than 25 km away from a ground station.3Through its acquisition of 3TIER, Vaisala is the firstorganization, either public or private, to map the entireworld’s renewable resource potential at resolutions of 5 kmor higher, providing a global blueprint for wind, solar, andhydro project development. Vaisala was the first to createa high-resolution, global solar dataset using a consistentsatellite processing methodology to help clients determinesolar variability at any site worldwide, from the prospectingstage through assessment and bankability.In this paper, we will provide an outline of standardpractices that should be followed to ensure accurate solarassessment. We will also describe the methodology Vaisalaused to create its continually updated global solar datasetand provide results from an extensive validation study.Validation statistics by region are shown in the Appendix.
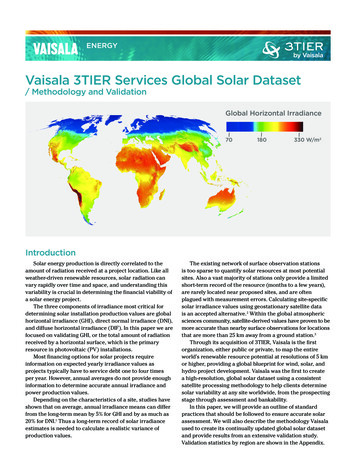
Solar DevelopmentRoadmapDeveloping a solar projectrequires a large upfront investment.A standard development roadmapconserves time and money andensures that the most promisingprojects are constructed. Eachstage of development asks differentquestions about the solar resourceand each stage requires varyingdegrees of information and financialinvestment.Prospecting and PlanningThe first step in building any solarenergy project is identifying the regionsmost suitable for development. Theprice of energy, access to transmission,and environmental siting issues shouldall be taken into consideration, butthe most essential variable is theavailability of the solar resource – the“fuel” of the project. At this early stage,average annual and monthly solarirradiance values can be used to assessthe overall feasibility of a particularsite and to select the appropriate solartechnology to be installed. Gettingtime series or typical meteorologicalyear (TMY) data is an even bettermethod, particularly when it is fromthe same data source you plan to usefor financing. Having the same datasource throughout the develomentprocess helps avoid a number ofunpleasant surprises further down thedevelopment roadmap. Vaisala’s onlineSolar Prospecting and Time SeriesTools allow developers to quicklytarget the best locations for furtherinvestigation and identify red flagsearly in the process.Design and Due DiligenceOnce a promising site is identified,a more in-depth analysis is requiredto better quantify the long-termavailability of the solar resource, todesign technical aspects of the project,and to secure the upfront capital forconstruction. A common source ofsolar data used for this purpose iswww.vaisala.com/energyPROSPECTINGFINANCETMY data. A TMY dataset provides a1-year, hourly record of typical solarirradiance and meteorological valuesfor a specific location in a simple fileformat. Although not designed to showextremes, TMY datasets are based ona long time period and show seasonalvariability and typical climaticconditions at a site. They are oftenused as an input to estimate averageannual energy production.While TMY data provide agood estimate of the average solarirradiance at a site, they are not agood indicator of conditions over thenext year, or even the next 5 years.The U.S. National Renewable EnergyLaboratory User Manual for TMY3data explicitly states, “TMY shouldnot be used to predict weather for aparticular period of time, nor are theyan appropriate basis for evaluatingreal-time energy production orefficiencies for building designapplications or a solar conversionsystem.”4 Hourly time series coveringa period of several years providea much more complete record forcalculating accurate estimates of solarresource variability.Year-to-year variability has asignificant impact on annual energyproduction. Many financial andrating institutions, as well as internalcertification organizations, require1-year P90 values to assess theeconomic feasibility of a project.5 A1-year P90 energy value indicatesthe production value that the annualScan the code formore informationOPERATIONSenergy output will exceed 90% of thetime. A 1-year P90 value (as opposedto a 10-year P90 value) is typicallymandatory because most solarprojects have a lending structurethat requires them to service debtone to four times a year, not one tofour times every 10 years. If powerproduction decreases significantly ina given year due to solar variability,debt on the project may not be ableto be paid and the project coulddefault on its loan. This is preciselywhat financiers are trying to avoid.The only way to determine 1-yearP90 values acceptable to fundinginstitutions is with long-termcontinuous data at the proposedsite.If collected properly, surfaceobservations can provide veryaccurate measurements of solarradiation at high temporal resolution,but few developers want to waitthe 10 years required to developan accurate 1-year P90 GHI valueor even the 5 years necessary fora P50 GHI value. Satellite-derivedirradiance values can accuratelyprovide a long-term, hourly timeseries of data without the expenseand wait. However, satellite datacannot always capture the microscale features that affect a site.Therefore, a combination of shorttermground measurements andThis material is subject to copyright protection, with allcopyrights retainedby Vaisala and its individualirradiancepartners. Alllong-termsatellite-derivedrights reserved. Any logos and/or product names are trademarksof Vaisala orisits individualpartners.The reproduction, transfer,valuesideal forassessingdistribution or storage of information contained in this brochurein any form withoutandthe priorwritten consentof Vaisala is strictlyvariabilityprojectrisk.prohibited. All specifications — technical included — are subjectto change without notice.
One method of combiningshort-term ground measurementswith longer-term satellite datais a technique known as modeloutput statistics (MOS). Vaisalapioneered the use of on-siteobservational data to validateand bias correct satellite-derivedirradiance data. Our proprietaryMOS technique uses an hourlymulti-linear regression equation toremove bias and adjust the varianceof the satellite model output tobetter match the observationaldata. The MOS equation for eachobservation station is trained overthe observational period of record.The MOS equation is then applied toall time steps of the modeled dataset,so that corrections can be made forperiods during which observationaldata are unavailable.The value of performing MOScorrection is that it captures theunique characteristics of a sitethrough on-site observations andplaces them into the long-termhistorical perspective provided bythe 3TIER Services modeled data.After validating the technique at manysites globally, Vaisala has determinedthat the resource model uncertaintycan be reduced by 50% using thismethodology.These comprehensive solarresource assessments are used in aSolar Due Diligence Assessment tosimulate the hour-by-hour electricalproduction of a specific, but yet-to-bebuilt solar generating station. A goldstandard due diligence assessmentincludes a site adapted solar resourcestudy and a net energy assessment.Production estimates are highlycomplex and involve dozens ofspecific assumptions and considerableexercise of professional judgment,which Vaisala’s specialized andexperienced personnel have amassedthrough assessing more than 42 GWof proposed solar projects globally,including preparing energy estimateswww.vaisala.com/energyfor 5 GW.Operations andOptimizationWith more solar energy cominginto the grid every day, effectivelymanaging its integration is becomingincreasingly important. Once aproject is operational, forecastingplays a vital role in estimating hourand day-ahead solar productionand variability. This information iscritical for estimating production,scheduling energy, managing amixed energy portfolio, avoidingimbalance charges, and detectingreduced production days.Some rudimentary numericalweather prediction (NWP) modelingsystems have been introduced forthis purpose. However, Vaisalahas found that basic NWP modelspoorly estimate cloud cover, thesingle variable that most directlyimpacts solar energy production,and for this reason, have introducedadvanced forecasting technologiesincorporating machine learningto blend NWP models withobservations to allow operatorsto more accurately schedule solarenergy.Recent solar irradianceobservations from satellite-deriveddatasets or on-site observationsfrom systems such as Vaisala’s SP-12solar measurement station can alsobe used to model the energy thata project should have producedbased on actual weather conditions.Comparing modeled productionwith actual production helpsidentify underperforming projectsand explain to what extent solarvariation is impacting production.This periodic, ongoing reconciliationhelps pinpoint maintenance andequipment issues, particularlyfor those with a geographicallydispersed portfolio of projects.Scan the code formore informationThis material is subject to copyright protection, with allcopyrights retained by Vaisala and its individual partners. Allrights reserved. Any logos and/or product names are trademarksof Vaisala or its individual partners. The reproduction, transfer,distribution or storage of information contained in this brochurein any form without the prior written consent of Vaisala is strictlyprohibited. All specifications — technical included — are subjectto change without notice.
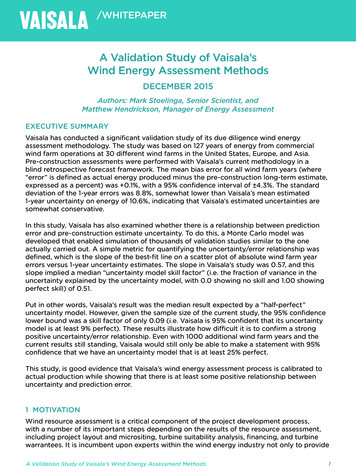
Vaisala 3TIER Services Solar MethodologyVaisala continues to maintain and improve upon its global, long-term,high-resolution solar dataset, which was created using satellite observationsfrom around the world. As discussed earlier in this document, satellite-deriveddata have proven to be the most accurate method of estimating surface solarirradiance beyond 25 km of a ground station. However, either technologyrequires special consideration. For example, if there is a dramatic elevationdifference between a ground station and a project location, data from theground station may not be representative of conditions at the project site.Satellite data accuracy can also be influenced by local terrain, such as inlocations along coastlines or near dry lake beds.Vaisala’s main source of satellite observations is weather satellites in ageostationary orbit. These satellites have the same orbital period as the Earth'srotation and, as a result, their instruments can make multiple observations ofthe same area with identical viewing geometry each hour.Vaisala’s methodology uses visible satellite imagery to calculate the levelof cloudiness at the Earth’s surface. The resulting time series of cloudiness (orcloud index) is then combined with other information to model the amount ofsolar radiation at the Earth’s surface. The outcome is an 18 year dataset thatFigure 1. Vaisala’s solar methodologyShuttle RadarTopographyMission (STRM)MODIS orMERRA2 orECMWF MACC5 GeostationarySatellitesIMS DailyNorthernHemisphere Snowand Ice AnalysisElevationTurbidityRaw DataSnow CoverProprietary 3TIERServices CloudAlgorithmModifiedKastenor REST2Cloud IndexClear Sky IrradianceDNIwww.vaisala.com/energyGHIDIFScan the code formore informationThis material is subject to copyright protection, with allcopyrights retained by Vaisala and its individual partners. Allrights reserved. Any logos and/or product names are trademarksof Vaisala or its individual partners. The reproduction, transfer,distribution or storage of information contained in this brochurein any form without the prior written consent of Vaisala is strictlyprohibited. All specifications — technical included — are subjectto change without notice.
provides hourly and sub-hourlyestimates of surface irradiance (GHI,DNI, and DIF) for all of the Earth’sland mass at a spatial resolution ofapproximately 3 km (2 arc minutes).Vaisala’s global solar datasetis based on over a decade of halfhourly, high-resolution visiblesatellite imagery via the broadbandvisible wavelength channel. Thesedata have been processed usinga combination of peer-reviewed,industry standard techniques andprocessing algorithms developedin-house, including a cloud-indexalgorithm that produces consistentresults when used with the largenumber of satellites that must becombined to construct a globaldataset. With our methodology wecurrently produce five estimates ofirradiance using different algorithmsand inputs to provide our clientsa full understanding of resourcevariability.Despite the resolution of thedataset, some factors need to betaken into consideration by the user.Vaisala’s global solar datasets donot directly account for local shadesand shadows and, as a result, localconditions must be considered wheninterpreting the irradiance values.Also, in some areas with highlyreflective terrain, such as salt flatsand areas with permanent snow, thesatellite algorithms have difficultydistinguishing clouds from theterrain. The cloudiness estimatesin these areas are higher than theyshould be and the amount of GHIand DNI is underestimated and theDIF is overestimated. Known areasaffected by this problem includehighly reflective areas such as LakeGairdner National Park in SouthAustralia.Satellite-based time seriesof reflected sunlight are usedto determine a cloud index timeseries for every land surfaceworldwide. A satellite-based dailysnow cover dataset is used to aid indistinguishing snow from clouds. Inwww.vaisala.com/energyaddition, the global horizontal clearsky radiation (GHC), or the amountof radiation in the absence of clouds,is modeled based on the surfaceelevation of each location, the localtime, and the measure of turbidity inthe atmosphere.Vaisala employs two clear skymodels. The first clear sky modelused is a modified Kasten clearsky model, as presented in thisreference2 (hereafter referred to asModified Kasten). The second is theREST2 9.0 model, a parameterizedversion of Dr. Gueymard's SMARTSradiative transfer model.6 With boththe Modified Kasten methodology,and the REST2 model, GHI iscalculated by combining the cloudindex values with the GHC valuesto calculate GHI. In the ModifiedKasten method, DNI is calculatedfrom GHI using Perez's DIRINT modeloutlined in the 2002 paper. In theREST2 model, a modulation functionis used to calculate DNI from thecloud index and the clear sky DNIvalue. For the irradiance componentsof the process that are calculated,a calibration function is applied foreach satellite region based on a setof high-quality surface observations.For both models, diffuse is thencalculated from GHI, DNI, and solarzenith angle.Atmospheric turbidity describesthe transparency of the atmosphereto solar radiation, and is affectedby aerosols and water vapor.Unfortunately, direct observationsof turbidity are made at only a fewlocations. Vaisala ingests severalsources of aerosol inputs anduses them in our various modelsincluding MODIS Atmosphere DailyGlobal Product, the ECMWF-MACC(European Centre for Medium-RangeWeather Forecasts - MonitoringAtmospheric Composition andClimate) II reanalysis dataset, andMERRA2 (Modern-Era Retrospectiveanalysis for Research andApplications, Version 2) reanalysisdataset. For the Modified KastenScan the code formore informationmethod, turbidity is described bythe Linke turbidity coefficient basedupon the calculations outlinedin Ineichen and Perez, 2002. Wecombine the data with anotherturbidity dataset that includes bothsurface and satellite observationsto provide a turbidity measure thatspans the period of our satellitedataset and is complete for all landsurfaces. In the REST2 models,turbidity is estimated using aerosoloptical depth (AOD), water vapor,angstrom exponent, and surfacepressure taken from either theECMWF-MACC dataset or theMERRA2 dataset. After testing,default values were chosen for othermodel input parameters: ozone,surface albedo, single-scatteringalbedo, and asymmetry parameter.Vaisala combines the aboveinputs to create five differentversions of our global solar dataset.In each version the satellite imagery,snow data, topography, and albedosources are the same. In all versions,the Vaisala proprietary cloud indexcalculation methodology is alsoused. The model variations comefrom different combinations of theclear sky models and turbidity inputs(Table 1).This material is subject to copyright protection, with allcopyrights retained by Vaisala and its individual partners. Allrights reserved. Any logos and/or product names are trademarksof Vaisala or its individual partners. The reproduction, transfer,distribution or storage of information contained in this brochurein any form without the prior written consent of Vaisala is strictlyprohibited. All specifications — technical included — are subjectto change without notice.
Table 1. Inputs to each of Vaisala’s dataset modelsVaisalaModelClear SkyModelTurbidity InputParametersTurbidity InputResolutionTemporal / SpatialAerosol Source1.0ModifiedKastenAOD550 nmMonthly/1 x1 MODIS (Terra)Precipitable Water (cm)Monthly/1 x1 MODIS (Terra)1.1ModifiedKastenAOD550 nmMonthly/1 x1 MODIS (Terra, Aqua)Precipitable Water (cm)Monthly/1 x1 MODIS (Terra, Aqua)1.2ModifiedKastenAOD550 nmDaily/1 x1 MODIS (Terra, Aqua)Precipitable Water (cm)Monthly/1 x1 MODIS (Terra, Aqua)AOD 380 nm - 1020 nm3 hourly/0.7 ECMWF-MACCPrecipitable Water (cm)3 hourly/0.7 ECMWF-MACCSurface Pressure (Pa)3 hourly/0.7 ECMWF-MACCAOD550 nmHourly/0.5 lat x 0.625 lonMERRA2Precipitable Water (cm)Hourly/0.5 lat x 0.625 lonMERRA2Surface Pressure (Pa)Hourly/0.5 lat x 0.625 lonMERRA2Angstrom ExponentHourly/0.5 lat x 0.625 lonMERRA22.02.1REST2REST2Notes on the datasetsVaisala 1.0Vaisala 2.0The Vaisala 1.0 dataset is theoriginal dataset created by Vaisala(previously known as 3TIER) in 2009.It uses the modified Kasten clear skymodel and monthly average aerosoloptical depth (AOD) from the MODISDark Target AOD retrieval algorithm.The Vaisala 2.0 dataset is thefirst dataset Vaisala created usingthe new REST2 clear sky modeldeveloped in 2016 and uses ECMWFMACC for the turbidity inputs.Vaisala 1.1The Vaisala 1.1 dataset is thedataset most commonly used byVaisala since its release in 2012.The main change from the Vaisala1.0 dataset was to incorporate AODfrom both Dark Target and Deep BlueMODIS retrieval algorithms.Vaisala 2.1Also developed in 2016, theVaisala 2.1 dataset is the seconddataset Vaisala created using thenew REST2 clear sky model. Themain change over the Vaisala 2.0dataset is the use of MERRA2 forturbidity inputs.Vaisala 1.2Developed in 2014, the Vaisala 1.2dataset is the third dataset variationusing the modified Kasten approach.The main change over the Vaisala 1.1dataset was increasing the temporalresolution of MODIS AOD data frommonthly averages to daily averages.www.vaisala.com/energyScan the code formore informationThis material is subject to copyright protection, with allcopyrights retained by Vaisala and its individual partners. Allrights reserved. Any logos and/or product names are trademarksof Vaisala or its individual partners. The reproduction, transfer,distribution or storage of information contained in this brochurein any form without the prior written consent of Vaisala is strictlyprohibited. All specifications — technical included — are subjectto change without notice.
ConclusionVaisala actively maintainsall versions of the dataset inorder to give our clients a betterunderstanding of local resourcevariability. In different regions, oneversion may perform more accuratelythan another due to local factors,such as pollution or dust, whichare better detected by a particularturbidity input, or the location mayhave some seasonal irradiancevariations that are captured withhigher precision by one clear skymodel compared to another. If all themodels show very similar results,there can be high confidence in theirradiance values. However, sitesthat show a spread of irradiancevalues are good candidates forincluding ground station data in theassessment.www.vaisala.com/energyTo give project developers higherconfidence in our irradiance valuesand assessment results, Vaisalaprovides multiple datasets thatuse trusted underlying processingmethodologies to allow clients tocompare the results and find the onethat best fits local conditions.How should one choose thebest dataset to use? The first stepis to review the regional validationresults contained in this paper andidentify which model performs bestin your region of interest. Pleasecontact Vaisala for further details atthe validation locations, so you canreview results at sites closest to yourproject location. Secondly, if youhave a ground station in the projectarea, compare the different dataoptions for the concurrent period ofScan the code formore informationtime and evaluate which ones mostclosely match your ground data.Lastly, if you have no ground datato refer to, we don’t recommendusing the highest or the lowest timeseries record, but rather a versionthat is in the middle of the resultsand has good validation statistics inthe region. The final considerationwould be the technology employed.If a tracking photovoltaic orconcentrating solar plant are underconsideration, all other statisticsbeing equal, we would suggest oneof the REST2 based models becauseof the increase in the accuracy of theDNI irradiance component.This material is subject to copyright protection, with allcopyrights retained by Vaisala and its individual partners. Allrights reserved. Any logos and/or product names are trademarksof Vaisala or its individual partners. The reproduction, transfer,distribution or storage of information contained in this brochurein any form without the prior written consent of Vaisala is strictlyprohibited. All specifications — technical included — are subjectto change without notice.
Validation of Vaisala3TIER Services GlobalIrradiance DatasetAn extensive validation ofVaisala’s satellite data was performedusing observations from almost 200surface stations across the globe. Inthe study, Vaisala used stations fromthe World Climate Research Programand the Baseline Surface RadiationNetwork, national programsfrom the Indian MeteorologicalDepartment, the Australian Bureauof Meteorology, the National SolarRadiation Database, and severalother observational datasets.Equipment used to measure GHIhave varying uncertainty estimatesover an annual basis. The bestequipment has uncertainty of lessthan 1% at a 95% confidence level,but most equipment deployed forsolar project measurements is inthe 1.5–2% range and some of thesecond class equipment deployedis closer to 4–6% uncertainty atthe 95% confidence level. TheWorld Climate Research Programestimates solar ground stations canhave inaccuracies of 6–12% on theinstantaneous irradiance values.Specialized high-quality researchsites, such as those from theBaseline Surface Radiation Network,are possibly more accurate by afactor of two.7These constraints make directcomparisons between solar radiationdatasets difficult, but it is still possibleto estimate the relative accuracy ifthe same reference observations areused. Vaisala did basic quality controlof each observations station andanomalous stations from each networkwere removed from the results. Thestatistics presented in the followingsections were computed using onlydaytime irradiance values, whichprovide a better indication of theaccuracy and value of the dataset.Global ValidationStatisticsWhenever Vaisala releases a newversion of the irradiance dataset, anwww.vaisala.com/energyextensivevalidation is performedand released publicly. It is extremelyimportant to Vaisala that theintegrity of the validation processbe unquestionable. To that end, wecultivate an extensive database ofpublic ground station data that isreserved for use exclusively in thevalidation process and is not allowedto influence the dataset’s creation inany way. Additionally, private clientdata is not allowed to be used in thepublic validation process except byexplicit permission. Our validationresults represent the accuracy of ourirradiance dataset for a concurrentperiod of time with independentground stations not used in thecalibration process.The validation of all versionsof the dataset was carried out in2017. Results in the tables providedin the Appendices provide a list ofstatistical metrics. The computedstatistics include those mostcommonly used in the solar industry,such as mean bias error (MBE),mean absolute error (MAE), andhourly root mean square error(RMSE). Mean bias error (MBE)provides information about theaverage difference in the mean overthe entire dataset when comparedagainst observations. Mean absoluteerror (MAE) measures the averagemagnitude of the deviation betweenthe ground station and the models.Root mean square error (RMSE) alsomeasures the average magnitudeof the deviation, but uses quadraticweighting, which results in largeerrors carrying more weight. Asmaller RMSE value means thatthe dataset more closely tracksobservations on an hour-by-hourbasis. Together MBE, MAE, andhourly RMSE can be used to assessthe accuracy of a solar datasetcompared to observations.Comparison statistics werecalculated for GHI based on the overallbias at each location, both regionallyand globally. Spatial distribution of GHIbias is shown globally in the World GHIAppendix and figures are provided inregional appendices. In order to haveglobal representation in results, 196GHI measurement stations were usedScan the code formore informationin the study with data from qualitycontrolled measurement networks.Each site had at least one completeyear of measurement data.Globally, Vaisala GHI values show aMBE standard deviation of 4.4%-4.9%depending on the model (Table A-1).Regionally the different GHI modelsshow varying results largely tied tothe aerosol datasets and is one of thereasons we provide multiple optionsin order to have the best data availablelocally.For example, in the SouthAmerican region MBE standarddeviation for the REST2 based models(4.1% and 4.6%) is lower than that forthe Kasten based models (5.5%–5.7%)(Table A-6). However, in NorthAmerica, the opposite appears tobe the case with the REST2 basedmodel MBE standard deviation beinghigher (3.9% and 4.2%) than theKasten based model values (3.3%–3.6%). It should be noted that all themean errors are within the standarddeviation of bias of observations asdetermined by the World ClimateResearch Program.ReferencesGueymard, C., Wilcox, S., Spatial and TemporalVariability in the Solar Resource. Buffalo, NY:American Solar Energy Society, May 2009.Print.1Perez, R., Ineichen, P., Moore, K., Kmiecik,M., Chain, C., George, R., Vignola, F. "A NewOperational Satellite-to-Irradiance Model."Solar Energy 73.5 (2002): 307–317. Print.2Zelenka, A., Perez, R., Seals, R., Renné, D."Effective Accuracy of Satellite DerivedIrradiance." Theoretical and AppliedClimatology. 62.3–4 (1999): 199–207. Print.3Marion, W. and Wilcox. S. Users Manual forTMY3 Data sets. Golden: National RenewableEnergy Laboratory, 2008.4Venkataraman, S., D’Olier-Lees, T. "Key CreditFactors." Standard and Poor’s Solar CreditWeekly 29.42 (2009), 29–30, 49-50. E-article.5Gueymard, Christian A. REST2: highperformance solar radiation model forcloudless-sky irradiance, illuminance, andphotosynthetically active radiation–validationwith a benchmark dataset., Solar Energy, vol.82.3 pp. 272–285, 20086"SSE Release 6.0 Methodology" nasa.gov. National Aeronautics and SpaceThis material is subject to copyright protection, with allAdministration.28 Sept.2010.Allcopyrights retained by2010.VaisalaWeb.and its individualpartners.7rights reserved. Any logos and/or product names are trademarksof Vaisala or its individual partners. The reproduction, transfer,distribution or storage of information contained in this brochurein any form without the prior written consent of Vaisala is strictlyprohibited. All specifications — technical included — are subjectto change without notice.
Appendix: Regional VariationsWorld GHIOverall StatisticsTable A-1. Global GHI comparison statistics for each of the five Vaisala models. All values a
that are more than 25 km away from a ground station.3 Through its acquisition of 3TIER, Vaisala is the first organization, either public or private, to map the entire world's renewable resource potential at resolutions of 5 km or higher, providing a global blueprint for wind, solar, and hydro project development. Vaisala was the first to create


![Humidity101 HumidityTheory.pptx [Read-Only] - Vaisala](/img/46/humidity101-humiditytheorytermsdefinitions.jpg)