Transcription
Skyline Custom and Live ReportsThe Skyline Targeted Proteomics Environment provides informative visual displays of the raw massspectrometer data you import into your Skyline documents. It allows you to work with this data, torefine the peptides and transitions you are measuring and to tune integration boundaries. A rich varietyof calculated values and statistics may be exported from your Skyline document to a tabular commaseparated value (CSV) file perfect for further analysis in tools like Excel and R. The Skyline Results andDocument Grids provide Live access to many of these values and allow you to edit custom annotationsas you work with your data.The first part of this tutorial will focus on Skyline custom reports. You will learn how they can bedesigned, shared and used to export raw values and summary statistics from your Skyline documents.Exported reports can be used in the following ways: Deeper statistical analysis in tools like Excel or RBroader statistical analysis across multiple experiments and/or laboratoriesEnforcing instrument quality control with summary statisticsProviding an input format for other custom build software toolsProviding an import format suited to relational data repositoriesIn developing Skyline we aim to create a vendor-neutral platform for targeted proteomics investigation.Skyline can export similar custom reports for documents populated with the data from Agilent, AB Sciex,Bruker, Thermo-Scientific and Waters instruments. The ability to create consistent reports acrossinstrument platforms greatly facilitates cross-instrument comparisons and large multi-site studies.Understanding how to create custom reports, tailored to your own experiments, is critical and describedin detail in this Skyline custom reports tutorial.The second part of this tutorial will focus on the Results and Document Grid views in Skyline, whichprovide real-time access to many of the data fields available in the custom reports. You will learn tocustomize columns in the Results and Document Grids for immediate access to important values, as youinspect and refine your mass spectrometer output in Skyline. You will also learn to work with customannotations to provide a controlled vocabulary for further interpretation of and human interaction withyour results, which can also be exported in custom reports.Getting StartedTo start this tutorial, download the following ZIP ustomReports.zipExtract the files in it to a folder on your computer, like:1
C:\Users\brendanx\DocumentsThis will create a new w open the Study7 example.sky file in this new folder by double-clicking, or by using Open on theFile menu in a running instance of Skyline.Data OverviewThe dataset in Study7 example.sky is a subset of a study that was performed by the Clinical ProteomicsTechnology Assessment for Cancer (CPTAC) consortium (T. Addona et al “Multi-site assessment of theprecision and reproducibility of multiple reaction monitoring–based measurements of proteins inplasma”, Nature Biotechnology, 2009, 27, 633 - 641). This particular study describes a calibration curveat different concentrations of analyte peptides and a constant spike in level of their correspondingisotope labeled internal standards.The Skyline file displays data from a subset of CPTAC Study 7.2 data (in the paper referred to as “StudyII”) acquired at one CPTAC site. The Skyline file shows data for 10 different peptide sequencesmonitored by LC-MRM-MS with concentrations for the analyte proteins (see light peptides) ranging fromconcentrations at 500 fmol to 2.92 fmol (replicates J: 500 fmol; I: 275 fmol; H: 151 fmol; G: 83 fmol; F: 46fmol; E: 25 fmol; and D: 8.55 fmol – lower concentration points although acquired are not included inthis tutorial). Heavy internal standard (IS) peptides are each spiked in at a concentration of 50 fmol.To get a first impression what this dataset looks like perform the following steps: Click on the ‘HGFLPR’ peptide to highlight it.On the View menu, choose Peak Areas, and then click Replicate Comparisons.A new window appears that shows peak area for each replicate. The blue bars represent the heavylabeled version of this peptide (always spiked in at 50 fmol), and the red bars represent the light analyteat varying concentrations (each concentration point was acquired in technical quadruplicate).Other tutorials describe how you can view and edit documents like this one. For the purposes of thistutorial, however, the Study7 example.sky document has received an initial integration review, fullypreparing if for reports to be exported and used in deeper statistical analysis. Before continuing withthe rest of the tutorial: Close the Peak Areas view.Creating a Simple Custom ReportTo create your first Skyline custom report template, perform the following steps:2
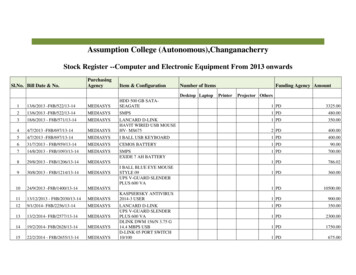
On the File menu, choose Export, and click ReportAn Export Report form will appear that will probably list at least the Skyline default report templatesshown below:Continue creating a new Skyline custom report template by performing the following steps: Click the Edit list button.In the Edit Reports form, click the Add button.In Edit Report form, enter ‘Overview’ in the Report Name field.The form should now look like:3
Expand the field groups Peptides and Replicates by clicking on the ‘ ’ button to see many morefields that can be exported.From the expanded Peptides group click the checkbox next to the PeptideSequence field.The form should now look like:4
Note that the fields in the Edit Report form, shown above, have a distinct hierarchical structure. At thehighest level are the protein specific export fields which are shown at the bottom of the left box(ProteinName, ProteinDescription, ProteinSequence, ProteinNote, and the expanded Replicates groupbelow these that contains the general field ReplicateName). Skyline custom reports also providepeptide specific export fields, contained in the expanded Peptides group at the top of the left box, suchas PeptideSequence and AverageMeasuredRetentionTime among others. The peptide fields include aPeptideResults group, which is not expanded yet. Also unexpanded is the Precursors group, whichcontains precursor specific export fields, a PrecursorsResults group, and finally a Transitions field group.The Transitions group, in turn, contains the transition specific export fields and a correspondingTransitionResults group, containing the most detailed results values, such as Retention Time, Fwhm,StartTime, EndTime, Area and Background, from which many of the higher level results field values arederived .In the Edit Report form continue to add fields to your first custom report template by performing thefollowing steps:5
Expand the Precursors group (located directly below the expanded Peptides group at the verytop) by clicking on the ’ ’ icon.Expand the PrecursorResults group field now visible in the expanded Precursor group.Click the checkbox next to the IsotopeLabelType field from the expanded Precursors group. (Ifnecessary, scroll down or resize the form.)Repeat this procedure to add the following additional fields from the precursorPrecursorResults group to the report template column list:o BestRetentionTime - the RetentionTime value of the transition with the highestmaximum intensity for the particular precursoro TotalArea - the summed Area values of all individual transitions for the particularprecursor (for more information on field values, see Glossary)Check the Pivot Replicate Name check box in the lower left corner of the Edit Report form.This should leave the Edit Report form looking like:6
Click the Preview button in the upper right corner of the Edit Report form.The Preview form should appear looking like:7
The Preview function is quite helpful when designing report templates. At times it may even serve as aquick substitute for exporting a report to a file, since you can select all of the values in the Preview formby clicking the upper-left rectangle. Pressing Ctrl-C, then copies the full report. After which, it can bepasted into another tool, like Excel.The report preview displayed in part above, for replicates 7 2 D 01, and 7 2 D 02, shows precursorBestRetentionTime and TotalArea for all 10 peptides in both their light and heavy form across all LCMRM-MS acquisitions/experiments in the columns to the right. By scrolling to the right, you can seecolumns for all 28 LC-MRM-MS acquisitions. Maximize the Preview form by clicking on the square in itsupper right corner to see more columns. In this example 7 2 D 01, and 7 2 D 02 are taken fromsamples at the same light analyte concentration. Therefore, TotalArea values are expected to be similar.Each letter D through J indicates a different light analyte concentration. Each concentration wasacquired in technical quadruplicate, indicated by numbers 01 through 04. The heavy peptideconcentrations were held constant at 50 fmol in all samples.Close the Preview Report form by clicking on the ‘x’ in the upper right corner to return to the EditReport form again. To save this report template: Click the OK button.You will see the new Overview report template appear in the Report template list.8
Click the OK button again to return to the Export Report form.The new Overview report template is now added to the Skyline report template list. The Export Reportform should now look like:9
From the Export Report form you can now export your new report by selecting ‘Overview’ in the Reportlist and clicking the Export button. For now, click the Cancel button, dismissing all open forms, in orderto start the process from the original Skyline document view.Exporting Report Data to a FileTo export the report you created and previewed above to a CSV file, do the following:On the File menu, choose Export, and click Report. Select ’Overview’ in the Report list of the Export Report.Click the Export button.Enter ‘Overview Study7 example.csv’ in the File name field of the Export Report save form.Click the Save button.If you switch to a Windows Explorer window, showing the CustomReports folder you created for thistutorial, you will see the Overview Study7 example.csv file you just created. Open it now with Exceland confirm that its contents are quite similar to the preview you displayed earlier. Note that the filecontains the column header names, which you cannot get by simply copying and pasting from thepreview form.Sharing Report TemplatesReport Templates in Skyline are very flexible, easy to manage and modify, and share with collaborators.There are many reasons you might want to share a custom report template, whether you areparticipating in a large multi-laboratory study or working with a single collaborator, whether you areproviding the proteomics community with your own custom tool that depends on particular fields fromSkyline documents or providing supplementary information with a manuscript to allow others to repeatyour protocols. The Skyline support for instruments from multiple vendors means your shared reporttemplates can be used to gather data from multiple sites with different instrumentation.To share the Skyline report template you created in this tutorial, perform the following steps: On the File menu, choose Export, and click Report.Click the Share button in the Export Report form.Skyline will present the Save Report Definitions form, as shown below:10
Check ‘Overview’ in the report definitions list.Click the OK button.Enter ‘Overview’ in the File name field of the Save As form.Click the Save button.The report template is saved to the file Overview.skyr in the CustomReports folder created for thistutorial. You could now share it with your collaborators, with your own analysis tool or assupplementary data for a manuscript.Managing Report Templates in SkylineTo gain an understanding of how others would use the custom report template you have now createdand shared, you need to first delete it from your system. Then you can add it back using the sharedreport file Overview.skyr that you created in the previous section, as if you had acquired this sharedtemplate from another source.The Export Report form should still be open after the steps performed in the previous section. Todelete the ‘Overview’ report template from your Skyline settings, do the following: Click the Edit List button.Select the ‘Overview’ item in the Report list of the Edit Reports form.The Edit Reports form should now look like:11
You can use the Up and Down buttons to change the order of the items in the Report list. To move the‘Overview’ item to the bottom of the list, do the following: Click the Down button twice.Click the Up button three times to move the ‘Overview’ item to the top.To remove the ‘Overview’ item from the list, do the following: Click the Remove button.Click the OK button.The Export Report form should now look like:12
Just as when you first brought it up in this tutorial.To demonstrate how your collaborators would import a new report template into Skyline follow thesteps described below: Click the Import button.Select the ‘Overview.skyr’ file you created earlier in the Open form (which should still beshowing the contents of the ‘CustomReports’ folder for this tutorial).Click the Open button.These actions should add an ‘Overview’ item back to the Report list in the Export Report form. To verifythat this is indeed the report you saved, perform the following steps: Select the ‘Overview’ item in the Report list.Click the Preview button.Skyline will present a Preview Report form containing the same values you saw earlier in this tutorial.Modifying Existing Report TemplatesYou can, of course, create much more data rich reports than the simple ‘Overview’ report you firstcreated in this tutorial. You can do this by creating another new report template, by editing yourexisting ‘Overview’ report, or, as shown below, by making a copy of the ‘Overview’ report and editingthe copy. To create a new, more complex report from a copy of the ‘Overview’ report template,perform the following steps:13
Click on Edit List button in the Export Report form.Select the ‘Overview’ item in the Report list.Click on the Copy button.Skyline will present the Edit Report form with the fields from the ‘Overview’ report template alreadyadded, as shown below:The report name for this new report template has not yet been assigned. To assign it now: Enter ’Study 7’ in the View Name field.Continue to add more fields as described below by clicking the checkbox next to each field to add eachfield to the column list for your report template, on the right side of the Edit Report form: Expand the field groups Peptides and Results by clicking the ‘ ’ icons to their left.From the expanded Results group, add the following fields:o FileName – the name of the file from which the data was importedo SampleName – the sample name, if the data was imported from a multi-sample WIFFfile, or the file name again, if noto ReplicateName – the replicate name assigned to the data during importFrom the top level add ProteinName.From the expanded Peptide group, add the AverageMeasuredRetentionTime field – theaverage retention time over all replicates.Expand the Results group in the expanded Peptide group.14
From the expanded peptide Results group, add the following fields:o PeptideRetentionTime – peptide RT for each replicate runo RatioToStandard – area ratio of light to heavyExpand the Precursors group.From the expanded Precursors group, add the following fields:o Charge (displayed in the column list as PrecursorCharge)o Mz (displayed in the column list as PrecursorMz )Expand the Transitions group.From the expanded Transitions group, add the following fields:o ProductChargeo ProductMzo FragmentIon – the fragment ion name (e.g. y8, y10, b7, etc.)Expand the Results group in the Precursors group.From the expanded precursor Results group, add the following fields:o MaxFhwm - the maximum full width at half max (FWHM) of the transitions for theparticular precursoro MinStartTime - elution time start at the baseline of a peak, which will be the same forall transitions (Q1/Q3) from the same precursoro MaxEndTime - elution time start at the baseline of a peak, which will be the same for alltransitions (Q1/Q3) from the same precursorExpand the Results group in the Transitions group.From the expanded transition Results group, add the following fields:o RetentionTime – retention time at the maximum intensity for a transition peako Fwhm – full width at half max for the transition peako StartTime – retention time at the starting transition peak integration boundaryo EndTime – retention time at the ending transition peak integration boundaryo Area – area under the curve (AUC), minus background, for the transition peako Height – maximum intensity for the transition peako UserSetPeak - indicates whether or not (TRUE/FALSE) integration borders for atransition were manually adjustedAlso, uncheck the Pivot Replicate Name checkbox, at the bottom of the form.The report template should now contain a lot more detail than the original ‘Overview’ report template,and the Edit Report form should look like:15
To reorder some fields in this new report template, do the following: Select ProteinName in the column list on the right.Click the up arrow on the far right until the ProteinName field is at the top of the list.You can achieve whatever ordering suits you best, in this way, using the up and down arrow buttons onthe far right, and you can remove fields you may have added by mistake with the red ‘X’ button abovethe arrow buttons. This tutorial, however, will continue without making any further changes to thecolumn list.To preview the values for the current document in the report template you have created, do thefollowing:16
Click on the Preview button.When you have reviewed the data, close the preview form.With data like this, where each peptide has both a light analyte and a matching heavy isotope labeledinternal standard, it may be more convenient to work with the data for these paired precursors all in asingle row to allow you to compare matching transition values more easily.To make this change to the ‘Study 7’ report template, do the following: Check the Pivot Isotope Label check box.Click on the Preview button again to see how the report preview has changed.All of the values for matching light and heavy transitions have been added to the same row. Newcolumns have been added to achieve this, and columns specific to an isotope label type have been giventhe prefixes ‘light’ and ‘heavy’.The Preview form is shown below, scrolled to show the transition between ‘light’ and ‘heavy’ columnnames:You might notice that the column ‘heavy IsotopeLabelType’ shows ‘heavy’ on every row, and that thereis also a column ‘light IsotopeLabelType’ which shows ‘light’ on every column. When you are pivoting ona column, it does not add much to include it in your column list. Close the Preview form, and do thefollowing to remove the ‘IsotopeLabelType’ field from this report: Select ‘IsotopeLabelType’ in the column list on the right.Click the red ‘X’ button on the far right edge of the column list.17
You can click the Preview button again to verify that both the ‘light IsotopeLabelType’ and the ‘heavyIsotopeLabelType’ columns have been removed. The next step in this tutorial, however, is to save yourwork by doing the following: Click the OK button in the Edit Report form.Click the OK button in the Edit Reports form.This will return you to the Export Report form, which should now look like:From here, you could now continue to export the new ‘Study 7’ report to a CSV file by selecting it andclicking the Export button, or click Share button to create file for sharing this new report. For thistutorial, however, click the Cancel button to return to the ‘Study7 example’ document.Quality Control Summary ReportsSo far you have created reports based on the values Skyline offers for each imported replicate of thepeptides and transitions specified in a document. Skyline also provides report fields with summarystatistics across all imported replicates. These summary fields are particularly suited to quality controlby ensuring that replicate QC runs show good reproducibility and coefficients of variation (CV). Skylinereport templates can be designed with mean values and CV over all replicates for key parameters, suchas peak area, FWHM and retention time.This tutorial provides a summary report template that you will import into Skyline, but it also describeshow to design such a summary report template in the Edit Report form.To get started, first open a new document by doing the following:18
On the File menu, click Open.Navigate to the ‘CustomReports’ folder you created for this tutorial. (may not be necessary)Select the ‘Study9pilot.sky’ file.Click the Open button.This file contains data acquired by one CPTAC site over 5 LC-MRM-MS runs, injecting 10 analyte peptidesat a constant concentration of 50 fmol over all 5 runs. Such a dataset could potentially be used to assessreproducibility of replicate injections. In this part of the tutorial you will begin working with LiveReports, using the report to navigate around the document. To do this you will use the Document Gridfunctionality instead of Export Report.To view the data for key quality control metrics follow the steps below: On the View menu, choose Document Grid.At the top of the Document Grid form, click the Views button. A dropdown list will appear.Choose Manage Views from the dropdown list.Click the import button in the Manage Views formSelect the Summary stats.skyr file from the ‘CustomReports’ folder in the Open form.Click the Open button.A new view named ‘Summary Statistics’ should have been added to the View list, and the ManageViews form should now look like:Click OK to dismiss the Manage Views form.19
Then, on the Document Grid form, click the Views button and choose Summary StatisticsAfter you choose Summary Statistics, the document grid should look like the following:This report shows that the data in Study9pilot.sky, taken from 5 replicate injections of the same sample,produce peptide CV values for FWHM mostly below 5% and TotalArea in most cases under 10% asindicated for the corresponding columns with red boxes. In addition, the column called20
RangeBestRetentionTime (red box) lists the RT drift in minutes for any specific peptide over the 5replicate injections. In this case there is only minimal RT drift ( 0.15 min, 10 sec).These summary reports can be used to flag quality control issues early, before they impact dataacquired on important samples. In this particular dataset, HPLC and MS seem to behave acceptably. Inone case, however, for the peptide INDISHTQSVSAK (from protein LEP), the CV value for TotalArea is59.2% and for FWHM is 23.5% (circled in red), significantly differing from the CV values of all the otherpeptides.You can add a filter to this view so that only rows matching specific criteria are shown by doing thefollowing: Choose Edit View from the Views dropdown.In order to find the CvTotalArea column in the tree view on the left, double click on that columnin the list on the right.The Customize View form should look like:To define a new filter on this view: Click the Filter tab. The CvTotalArea column will still be selected in the tree view on the left.Click the Add button to add that column to the list of filters.21
Set the Operation to Is Greater ThanIn the Value column, enter ‘.2’.The Customize View form should look like:Note that even though the CvTotalArea column is displayed as a percentage in the Document Grid, onthe filter tab, the number “20%” is represented as “.2”. Click the OK button on the Customize View form to see the rows matching this filter.22
To inspect this peptide more closely, do the following: Close the Document Grid by clicking the red X in the upper right corner.Select the peptide ‘INDISHTQSVSAK’ in the peptide tree view.On the View menu, choose Peak Areas, and click Replicate Comparison (F7).23
The Peak Areas view, showing the total peak area and the contribution of each transition for all 5replicates, help clarify the problem that was indicated in the CV values of the summary report preview.For comparison, select several of the other peptides. The Peak Areas view will show much better peakarea reproducibility, as indicated by their much lower TotalArea CV values in the summary reportpreview, where the majority of the peptides had CV values 10%.Skyline summary reports can be used with quality control data to flag issues early, while Skyline itselfprovides powerful visual displays to help get to the root of the problem quickly.Results Grid ViewIn some cases, you may want to see some of the values presented in reports while you are editing thedata, for immediate access to raw values displayed in the Skyline charts. The Skyline Results Grid viewprovides real-time access to many of the data fields available in the custom reports. In the final sectionsof this tutorial, you will learn to use the Results Grid to gain immediate access to important values andto annotate your data to capture important human insights, as you inspect and refine your massspectrometer output in Skyline.To get started using the Result Grid view, do the following: On the View menu, click Results Grid (Alt-F2).24
Skyline should now look something like this:Now rearrange the windows for better viewing, by doing the following: Click the Results Grid caption and drag it to the bottom edge of the main window to dock it.Click the Peak Areas caption and drag it to the right edge of the main window to dock it.Click and drag the splitters between the various window panes to adjust the space allocation.On the View menu, choose Auto-Zoom, and click Best Peak, if it is not already selected.Select the precursor element ‘467.2440 ’ below the currently selected peptide.This should leave Skyline looking something like:25
Skyline keeps its charts and the Results Grid in synch as you navigate the data. If you click on one of theother rows in the Results Grid, Skyline changes the active chromatogram replicate tab. It also changeswhich bar in the Peak Areas graph has the selection rectangle around it, as well as the selection in theReplicates list above the peptide tree view. Now click on a different chromatogram chart tab, bar in thePeak Areas chart, or change the selection in the Replicates list. The other views will update, includingthe selected row in the Results Grid.The first column to the right of the Replicate column in the Results Grid is the PrecursorReplicateNote.This column allows you to associate a free text note with the PrecursorResults field group for theselected precursor and replicate. Type ‘Low signal’ in the first row with replicate name ‘Rep1’ for the currently selected peptide.The Results Grid should now look like:26
All of the other columns in the current Results Grid display are calculated by Skyline and cannot beedited, but you can change which columns get displayed and in what order. Several of the columns arescrolled out of view in the image above. To reduce the number of precursor results columns beingdisplayed, do the following: From the Views dropdown at the top of the Results Grid, choose Edit ViewOn the Customize View form, for each of the columns Min Start Time, Max End Time, andLibrary Dot Product, click on the column name in the list box, and then click on the X button tothe right of the list box.Click the OK button.You can now review the results for other precursors by doing the following: Click in the peptide tree view.Use the up and down arrow keys to change the selection to other precursor elements.Finally expand a precursor and review its transitions. You could apply the same technique to customizethe columns being displayed for transitions. Instead, continue now to the final section in this tutorial tolearn how to add a custom annotation that you can control with the Results Grid, and later export in aSkyline report.Custom AnnotationsSkyline supports three types of custom annotations:1.2.3.4.Free text (similar to the Note which is available by default on all types)NumberTrue/FalseValue listThe last two types can be used to collect information in a controlled vocabulary, as you process yourdata, which can later be exported in a Skyline report and used as input for programmatic statisticalanalysis.27
To define a simple new True/False annotation, perform the following steps: On the Settings menu, click Annotations.Click the Edit List button on the Annotation Settings form.Click the Add button on the Define Annotations form.Type ‘Tailing’ in the Name field on the Define Annotation form.Select ‘True/False’ in the Type field.Check the Precursor Results checkbox in the Applies To list.The Define Annotation from should now look like:Now finish defining the annotation and add it to your document by doing the following: Click the OK button on the Define Annotation form.Click the OK button on the Define Annotations form.Check the checkbox for the new ‘Tailing’ annotation.The Annotation Settings form should now look like:28
Click the OK button.Select the second to last precursor element ‘564.7746 ’ for the peptide ‘ESDTSYVSLK’.The new Tailing column will not have been added to the custom view in the Results Grid, but you canadd it: Choose Edit View from the Views dropdown at the top of the Results Grid.In the list view on the right, click on the third column down (“PrecursorPeakFoundRatio”). Thiswill affect where in the list new columns get added.Click the checkbox next to Tailing at the bottom of the tree view on the left.The Customize View form should now look like t
3 On the File menu, choose Export, and click Report An Export Report form will appear that will probably list at least the Skyline default report templates shown below: Continue creating a new Skyline custom report template by performing the following steps: Click the Edit list button. In the Edit Reports form, click the Add button. In Edit Report form, enter ZOverview in the Report Name field.