Transcription
Survival at SeaA.B.C.D.E.F.G.Average Marine MortalityLife Cycles of specific populationsSize-SurvivalVariation among yearsOcean – UpwellingLong-term TrendsPredators
Average percent marine survival for wild populationsSpeciesAverage survival %
25Wild Chilko Lake sockeye 19761979Chilko smolt - adult survivalIn any population, there is considerablevariation in marine survival
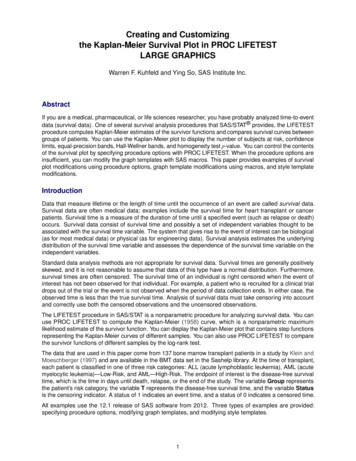
Stage-specific mortality and the dynamicsof Fraser River chum salmonAdultsFemalesEggs per femaleFryEgg to fry survivalAdultsFry to adult survivalReturn per .19%2.16Beacham and Starr. 1982. Fishery Bulletin 80: 813-825
Stage-specific mortality of wild LewisRiver chinookEggs per femaleEgg to fry survivalFry per femaleFry to smolt survivalSmolts per femaleSmolt to adult survivalAdults per femaleEscapementReturning spawners per femaleMcIsaac, D.O. PhD thesis. University of Washington5,12265.3%3,34510.05%3362.38848.8%3.9
Stage-specific mortality of Bella Coolapink salmonLife history stageFry *1st 40 daysfinal 410 daysFishing *50% females *2,000 eggs/female *Egg to fry 0003,150,000472,500236,250472,500,00060,000,000* Hypothetical values assumed to balance the cycleR.R. Parker. 1968. J.F.R.B.C. 25: 757-794
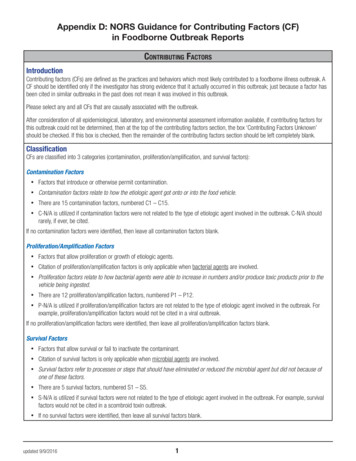
030201001591317Months at sea2125Number of salmonWeight (g)Mortality should be is highest on small salmon, soon after theyenter the ocean. As they grow, mortality rates are assumed todecrease (e.g., Karluk Lake sockeye salmon: Ricker 1976).
Estimates of average daily mortality of unfedchum salmon fry from Southeast Alaska% mortality per day(Wertheimer and Thrower 2007 AFS Symposium 406080Number of days at large100
Estimated mortality rate of Columbia River andcoastal Oregon coho salmon (1982-1985)DateDays at sea Millions of % mortality % mortalityper periodsalmonper dayMay 1035.24June 17478.502.9275.9Sep 111333.870.9154.5Sep 14881.110.3571.3William Pearcy and Joseph Fisher, Oregon State University
What controls the survival ofsalmon at sea? Attributes of the fish–––––speciessizeentry pointwild vs. hatchery rearedmigration date Attributes of the environment Predators
Smolt size and variation in marine survival among species% marine chumchinook0050100150Smolt length (mm)200250
Geographic variation in marine survival ofwild coho salmonRegionSE AlaskaN British ColumbiaS British ColumbiaPuget SoundWA coastSiteAuke Cr.Berners R.Hugh Smith L.Taku R.Lachmach R.Zolzap Cr.Black Cr.Salmon R.Big Beef Cr.Deschutes R.Queets R.Bingham Cr.Years1980 - 20041990 - 20041984 - 20041992 - 20041988 - 20031993 - 20041986 - 20041987 - 20041979 - 20031980 - 20041982 - 20031983 - .54.4Shaul et al. 2007 NPAFC Bull. 4: 93-104
Interaction between smolt size and latitudeon survival of sockeye salmon: Bigger isbetter, and northerly populations do betterSmolt sizeSouthMiddleNorth( 55 N)(56–60 N)( 60 N)Small (71-76 mm)5.916.717.7Medium (97 mm)12.625.132.0Large (134-139 mm)17.137.039.1(Koenings et al. 1993)
Salmon smolts vary insize among years.Does size affect theirlikelihood of survival?Example:Chilko Lakesockeye salmon:length distributionsamong yearsHenderson and Cass. 1991. CJFAS.
1020Chilko Lakesockeye salmon0Survival (%)30Mean smolt fork length was not related to marinesurvival variation among years728292Mean length (mm)102
Salmon smolts vary insize within years.Does size affect theirlikelihood of survival?Chilko Lakesockeye salmonHenderson and Cass. 1991. CJFAS.
Fish LengthGrowth HistoryIndividual circuliScale Radius
Fork Length (cm)Relationship between fish length andscale radius10090807060504030201000Ishida and Mathews 1989.1234Scale Radius (mm)5
15Year 1510Year 20Survival (%)20Within a year, larger Chilko Lake sockeye salmonsmolts were more likely to survive than smaller ones708090Length (mm)100
Size was related to survival ofhatchery ocean-type Chinooksalmon between hatcheries,but not among yearsSiteWeight% survivalUW12.92.2Soos5.30.814chinook% marine survival12SoosUW1086420051015Smolt weight (g)2025
So, body size does not strongly affect survivalamong years, but it does seem to play a role invariation in survival within years.But, for a hatchery to release larger fish, theymay hold them longer. What is the interactionbetween size and release date in controllingsurvival of salmon going to sea in a given year?
Survival of coho salmon from three sizegroups, differing from each other by 5 gRelease date affectedsurvival more thansize. Why?15Marine survival (%)small129mediumlargeSmolt physiology?Ocean conditions?63020-Apr10-MayBilton et al. 1984; Morley et al.1988. Quinsam River Hatchery.30-MayDate of release19-Jun
Other evidencethat date may playa large role insurvival at sea.Survival of Chinooksalmon from theColumbia River declinedlater in the season,though the patternsvaried among years(Scheuerell et al. 2009).
Average survival of hatcherycoho (20 populations)In a given year, wild and hatchery survival rateswere correlated, but wild coho salmon hadconsistently higher survival rates in Washington(Beetz 0.10.150.2Average survival of wild coho (5 rivers)0.25
Sometimes there are trends in survival (e.g., streamtype Chinook salmon smolts from the Snake River.(Raymond 21970196801966% smolt to adult return7
Washington coho salmon also show trends overtime, and the superior performance of wild fishProportion surviving at sea0.25Wild0.20Hatchery0.150.100.050.001970Beetz 20091975198019851990199520002005
For a long time, many salmon biologistsviewed the ocean as:1) Not limiting salmon production2) Not changing in any important ways3) Not knowable anywayBut, in the early 1980s, variation in marinesurvival made people re-think all this
6420Post-smoltsurvival (%)81012Marine survival of Oregon hatchery coho salmon waspositively related to an index of upwelling off the coast0100200300400Upwelling500S. Mathews (1984)
Comparison of pink salmon caught in the Gulf ofAlaska with coho catches in Washington, Oregonand California (Francis and Sibley, updated)WA, OR, CA coho salmon1008065Gulf of Alaskapink salmon4603402201001930 1940 1950 1960 1970 1980 1990Coho salmon (millions)Pink salmon (millions)120
Pink salmon catches in central and southeast Alaska seem tofollow winter temperatures (November - March airtemperatures in Sitka, southeast Alaska).temperature120pink 19501960197019801990Millions of salmonWinter air temperature4.0
We now understand that climate and ocean conditionsare linked. There are “regimes” that favor salmon inone part of the range but not othersHigh survival rates in thenorth, low in the southHigh survival rates in thesouth, low in the north
Catches (1000s) of salmonCommercial catches of all salmon speciesin Alaska250,000200,000(Alaska Dept. of Fishand Game data)150,000100,00050,000019001925195019752000
All nations, pink, chum, andsockeye catchNoakes et al. 1997. NPAFC Bull.
Yes, but what do the fish actually die of?Presumably, the proximate cause of death isnormally predation, though the fish may beweakened by disease, lack of stored energy, orpoor seawater adaptation, and the vulnerability topredation may be extended if growth is slow.But, who eats them?There is no coastwide “enemy of salmon” butrather losses to many different species, dependingon the size of the salmon and the region. Overall,little progress has been made on this issue.
Predators: Are harbor seals (for example)a significant predator on salmon? How many seals are there? 12,990prior to pupping and 15,810 afterwards. How much fish do they eat? 1.9 kg or4.3% body weight per day per seal What is the composition of their prey?(Olesiuk 1993)Mostly Pacific hake fromApril to November andmostly Pacific herringfrom December to Marchin the Strait of Georgia
Harbor seal diet in the Strait of Georgia, B. C.speciesPacific hakePacific herringPacific salmonMidshipmanLingcodOtherTotaltonnes % of 2100%
Estimated mean smolt fork length of Chilko Lakesockeye salmon as outmigrants and surviving adultsYearOutmigrantsAdultsProbability197181.7 (294)82.3 (291) 0.05197688.8 (194)89.2 (280) 0.05197795.7 (192)97.3 (292) 0.01In general, fish that survived to adulthood hadbeen larger as smolts than those that died, in agiven year (Henderson and Cass 1991).
Life History 226835536438717214131648 287636542878540149231197egg size (mg)190290130220300150110egg to fry 170.100.14female length (mm)fecundityfry size (mm)fry to smolt survivalsmolt size 25.25.115.712.56.425.5egg to smolt survival0.020.020.100.01adults per female10.25.417.59.2smolt to adult survivaladults per female
Sockeye salmon marine survivalSmolt to Adult Survival (%)Koenings et al. 1993 CJFAS5030201053217090 110 130 150 170Mean Smolt Length (mm)
survival of salmon going to sea in a given year? Survival of coho salmon from three size groups, differing from each other by 5 g . 0 3 6 9 12 15 20-Apr 10-May 30-May 19-Jun. Date of release Marine survival (%) small medium large. Bilton et al. 1984; Morley et al. 1988. Quinsam River Hatchery. Release date affected

![[ST] Survival Analysis - Stata](/img/33/st.jpg)