Transcription
Pipeline Risk Assessment/ManagementMini-Workshop
MeetingThe Basics – PL Risk ManagementObjective:Understand the essential elements of an effective pipeline risk assessment and itsrole in risk managementweightingsAgenda- Background- Regulations/standards- Risk Assessment- What to look for- Essential Elements- Risk Mgmt Implications2
Mayflower, AR 2013
Kalamazoo River, 201010ft creekPoF: 1/1000yrCoF: 1BExpected Loss: 1M/yr/10ft! 1,000,000,000 spent
Overall Example
Overall Example
Overview Data Collectionbeg08180150570How to segment?end818201520572020eventcodepipe wallpipe wallpipe smpympy /event /event /event% effective
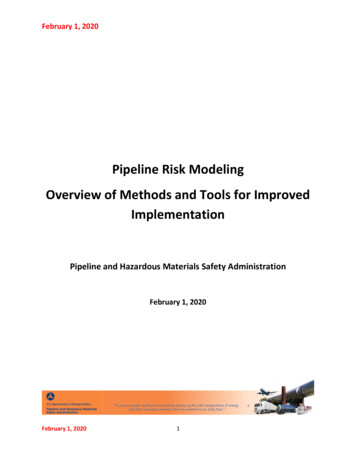
Overview Risk Calcsbeg05781518end578151820pipe wall0.250.250.250.50.50.25CoF popTTF pipe wall / mpy mitPoF 1 / TTFEL PoF x CoFsoil55551010pop mpy mit TTF, yrs PoF, yr1 EL, /yr100000.55000.002 201000000.55000.002 200100000.55000.002 20100000.510000.001 101000015000.002 201000012500.004 400.013 310coat/CP 90%
Overall Example1.3% PoF Corr Ext for 20 kmEL 310 / yearDemonstrations ofCenterlinesEfficient data collectionData managementDynamic segmentationRisk estimatesRisk aggregationHigh tech on a ‘scratch pad’
Background10
Reality Check RM is not new; requires RA Risk-based decision-making is complex- Because the real world is complex, measuring risk iscomplex- 200 variables & 200 calculations for every inch of pipe- real factors, real considerations- RM is even more complex than RA Dealing with the complexity is worthwhile-increases understandingshows full range of options; many opportunities to impact riskcheaper than prescriptive ‘solutions’Improves decision-making
Reality Check, Part TwoIf you put tomfoolery into a computer, nothing comes outof it but tomfoolery. But this tomfoolery, having passedthrough a very expensive machine, is somehowennobled and no-one dares criticize it.- Pierre GalloisThe Illusion of Knowledge
IMP RA Regulations & Standards13
Pertinent Regulatory/Standards 49 CFR Parts 192, 195 ASME B31.8s Advisory Bulletin (Jan 2011) API STANDARD 1160- Managing Pipeline SystemIntegrity Public Presentations (June2011) API Risk Based Inspection(RBI) RP’s NACE DA RP’s CSA Z662- Annex O ISO14
RA is the Centerpiece of IMP1-Call /Public AwarenessCorrosionManagementILI AnalysisIntegrity AssessmentScheduleGIS Public DomainPipelineConstructionP&MField ak Detection15
Gas IM Rule Objectives Prioritize pipeline segments Evaluate benefits of mitigation Determine most effective mitigation Evaluate effect of inspection intervals Assess the use of alternative assessment Allocate resources more effectivelyASME B31.8S, Section 5
Gas IM Rule RA Account for relevant attributes Use conservative defaults for unknown data Identify significant risk-driving factors Sufficient segment discretization or resolution Predictive or “what-if” capability Updateable to reflect changes or new information Populating risk model is resource intensive Validate model, show to be plausible with respect to knownhistory and significance of threatsASME B31.8S, Section 5
B31.8S Threat Categories ASME B31.8 supplement considers 3 categories ofthreat:- Time dependent – may worsen over time; require periodicreassessment- Time stable – does not worsen over time; one-timeassessment is sufficient (unless conditions of operationchange)- Time independent – occurs randomly; best addressed byprevention
Threat Categories: Time Dependent Threats External corrosion Internal corrosion Stress-corrosion cracking (SCC)
Threat Categories: Time Independent (Random) Threats Third-party/Mechanical damage- Immediate failure- Delayed failure (previously damaged)- Vandalism Incorrect operations Weather related- Cold weather- Lightning- Heavy rain, flood- Earth movement
Threat Categories:Time Stable Threats Resistance Manufacturing-related flaws in- Pipe body- Pipe seam Welding / Fabrication-causedflaws in- Girth welds- Fabrication welds- Wrinkled / buckled bend- Threads / couplings Defects present in equipment- Gaskets, O-rings- Control / relief devices- Seals, packing- Other equipment
ASME B31.8s Subject Matter Experts Relative Assessments Scenario Assessments Probabilistic AssessmentsConfusion: tools vs models
IMP Objectives vs RA TechniquesObjectives(a) prioritization of pipelines/segments for scheduling integrity assessments and mitigating action(b) assessment of the benefits derived from mitigating action(c) determination of the most effective mitigation measures for the identified threats(d) assessment of the integrity impact from modified inspection intervals(e) assessment of the use of or need for alternative inspection methodologiesTechniques(f) more effective resource allocation Subject Matter ExpertsRelative AssessmentsScenario AssessmentsProbabilisticAssessmentsNumbers Needed Failure rate estimates for each threat on each PL segment Mitigation effectiveness for each contemplated measure Time to Failure (TTF) estimates (time-dep threats)
PL RA MethodologiesIndex/Scoredepth covershallow 8 ptswrinkle bendyes 6 ptscoating condition fair 3 ptssoilmoderate 4 pts24
PL Risk Modeling ConfusionTypes of Models- Absolute Results- Relative ResultsIngredients in All Models- Probabilistic methods- Scenarios, trees- Statistics- SME (input and validation)ASME B31.8s Subject Matter Experts Relative Assessments Scenario Assessments Probabilistic eProbabilistic
Absolute Risk ValuesMeasure inVerifiableUnitsFrequency of consequence- Temporally- Spatially Incidents per mile-year fatalities per mile-year dollars per -yearmpy corrosionmpy crackingTTF pipe wall / mpy% reduction in events/mi-yr% reduction in mpy% damage vs failure
ASME B31.8S Summary of Updates Needed The stated objectives of risk assessment cannot be effectively accomplished usingsome of the risk assessment techniques that are currently acceptable according toASME B31.8s. The ASME B31.8s threat list confuses failure mechanisms and vulnerabilities. The ASME B31.8s methodology discussion confuses risk models withcharacteristics of risk models or tools used in risk analyses. The use of weightings is always problematic, rarely appropriate, but appears to bemandated in inspection protocols based on ASME B31.8S language.27
Inspecting a Risk Assessment28
Easy to Spot (and Correct!) Methodology Weaknessesweightings
What does that mean?30
Hazard ID & Risk Analyses Tools Scenarios Event / fault trees Safety reviews / Checklists Matrix What-if analysis FMEA PHA, HAZOPS LOPA
Judging a Risk Assessment “Technically justifiable . . .” “Logical, structured, and documented .” “Assurance of completeness ” “ incorporates sufficient resolution ” “Appropriate application of risk factors .” “Explicitly accounts for ” and combines PoF and CoFfactors “Process to validate results ” P&M based on risk analyses
Passing the ‘Map Point’ TestRisk Profiles
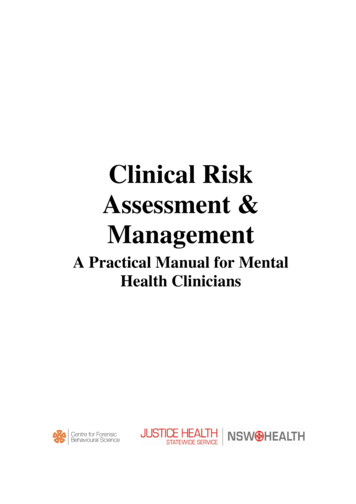
Receiver Operating Characteristic (ROC) Curvestatistical perspectivefalse positivefalse negativetrue positivetrue negativemanagementperspectivefalse alarmmissed alarmactual alarmno alarmcan you tolerate 20% FP in exchange foronly missing one in one-hundred?public perspectivecrying wolfwolf in sheep's clothingwolf in plain sightno wolf
PHMSA Concerns
Relative, Index, Scoring Models Intuitive Comprehensive Ease of setup and use Optimum for prioritization Mainstream Served us well in the past
Scoring Model Issues Artificial, inefficient layer Not designed for IMP Difficult to anchor Potential for masking Technical compromises- Weightings- Scale direction- Interactions of variables (dep vs indep) Validation (reg reqmt) New uses
HearsayCommon Complaints:“We’ve been waiting for two years to start generating results we cantrust”“We have a risk assessment, but we can’t use the results foranything”“We purchased a sophisticated off-the-shelf solution, but we’re notreally sure how it calculates risk”“Our risk assessment methodology was developed internally agesago, how do we know if it’s still acceptable?”38
Myths: Data Availability vs Modeling RigorMyth: Some RA models are better able to accommodate low data availabilityReality: Strong data strong model accurate results Weak data strong model uncertain results Weak data weak model meaningless results39
Myth: QRA / PRA RequirementsMyth: QRA requires vast amounts of incident historiesReality: QRA ‘requires’ no more data than other techniques All assessments work better with better information Footnotes:- Some classical QRA does over-emphasize history- Excessive reliance on history is an error in any methodology40
Risk Assessment Maturity41
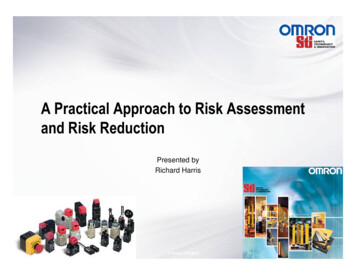
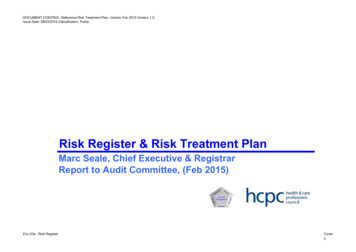
Modern RA Modeling Approach High resolution Measurements instead of scores Accurate/Appropriate mathematicalrelationships Direct use of inspection results Ability to express results in absolute terms
Modern Pipeline Risk AssessmentPoF (len adjusted)14012080PoF (unitized)604012.0%2010.0%8.0%06.0%0.0000. 010000. 0400000. 7000. 0 10000. 130000. 160000. 190000. 220000. 250000. 000080000station100000120000140000
Essential Elements44
Essential Elements The Essential Elements are meant to- Be common sense ingredients that make risk assessment meaningful, objective, andacceptable to all stakeholders- Be concise yet flexible, allowing tailored solutions to situation-specific concerns- Lead to smarter risk assessment- Avoid need for ‘one size fits all’ solutions- Response to stakeholder criticisms- Stepping stone towards RP The elements are meant to supplement, not replace, guidance, recommendedpractice, and regulations already in place The elements are a basis for risk assessment certifications www.pipelinerisk.net45
The Essential ElementsMeasurements in Verifiable UnitsProper Probability of Failure AssessmentCharacterization of Potential ConsequencesFull Integration of Pipeline KnowledgeSufficient GranularityBias ManagementProfiles of RiskProper Aggregation46
Measure in Verifiable UnitsMeasure inVerifiableUnitsProbability ofFailureGrounded e ofFailureProfile the fficientGranularityControl the BiasUnmaskAggregation Must include a definition of “Failure” Must produce verifiable estimates of PoF and CoF incommonly used measurement units PoF must capture effects of length and time Must be free from intermediate schemes (scoring, pointassignments, etc)“Measure in verifiable units” keeps theprocess transparent by expressing riskelements in understandable terms thatcan be calibrated to reality
Measure inVerifiableUnitsVerifiable Risk ValuesIndex/Scoredepth covershallow 8 ptswrinkle bendyes 6 ptscoating condition fair 3 ptssoilmoderate 4 ptsRisk Frequency of consequence- Temporally- Spatiallyevents/yrevents/mile-yearmpy corrosionmpy crackingTTF pipe wall / mpy% reduction in events/mi-yr% reduction in mpy% damage vs failure Incidents per mile-year fatalities per mile-year dollars per km-decadeconseqprob
Why measurements instead of scores?Measure inVerifiableUnits Less subjective Anchored in ‘real world’ (incl orders magnitude, OR gates, etc) Defensible, verifiable over time Avoids need for ‘cook book’ Avoids erosion of score definitions Allows calculation of costs and benefits Supports better decisions Auditable
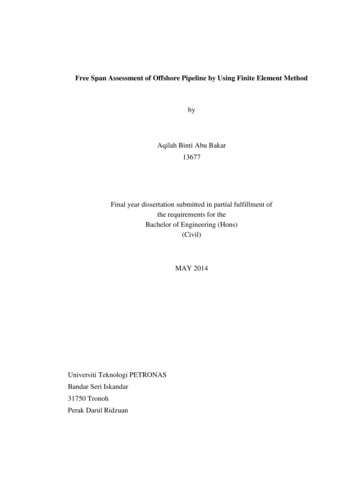
Probability of Failure Grounded in Engineering PrinciplesMeasure inVerifiableUnitsProbability ofFailureGrounded eof FailureProfile theRisk ientGranularityControl theBiasUnmaskAggregation All plausible failure mechanisms must be included in theassessment of PoF Each failure mechanism must have the following elementsindependently measured:- Exposure- Mitigation- Resistance For each time dependent failure mechanism, a theoreticalremaining life estimate must be produced
Proper PoF CharacterizationProbability ofFailure Groundedin EngineeringPrinciples Exposure: likelihood and aggressiveness of a failure mechanism reachingthe pipe when no mitigation applied (ATTACK) Mitigation: prevents or reduces likelihood or intensity of the exposurereaching the pipe (DEFENSE) Resistance: ability to resist failure given presence of exposure(SURVIVABILITY)
Information Use--Exposure, Mitigation, orResistance?pipe wall thicknessmaintenance piggingair patrol frequencysurge relief valvesoil resistivitycasing pipecoating typeflowrateCP P-S voltage readingdepth coverdate of pipe manufacturetrainingstress levelSMYSoperating proceduresone-call system typenearby traffic type and volumeSCADAnearby AC power lines (2)pipe wall laminationILI date and typewrinkle bendpressure test psig
PoF: Critical Aspects
Probability of Damage or Failure—Simple MathProbability ofFailure Groundedin EngineeringPrinciples Probability of Damage (PoD) exposure x (1 - mitigation) Probability of Failure (PoF) PoD x (1- resistance){PoF exposure x (1 - mitigation) x (1 - resistance)} PoF (time-dependent) 1 / TTF exposure * (1 – mitigation) / resistance (example only)ExposureMitigationResistancePoDPoF
Estimating Threat ExposureProbability ofFailure Groundedin EngineeringPrinciples Events per mile-year (km-yr) for time independentmechanism- third party- incorrect operations- weather & land movements MPY (mm/yr) for degradation mechanisms- Corrosion (Ext, Int)- Cracking (EAC / fatigue)
List the Exposures
Example: Exposures Offshore RAPipelines; shipping lanes; known exposures; past seismic events
Sample Exposure Estim
ASME B31.8s. The ASME B31.8s threat list confuses failure mechanisms and vulnerabilities. The ASME B31.8s methodology discussion confuses risk models with characteristics of risk models or tools used in risk analyses. The use of weightings is always problematic, rarely appropriate, but appears to be