Transcription
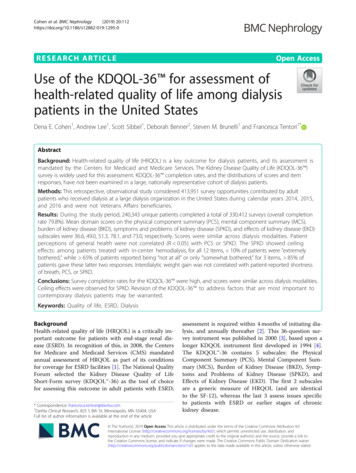
(2022) 22:162Amin et al. BMC Endocrine wOpen AccessRESEARCHAssessment of quality of life and itsdeterminants in type‑2 diabetes patients usingthe WHOQOL‑BREF instrument in BangladeshMohammod Feroz Amin1*, Bishwajit Bhowmik2, Rozana Rouf3, Monami Islam Khan1, Syeda Anika Tasnim4,Faria Afsana1, Rushda Sharmin1, Kazi Nazmul Hossain1, Md. Abdullah Saeed Khan5, Samiha Mashiat Amin6,Md Shek Sady Khan7, Md Faruque Pathan8 and Mohammad Jahid Hasan5*AbstractBackground: Diabetes mellitus (DM) is rising at a rapid rate worldwide. As a chronic, incurable metabolic disease,diabetes affects a person’s life in all ways. Studies thus far have focused on the impact of diabetes on the physical andmental health of persons affected by the quality of life (QoL). This study aimed to explore the whole range of QoLdeficits using the World Health Organization Quality of Life brief version (WHOQOL-BREF) in type-2 diabetic patients.Methods: This cross-sectional study was carried out among individuals aged at or above 15 years with type 2 diabetes (T2DM). Patients with prior mental health illness and unwillingness to give consent were excluded. A pretestedstructured questionnaire including the 26-item WHOQOL-BREF questionnaire was used for face-to-face interviews.Appropriate ethical measures were ensured. All statistical analyses were carried out using the statistical softwareSTATA (Version 16.1). Graphs were created using R (Version 4.0.0).Results: A total of 500 T2 DM patients with a mean age of 55.8 13.2 years ( SD) and a female proportion of 50.8%were included. Overall, 22.2% of participants rated their QoL as poor, and 25% were dissatisfied with their health (asassessed by questions 1 and 2 of the WHOQOL-BREF questionnaire). More than half (54% and 51.2%, respectively) hadan average evaluation of their QoL and health. The QoL scores were below average, with mean scores ( SD) for thephysical health, psychological, social relationship, and environmental domains of 37.2 20.5, 44.2 21.0, 39.6 23.2,and 41.6 19.5, respectively. Multiple regression analysis revealed that the patient’s level of education and monthlyfamily income were significant positive modifiers and that complications (nephropathy, retinopathy, and peripheralartery disease) were significant negative determinants of the QoL score in different domains.Conclusion: This study found the overall quality of life among T2DM patients below average. Health authorities andclinicians should take these findings into account and incorporate necessary measures to ameliorate negative modifiers of the quality of life of sufferers.Keywords: Quality of life, Type-2 diabetes mellitus, WHOQOL-BREF, Diabetic complications*Correspondence: feroz amin@yahoo.com; dr.jahid61@gmail.com;jahid@pircc.org1Department of Endocrinology, BIRDEM General Hospital, Dhaka 1000,Bangladesh5Pi Research Consultancy Center, Dhaka 1211, BangladeshFull list of author information is available at the end of the articleBackgroundType 2 diabetes mellitus (T2DM) is one of the four majornon-communicable diseases (NCDs) rising at a rapidrate and causing a significant burden around the world[1, 2]. Global burden of disease estimates suggests thatapproximately 6.3% of the world’s population suffers from The Author(s) 2022. Open Access This article is licensed under a Creative Commons Attribution 4.0 International License, whichpermits use, sharing, adaptation, distribution and reproduction in any medium or format, as long as you give appropriate credit to theoriginal author(s) and the source, provide a link to the Creative Commons licence, and indicate if changes were made. The images orother third party material in this article are included in the article’s Creative Commons licence, unless indicated otherwise in a credit lineto the material. If material is not included in the article’s Creative Commons licence and your intended use is not permitted by statutoryregulation or exceeds the permitted use, you will need to obtain permission directly from the copyright holder. To view a copy of thislicence, visit http:// creat iveco mmons. org/ licen ses/ by/4. 0/. The Creative Commons Public Domain Dedication waiver (http:// creat iveco mmons. org/ publi cdoma in/ zero/1. 0/) applies to the data made available in this article, unless otherwise stated in a credit line to the data.
Amin et al. BMC Endocrine Disorders(2022) 22:162T2DM, with an expected rise in the coming years [3].Like other countries around the globe, Bangladesh is alsoseeing an alarming increase in the prevalence of T2DM.A recent meta-analysis estimated a pooled prevalence ofT2DM of approximately 7.8% in the general populationin the country [4]. The high burden of T2DM threatensindividuals’ QoL and existence.T2DM is a chronic metabolic disease, the treatment ofwhich is based primarily on lifestyle modification, exercise,and pharmacological agents [5]. The disease runs a chroniccourse and may lead to different micro- and macro-vascular complications [6]. In addition, patients are frequentedby acute complications, including hypo- or hyperglycemicevents, often requiring hospital admissions. Hypertension,obesity, and hyperlipidemia are the most frequent comorbidities in diabetic patients [7]. Additionally, T2DM hasan evident relationship with many psychiatric illnesses,particularly depressive disorders [8]. Moreover, long-termtreatment adherence means a significant cost burden forpatients and their families [9]. Hence, a coordinated effortof health care personnel, patients, and their families arerequired to achieve desirable control of the disease. Consequently, T2DM affects a person not only physically but alsopsychologically, socially, and economically, exerting a negative impact on their QoL.The impact of diabetes on patients’ QoL has been studied extensively [10, 11], and T2DM was proven to reducepatients’ health-related quality of life (HR-QoL) [11]. Themajority of these studies focused on the physical and mental aspects of QoL patients. Previous studies in Bangladeshused the EuroQol-5 Dimensions Questionnaire (EQ-5D)[12], a generic measure to assess HR-QoL [13, 14]. However,the short form of the World Health Organization Quality ofLife assessment instrument (WHOQOL-BREF) probes QoLin four domains, namely, physical, psychological, social, andenvironmental domains [15]. As diabetes affects a person’slife in every direction, this study aimed to explore these fourdomains of QoL in people with T2DM using WHOQOLBREF and determine its associated factors.MethodsStudy design, participants, and placeThis cross-sectional study was carried out in the outpatientdepartment of Bangladesh Institute of Research and Rehabilitation in Diabetes, Endocrine and Metabolic Disorders(BIRDEM), a specialized center for diabetes and endocrinedisease management and research in Bangladesh. This studywas conducted over a period of 6 months, from January toJune 2019. Young adults and adults ( 15 years) diagnosedwith T2DM by oral glucose tolerance test (OGTT) wereapproached for inclusion. Patients with prior mental healthillness and those unwilling to participate were excluded. Weused the following formula for sample size calculation.Page 2 of 14Z2𝛼 pq2 wheren sample size, Z1 α2 Standard deviate at desired level of significance, p sample proportion, q 1-p, and d margin of error. From the study byBarua et al. [14], using the prevalence of an average EQ5D-5L index score of 53.4% (p 0.534), 95% level of significance (Z1/α 1.96), and 5% margin of error (d 0.05),we calculated the sample size to be 382.38 ( 383). However, a total of 500 patients with T2DM were conveniently included during the study period. Which loweredthe margin of error to 4.37% when level of significanceremains 95% or upgraded the level of significance to98.75% when margin of error remains 5%. There were nomissing data.1 n d2Study instrumentThe study instrument used to collect data from patientswas a pretested structured questionnaire (Supplementaryfile 1) produced after extensive review of previous literature and discussion with experts. The questionnaire consisted of sociodemographic information, diabetes-relatedinformation, comorbidities, complications, investigations, and QoL assessment. The 26-item World HealthOrganization (WHO)-endorsed QoL questionnaire (briefversion), known as WHOQOL-BREF [15], was adaptedfor the QoL part. The validated Bangla version of theWHOQOL-BREF [16] was used with permission fromthe original authors.Sociodemographic profileThe sociodemographic section of the questionnaireobtained information on patients’ age, sex, education,employment, and monthly family income.Diabetes‑related information, comorbidity profile,and complicationsThe second section comprised questions related topatients’ diabetes, asking about the duration of diabetes,name, and duration of anti-diabetic agents used. Patients’body mass index (BMI) was calculated from their heightand weight at the time of the interview, and they wereasked for a history of hypertension (HTN). Documentedcomplications were recorded in this section. The complications queried were nephropathy, retinopathy, neuropathy, stroke, coronary artery disease (CAD), peripheralartery disease (PAD), and diabetic foot.Biochemical profileGlycemic profile (fasting blood sugar [FBS], bloodsugar 2 h after breakfast [2hABF], HbA1c), lipid profile (total cholesterol [TC], low-density lipoprotein[LDL], high-density lipoprotein [HDL], and triglyceride [TG]), and renal function (serum creatinine, urinary
Amin et al. BMC Endocrine Disorders(2022) 22:162albumin-creatinine ratio [ACR]) were investigated andrecorded. FBS and 2HABF were assessed using Hexokinase method by Beckman Coulter Au-680 auto analyzer,serum lipid profile were tested by ARCHITECT c4000Clinical Chemistry Analyzer, serum creatinine was measured using analyzer name and ACR was determined byBN ProSpec,SIMENS.WHOQOL‑BREFThe WHOQOL-BREF to measure the QoL of T2DMpatients used in this study is a validated short versionof the WHOQOL-100 quality of life assessment instrument [17]. It is a generic instrument that can be appliedcross-culturally. The questionnaire assesses QoL in fourdomains, namely, the physical health, psychological,social relationships, and environment domains, and thuscovers the whole range of QoL deficits. It has a simpleresponse format and allows fine-grained discriminationof QoL across individuals. Considering the points to benoted during a cross-sectional assessment of QoL [17],we found that WHOQOL-BREF best fits our purpose.Study procedureTrained research assistants conducted a face-to-faceinterview of the patients outdoors after giving consent for inclusion. Before interviews, they explained thenature and purpose of the study to the participant. Misunderstood items were simply repeated, and respondents were encouraged to interpret the questions in theirway. The WHOQOL-BREF part of the questionnaire wasscored in accordance with the manual [15]. The WHOQOL-BREF showed excellent internal consistency amongour respondents (Cronbach’s alpha coefficient 0.97).Statistical analysisData from all participants were entered into a Microsoft Excel file first and then was imported to statisticalsoftware for analysis. There were no missing data. Weused descriptive and inferential methods to determinethe impact of diabetes on QoL. Normality assumptionswere checked, and analysis of variance (ANOVA), independent sample t-test, and Mann–Whitney U test wereused to compare continuous variables among different groups. Continuous variables were expressed as themean standard deviation and median (interquartilerange [IQR]) wherever applicable. Categorical variableswere described by frequencies (percent), and chi-squaretests were used to identify associations between groups.All tests were two-tailed, and p values less than or equalto 0.05 were considered statistically significant. QoLscores were transformed to a 100-point scale usingmethods detaliled in WHOQOL-BREF manual [15].The internal consistency of QoL scores, measured byPage 3 of 14the WHOQOL-BREF instrument, was assessed usingCronbach’s alpha. Multiple linear regression analysiswas used to determine factors independently associated with different domains of QoL. Prior to modellingfor each individual domain, we checked multicollinearityusing variance inflation factor (VIF) (which was 10 forall models) and condition index (which was 15 for allindependent variables), and auto-correlation of residualsusing Durbin Watson statistic (which ranged from 1.2 to2.0 for all models). The final models were built when allthe assumptions were met. We used Statistical softwareSTATA (Version 16.1) and R (Version 4.0.0) for statisticalanalysis and graphs.Ethical considerationEthical approval for this study was obtained from the ethical review committee (ERC) of BIRDEM. All procedureswere conducted following the ethical standards of thecurrent Declaration of Helsinki. Informed written consent was taken before participation of the study.ResultsA total of 500 patients with T2DM participated inthe study. The average age of the participants was55.8 13.2 years, with an IQR of 46 – 65 years. Patientsaged 51–60 years constituted the highest percentage(27.4%) among the different age groups. Slightly morethan half of the patients were female (50.8%). Mostpatients had education up to a higher secondary level(57.5%), were part-time employed, and had a monthlyincome between 5000 and 25,000 BDT (59.2%). Themean duration of diabetes was 11.3 7.9 years (SD), andan average of 1.8 3.3 years (SD) passed without medication. Rapid-acting insulin was the most widely usedhypoglycemic agent (36.8%) among patients. HTN waspresent in 70.4% of patients, and 76% of patients wereoverweight/obese. Of all, 47% of patients had at least onecomplication, nephropathy (29%) was the most commonmicrovascular complication, and coronary artery disease(13%) was the most common macrovascular complication among patients (Table 1).Table 2 describes the investigation profile ofpatients. The average FBS, 2hABF, and HbA1c were10.3 4.0 mmol/l (SD), 14.8 13.3 mmol/l (SD)and 10.1 2.7% (SD), respectively. Of all, 77.6% hadFBS 7 mmol/L, 92.2% had 2hABF 8 mmol/L and93.4% had HbA1c 6.5%. Moreover, 54.6% of patientshad an ACR between 30 and 300 mcg/mg, and 23.4%had a ratio 300. Serum TC was 200 in 36% of patients,LDL was 100 in only 0.2%, HDL was 40 (male)/ 50(female) in 91.8% and TG was 150 in 75.6% patients (allunits in mg/dl).
Amin et al. BMC Endocrine Disorders(2022) 22:162Page 4 of 14Table 1 Sociodemographic profile, duration of diabetes,medication history, comorbidities and complications of patientsVariablesTable 1 (continued)Variablesn (%)Age (years)Mean SDMedian (IQR)55.85 13.2455 (46 – 65)n (%)Intermediate-acting insulin140 (28.0)Long-acting insulin7 (1.4)Mixed insulin109 (21.8)ComorbiditiesbAge groupHypertension352 (70.4)Overweight/obesity379 (76.0)16 – 3012 (2.4)31 – 4054 (10.8)41 – 50131 (26.2)51 – 60137 (27.4)Nephropathy145 (29.0)61 – 70112 (22.4)Neuropathy108 (21.6)71 – 8039 (7.8)Retinopathy51 (10.2) 8015 (3.0)ComplicationsbMicrovascular complicationsMacrovascular complicationsSexCoronary artery disease65 (13.0)Female254 (50.8)Stroke26 (5.2)Male246 (49.2)Peripheral artery disease21 (4.2)Diabetic foot53 (10.6)EducationaUneducated110 (22.04)Up to higher secondary282 (57.51)Graduate80 (16.03)Postgraduate27 (5.41)Acute complicationHistory of hypoglycemia290 (58.0)Number of complicationsEmploymentaNone265 (53.0)One115 (23.0)No job131 (26.25)Two56 (11.2)Part time212 (42.48)Three or more64 (12.8)Full time111 (22.24)aAfter excluding missing valuesRetired45 (9.02)bMultiple response consideredMonthly family Income (BDT) 500084 (16.8)5000—25,000296 (59.2) 25,000120 (24.0)Duration of diabetes (years)Mean SDMedian (IQR)11.27 7.8610 (5 – 15)Categories 10268 (53.6)11 – 20181 (36.2) 2051 (10.2)Years passed without medicationMean SDMedian (IQR)1.79 (3.26)0 (0 – 3)CategoriesNone to 1311 (62.2)1— 363 (12.6)3— 545 (9.0) 581 (16.2)Metformin47 (9.4)Sulfonylureas21 (4.2)Alpha glucosidase2 (0.4)DPP IV inhibitors17 (3.4)Rapid-acting Insulin184 (36.8)Hypoglycemic agents usedbQuestion no. 1 (How would you rate your quality oflife?) and 2 (How satisfied are you with your health?)of the WHO-BREF questionnaire assesses individuals’overall perception about their QoL and satisfaction levelregarding their health, respectively. Among our patients,22.2% thought that they had an overall poor QoL. Onequarter of patients had general dissatisfaction about theirhealth (Fig. 1). The average score was 2.9 (SD 0.94) for thefirst question and 2.9 (SD 0.97) for the second question.The mean score with SD and median scores with IQRof the four domains of QoL are shown in Fig. 2. Themedian score was lower than 50 for the physical health,psychological, social relationship, and environmentaldomain scores. However, it was higher for the psychological domain than for the other domains. However, thedistribution of scores (as measured by IQR) was higherfor social relationship scores than for other domains.The four QoL domain scores (at a scale of 100) werecompared across categories of different patient characteristics and are presented in Table 3. QoL scores were similar among age categories across all domains except thepsychological domain. The score was significantly lower(p 0.027) for patients aged 80 years compared to most
Amin et al. BMC Endocrine Disorders(2022) 22:162Page 5 of 14Table 2 Biochemical profile of patientsVariableFasting blood glucose (mmol/l)Propertiesn (%)Mean SD10.25 3.97 7.00112 (22.4) 7.00388 (77.6)Mean SD14.82 13.25 8.0039 (7.8) 8.00461 (92.2)Mean SD10.07 2.73 6.533 (6.6) 6.5467 (93.4)Mean SD1.31 (0.99)Median (IQR)Blood sugar 2 h after breakfast (mmol/l)Median (IQR)HbA1c (%)Median (IQR)Serum creatinine (mg/dl)Median (IQR)Urinary albumin-creatinine ratio (mcg/mg)420 (84.0)Mean SD388.74 (7.00 – 8457) 30110 (22.0)30 – 300273 (54.6)121 (45 – 258) 300117 (23.4)Mean SD185.30 68.46 200320 (64.0) 200173 (138 – 228)180 (36.0)Mean SD42.76 33.12 100499 (99.8) 10021 (13 – 77.5)1 (0.2)Mean SD30.9 10.10 40 (for male) or 50 (for female)41 (8.2)Median (IQR)Serum triglyceride (mg/dl)1.04 (0.9 – 1.3)80 (16.0)Median (IQR)Serum high density lipoprotein (mg/dl)9.8 (8 – 1) 1.5Median (IQR)Serum low density lipoprotein (mg/dl)13 (10.3 – 16.8) 1.5Median (IQR)Serum total cholesterol (mg/dl)10 (7.3 – 12.2) 40 (for male) or 50 (for female)30 (24 – 36)459 (91.8)Mean SD312.87 263.38 150122 (24.4) 150378 (75.6)Median (IQR)other age groups for the latter domain. A similar distribution of scores was noted between males and females.The average psychological domain score was significantlylower in females than in males (p 0.044). All domainscores were low in uneducated patients and showeda statistically significant graded increase with education levels (p 0.05 for all domains). Retired patientshad significantly lower QoL scores in all domains thanemployed and even unemployed individuals (p 0.001for all domains). A higher monthly family income was214 (151 – 329)associated with a higher QoL score (p 0.001 for alldomains). Patients who had T2DM for 20 years had asignificantly low QoL score in all four domains (p 0.05).HTN was associated with a significantly low physicaldomain score (p 0.02). On the other hand, being overweight or obese was associated with a low social relationship and environmental domain score (p 0.037 andp 0.0.38, respectively). A high serum cholesterol level( 200 mg/dl) was associated with significantly lowerphysical health, psychological and social relationship
Amin et al. BMC Endocrine Disorders(2022) 22:162Page 6 of 14Fig. 1 Patients’ overall perception and satisfaction about their quality of life and health (Question no 1 and 2 of WHOQOL-BREF scale) [SD: StandardDeviation]domain scores than a low value (p 0.029, p 0.007, andp 0.016, respectively). All microvascular (nephropathy,retinopathy, and neuropathy) and macrovascular complications (CAD, stroke, and PVD) were associated with significantly low QoL scores in all domains (p 0.05 for all).The score declined significantly with the combination ofcomplications among patients (p 0.001).After adjustment for sociodemographic characteristics, comorbidity and complication-related variablesin multiple linear regression analysis, different sets of
Amin et al. BMC Endocrine Disorders(2022) 22:162Page 7 of 14Fig. 2 Jitter boxplot showing the quality of life domain scores of participants. [Mean standard deviation is shown on the left side of each boxplot.The median domain score with interquartile range (IQR) is as follows: physical domain score: 44 (21 – 44); psychological domain score: 50 (38 – 56);social relationship domain score: 44 (25 – 50); environmental domain: 44 (38 – 50)]factors were found to be significantly associated withthe four separate domains of the WHO-BREF QoLscale (Table 4). In the physical domain, patients’ levelof education and the presence of diabetic nephropathy and retinopathy were significant predictors. Compared to patients with no education, the physicaldomain score was 6.368 higher (p 0.006) for patientseducated up to Higher Secondary Certificate (HSC),10.893 higher (p 0.001) for graduates, and 15.687higher (p 0.001) for postgraduates. The presenceof nephropathy and retinopathy was associated with4.764-point (p 0.028) and 8.859-point (p 0.011)decreases in the physical domain score, respectively.The psychological domain was 3.113 points (p 0.029)higher in patients with graduation than those withouteducation. A monthly family income between 5000and 25,000 BDT and 25,000 BDT was associated with8.121 points (p 0.002), and 10.159 points (p 0.002)increases in the psychological domain score comparedto 5000 BDT. The presence of retinopathy, CAD, andPAD was associated with significantly low psychological domain scores (β -12.003, p 0.001; β -7.523,p 0.013; and β -12.231, p 0.022, respectively).The social relationship domain score was significantlyhigher with higher monthly family income (β 7.621,p 0.012 and β 8.925, p 0.016 for income groups5000 – 25,000 and 25,000, respectively). The presence of retinopathy and PAD was associated with asignificant decrease in the social relationship domainscore (β -10.962, p 0.006 and β -18.14, p 0.003).For the environmental domain, an education levelup to graduation (β 7.963, p 0.008) and postgraduation (β 14.822, p 0.001), a monthly incomebetween 5000 and 25,000 (β 6.605, p 0.009), andan HDL 40 (male)/ 50 (female) (β 7.055, p 0.023)were significant predictors of a higher score. Thepresence of nephropathy, retinopathy, and PAD weresignificant negative predictors of the environmental domain score (β -5.279, p 0.015; β -8.618,p 0.01 and β -13.867, p 0.007, respectively).DiscussionOur study revealed that the overall QoL of T2DMpatients in the physical health, psychological, social relationship, and environmental domains was at or belowthe middle (i.e., 50) of the possible score range (0 – 100for WHOQOL-BREF at a scale of 100 [15]). In addition,individuals’ perception of their QoL and health was predominantly average (i.e., 50). Nearly one-quarter ratedtheir QoL as poor, and one-quarter were unsatisfied withtheir physical health. Patient education and monthlyfamily income were significant positive modifiers of QoL.
Amin et al. BMC Endocrine Disorders(2022) 22:162Page 8 of 14Table 3 Four quality of life domain scores across different characteristics of participantsVariablesPhysical health domainPsychological domainSocial relationship domainEnvironmental domainMean SDMean SDMean SDMean SDAge groups16 – 3031 – 4041 – 5051 – 6061 – 7071 – 80 80p value35.91 23.5141.67 24.0840.70 21.9939.00 21.3848.22 22.0840.94 21.4746.34 20.1835.36 20.5534.21 19.5038.72 23.33342.39 19.9138.72 19.5446.92 11.9138.72 23.3340.77 10.330.0270.0780.17828.00 25.48bcd0.09644.10 19.5539.49 23.5342.79 20.5131.40 21.1943.79 21.3341.11 24.2342.92 22.1537.97 13.8736.08 23.7442.44 24.4540.77 13.3433.80 21.58SexFemaleMalep value36.90 20.7542.33 21.8037.59 20.2538.35 24.0246.11 19.9241.32 20.6340.88 22.2041.95 18.350.7080.0440.2230.71930.61 19.5037.02 21.8533.04 23.9236.17 21.8842.15 22.36a48.75 21.24a41.65 22.8745.65 19.07a0.008 0.001EducationUneducatedUp to HSCGraduatePost-graduatep value37.70 19.47a46.26 21.04a 0.00145.26 19.09a50.48 26.70a 0.00141.25 22.87a43.66 28.7041.74 17.6851.85 22.62aEmploymentNo jobPart timeFull timeRetiredp value39.24 18.3445.59 16.3137.92 18.7040.29 18.6845.77 19.2540.88 16.2041.01 20.4443.00 16.9039.82 23.4045.83 24.1942.41 27.8245.03 23.29 0.001 0.001 0.001 0.00121.73 21.03abc28.51 26.0723.87 28.75abc29.07 24.93abcMonthly family income (BDT) 50005000 – 25,000 25,000p value26.84 22.8538.08 20.32a42.43 16.33a 0.00130.65 24.6645.23 20.17aab51.11 15.14 0.00127.12 26.8140.80 22.97aa45.37 17.07 0.00131.26 24.8342.71 18.80a46.24 13.86a 0.001Duration of diabetes mellitus (years) 1011 – 20 20p value41.19 18.4946.68 17.8542.20 20.0543.85 17.1428.76 23.11a37.17 25.10a32.47 27.03a35.29 23.73a33.77 21.20a 0.00142.49 23.3337.75 25.6740.12 21.060.0050.0090.00736.86 19.6544.23 20.0139.79 21.6840.81 18.4937.98 21.4243.6 22.6139.15 26.7445.47 23.13Years passed without medication (years)No to 11 to 33 to 5 5p value38.54 21.1937.27 22.780.93746.67 22.1942.45 22.730.69038.41 24.6340.00 25.640.97342.63 19.1741.89 21.520.482HypertensionPresentAbsentp value35.87 21.4940.51 19.920.02042.99 20.5647.05 21.670.05038.47 22.0842.27 25.410.09440.76 18.7343.70 21.230.126Overweight/obesityPresentAbsent38.11 19.9934.82 21.6845.24 20.8241.26 20.8940.88 22.5435.85 24.5142.72 18.7738.49 21.33
Amin et al. BMC Endocrine Disorders(2022) 22:162Page 9 of 14Table 3 (continued)Variablesp valuePhysical health domainPsychological domainSocial relationship domainEnvironmental domainMean SDMean SDMean SDMean SD0.1250.0690.0370.038HbA1c (%) 6.5 6.5p value37.75 20.6230.09 17.170.03844.39 20.9341.39 21.590.42839.76 23.1537.27 23.360.55141.73 19.6740.15 17.680.653Total cholesterol (mg/dl) 200 200p value38.73 36.6534.58 22.870.02946.08 19.1840.85 23.480.00741.47 20.9736.27 26.330.01642.34 17.5340.38 22.640.282Serum high density lipoprotein (mg/dl) 40 (for male) or 50 (for female) 40 (for male) or 50 (for female)p value32.80 19.9837.64 20.500.14843.02 22.8144.80 20.810.70936.75 21.7439.84 23.280.41237.68 17.3741.98 19.680.177Serum triglyceride (mg/dl) 150 mg/dl 150 mg/dlp value40.09 19.5836.33 20.710.08248.77 18.9242.71 21.390.00542.94 20.5738.52 23.850.06644.21 17.7140.79 20.030.093NephropathyPresentAbsentp value28.93 20.9440.63 19.31 0.00136.15 23.9547.47 18.67 0.00131.18 24.3643.03 21.76 0.00134.12 21.0944.70 18.00 0.001NeuropathyPresentAbsentp value29.40 22.4939.40 19.38 0.00146.26 19.3036.69 24.80 0.00133.88 28.9041.17 21.080.02936.37 23.3943.08 18.090.002RetinopathyPresentAbsentp value19.27 22.6739.28 19.21 0.00123.70 25.2746.52 19.10 0.00120.06 28.8641.81 21.35 0.00126.12 25.6543.39 17.91 0.001Coronary artery diseasePresentAbsentp value23.81 20.1239.25 19.79 0.00128.18 24.5546.59 19.29 0.00125.43 25.2841.71 22.08 0.00131.12 23.9443.20 18.30 0.001StrokePresentAbsentp value22.92 16.6838.02 20.39 0.00127.96 22.4145.08 20.53 0.00124.5 24.1340.42 22.840.00129.88 20.9142.28 19.260.002Peripheral artery diseasePresentAbsentp value17.66 22.2628.09 19.99 0.00123.95 25.6345.08 20.31 0.00113.95 24.7440.72 22.45 0.00120.19 19.0942.57 19.02 0.001Diabetic footPresentAbsentp value28.81 21.9038.29 20.100.00439.15 24.4044.79 20.460.13231.69 27.8840.53 22.380.05233.00 21.1342.66 19.100.007History of hypoglycemiaPresentAbsent37.20 19.4537.30 21.8844.33 20.2744.00 21.9239.46 21.5939.78 25.2140.62 18.5143.02 20.82
Amin et al. BMC Endocrine Disorders(2022) 22:162Page 10 of 14Table 3 (continued)Variablesp valuePhysical health domainPsychological domainSocial relationship domainEnvironmental domainMean SDMean SDMean SDMean SD0.9740.8600.4310.02748.70 17.5243.30 19.7845.24 16.5835.64 26.34a30.22 28.35aNumber of complicationsNoneOneTwoThree or morep value42.08 18.4140.03 18.2728.34 21.48ab19.97 20.22 0.001ab42.43 20.89aabc16.42 21.54 0.00139.73 24.08aabc11.71 21.99 0.00145.17 17.9333.73 21.14ab27.27 23.56ab 0.001The p value was determined by independent samples t test, Mann–Whitney U test, and one-way analysis of variance where appropriate. Post hoc pairwisecomparisons were done using Tukey. For pairwise comparisons, the p value was significant at the 0.05 level compared to the afirst category, bsecond category, cthirdcategory and dsixth categorySignificant values were shown in bold faceAt the same time, the presence of complications was animportant negative determinant of QoL scores.Mishra et al. [18] used the WHOQOL-BREF scaleto assess QoL among T2DM patients in Nepal. Theyreported mean QoL scores ( SD) of 50.7 11.8,53.3 10.3, 57.3 8.9, and 54.7 7.7 in the physicalhealth, psychological, social relationship, and environmental domains, respectively, among T2DM patients.However, the scores were 37.2 20.5, 44.2 21.0,39.6 23, and 41.6 19.5 in our study, pointing to a lowQoL score in this group of patients. Similarly, in WestJava, Puspasari and Farera [1
structured questionnaire including the 26-item WHOQOL-BREF questionnaire was used for face-to-face interviews. . which is based primarily on lifestyle modication, exercise, and pharmacological agents []. e disease runs a chronic 5 . et al. Assessment of health-related quality of life of Bangladeshi patients with type 2 diabetes using the EQ .