Transcription
Cognizant 20-20 InsightsReal-Time Credit Valuation Adjustmentand Wrong Way RiskEstimating the most accurate CVA is a significant challenge,requiring that banks take into account real-time informationsuch as credit spreads, macroeconomic factors, commodity prices,political crises, technology and other factors.Executive SummaryThis paper presents a new framework for real-timecredit value adjustment (CVA) and wrong way risk(WWR).In contrast to previous studies, the proposedmodel herein relies on the probability distributionof a model filter – an optimal estimator that infersparameters of interest from indirect, inaccurateand uncertain observations. New measurementscan be processed as they arrive.Empirical studies indicate that mark-to-market (M2M) values have not been an effectivereflection of the true value of an asset. As a consequence, the International Accounting Standard(IAS) 139 requires banks to provide a fair-valueadjustment due to counterparty risk. Thus CVAbecame mandatory in 2000. However, it receivedlittle attention until the 2008 financial crisis inwhich profit and loss (P&L) swings due to CVAcognizant 20-20 insights may 2016changes touched billions of dollars. CVA has nowbecome the first line of defense and the core ofcounterparty credit risk management.Before the advent of CVA, the general practice inthe industry was to mark derivative portfolios atM2M values. Often, this was evaluated independently of counterparty credit risk. Consider astock that ends the day at 10. This is the M2Mvalue carried over to accounting/valuation booksto reflect daily P&L. However, the stock actuallyrose intraday from its previous M2M value of 8to 22 and touched a low of 2 before closingat 10. How can the M2M value then reflect thetrue value of the stock? Several reasons could beascertained/cited which would need an altogetherdifferent exposition.To address this issue, recent studies fromregulators have suggested that mark-to-matrixand mark-to-model valuations are more effective.
Previous works on CVA were focused on unilateralCVA that assumes only one counterparty willdefault. This ignores the fact that counterpartyrisk can be bilateral and even multilateral. Agrowing trend is to consider the bilateral natureof counterparty credit risk. However, Hull andWhite (2012) argue that bilateral CVA is more controversial than unilateral CVA, as the possibilitythat a dealer might default is, in theory, a benefitto the dealer.CVA is, by definition, the difference between therisk-free portfolio value and the true portfoliovalue that takes into account the possibility ofa counterparty’s default. The risk-free portfoliovalue is what brokers quote and trading systemsor models normally report. The true portfoliovalue, however, is a relatively less explored andless transparent area, and is the main challengefor CVA.CVA not only allows institutions to move beyondthe traditional control mindset of credit risk limitsand to quantify counterparty risk as a singlemeasurable P&L number, but also offers an opportunity for banks to dynamically manage, price andhedge counterparty risk. The benefits of CVA arewidely acknowledged. Many banks have set upinternal credit risk trading desks to manage counterparty risk on derivative transactions.In general, risk valuation can be classified intotwo categories: the default time approach (DTA)and the default probability approach (DPA). DTAinvolves the default time explicitly. Most CVAmodels (Brigo and Capponi (2008), Lipton andSepp (2009), Pykhtin and Zhu (2007), Gregory(2009), etc.) are based on this approach.DTA is very intuitive; it has the disadvantage thatit explicitly involves the default time. We are veryunlikely to have complete information about afirm’s default point.1 Valuation under the DTA isperformed via Monte Carlo simulation.DPA, on the other hand, relies on the probability distribution of the default time rather thanthe default time itself. Sometimes the DPA yieldssimple closed form solutions.Wrong way risk (WWR) occurs when exposure toa counterparty is adversely correlated with thecredit quality of that counterparty, while rightway risk occurs when exposure to a counterparty is positively correlated with the credit qualityof that counterparty. In WWR, exposure tendsto increase when counterparty credit qualitycognizant 20-20 insightsworsens, while in right way risk exposure tendsto decrease.Changing trends in CVA and WWR2: CVAvaluation methodologies have undergone a seachange over the past few years. Overnight indexswap (OIS) discounting, collateral optimizationand funding are the new focus areas. Collateralvaluation is giving way to collateral modellingand an increased emphasis on quantifyingWWR. Back-testing frameworks establishingmodel validation procedures are being exploredapart from central clearing (CCP) quantifyingtrades and default fund exposures in calculatingassociated capital charges.The use of risk-neutral default probabilities viacredit spreads is becoming standard practice inthe quantification of CVA, driven by accountingand capital rules.CVA not only allows institutions tomove beyond the traditional controlmindset of credit risk limits and toquantify counterparty risk as a singlemeasurable P&L number, but alsooffers an opportunity for banks todynamically manage, price and hedgecounterparty risk.The general shift to OIS discounting as the beststandard valuation method (collateralized trades)has gained industry traction and acceptancegiven the choice of acceptable currencies. CSAand the inherent value has given way to optionsfor optimizing it. FVA as a material component invaluation and the consequences of DVA overlapwill also create variations in approaches acrossmarkets.This paper proposes an alternative approach tofinding the most accurate CVA estimate fromavailable data.Current PracticeCVA is expected loss due to counterparty defaultat any time before portfolio maturity (M2M) P&L.It uses four components to manage risk: Portfolio: Depends on the entire portfolio oftrades with the counterparty (valuation or truevalue of an asset/exposure). Collateral: Depends on the nature of collateralposted or received by the counterparty and2
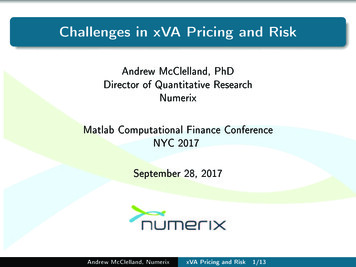
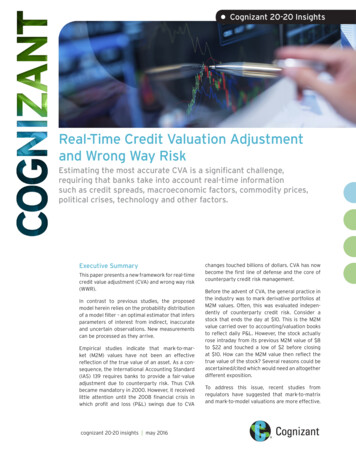
CSA details (collateral optimization, valuationand real-time reconciliation). Asset class complexity: Cannot be easilyvalued or hedged (the homogeneity andcomplexity of exotic trades in the portfolio, thestochastic nature of valuation). Risk management: Causes fundamentalchanges in how trading business is organized(e.g., CVA desk).We believe that more than 83% ofa bank’s portfolio value stems frominterest rate swaps and forwardcontracts and cross-currencyswaps, and to a lesser extent creditderivatives and exotics.From a CVA estimation perspective, we arekeen to forecast the actual value of the lossdue to counterparty default at any timebefore portfolio maturity. Once this has beenestimated, checks at a defined horizon shouldgauge whether estimated charges are in linewith realized values (losses). This could be inthe form of MTM or realized P&L. Should a largevariance occur, it would be apparent that thefiltration process did not factor in discrete orunknown variables, or ignored them. This leadsto the next fundamental question: How doesone estimate counterparty default, and basedon what variables? More importantly, how doesone estimate CVA taking into account real-timeinformation such as correlation, credit spreads,macroeconomic factors, commodity prices,political crisis, technology, etc.?CVA: Trading Desk, Asset Class and Products(Exposure)For most if not all asset classes, risk analysismust take place as close to real time as possible.Portfolio stratification therefore becomes evenmore important. The purpose of stratification is portfolio risk analysis – determining therisk associated with each group of assets in aportfolio. The best way to do this is to segmentthe portfolio into groups of assets with similarcharacteristics. The basic stratification alwaysincludes interest rate, asset type and investortype, among other factors.We believe that more than 83% of a bank’sportfolio value stems from interest rate swaps andforward contracts and cross-currency swaps, andto a lesser extent credit derivatives and exotics.cognizant 20-20 insightsThe overall CVA is driven by several factors suchas large notional amounts, long dated tradesand overall complexity (with credit derivatives inparticular). Another important component of CVAvaluation is collateral and its valuation and quality.Given that the Basel III margin period of risk3(MPR), also known as the liquidation period, canbe material and much longer than the contractualcollateral call frequency (CSA annexure), collateralis widely used as a factor to determine CVA.CVA DeskMost banks categorize their CVA desk as either ahedge desk (risk mitigation) or a profit center (riskappetite). Though each desk has the potential fora windfall, the complacency around repricing CVAcan have disastrous consequences in the wakeof a sudden market movement. To mitigate thisrisk, many banks resort to reallocation. However,in the absence of information of the true valueor profitability of the trade dependent on theCVA, this can lead to incorrect pricing. Severalfirms that have qualified for the IMM approach(by virtue of having demonstrated that non-IMMqualified trades are calculated as per supervisorystandards) have realized that data to run simulations such as Monte Carlo are inadequate andhave had to ask regulatory agencies that thecurrent exposure methodology (CEM) model beused for such asset classes/exposures.Normally, collateral is first ascribed to IMM tradesand the residue value is then allocated to CEMtrades. This is an erroneous approach since alarge portion of the CEM trades are now classifiedas non-collateral CVA, requiring a different set ofcalculations.Second, from a regulatory perspective, firmsmight be Basel III or report compliant (CVA reports,RWA, capital charges, etc.), but when adversemarket movements cascade down to individualtrades (part of the portfolio), the exposures tendto go haywire and the lack of liquidity adds to themisery as witnessed in the recent crisis.Proposed SolutionThe building blocks to create a real-time CVApricing mechanism should factor in multiplescenarios or market “noise,” thus enabling CVArepricing to reflect micro-changes in exposures.This means assigning counterparty default valuesso as to enable effective netting or utilizing creditlines to offset or hedge default risk.We propose the following guidelines for creatinga robust tool for real-time credit risk valuation.3
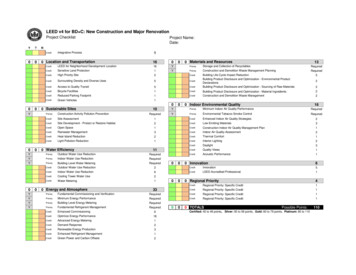
Data Enrichment &Intermediary Risk FactorsCalculation(Batch Processing)Calculate Portfolio P&lBased on Historical SimulationMtM (520 Days Recent Data)Trade Positions(Portfolio Level)Calculate Portfolio Stressed P&LBased on Historical SimulationMtM (260 Days 2008-2009Stressed Period)Calculate Credit Spreadsfor Liquid Names(Advanced CVA)Counterparty Data,RatingMarket ReferenceDataHedge Trades(Single Name/Index)LGD/PD/RecoveryRateTRADE SCOPINGIdentify Models for CVA(STD/Advanced)Assign GuarantorsAssign HedgeBooks to TradesSTAGINGCalculate Proxy Spreadsfor Illiquid NamesETLFinance ReportingLevel InformationBucketing Based onRegion, Industry & RatingBootstrapping toGenerate Proxy Spreadsfor All 65 IMM TenorsCalculate 99% 1 Day VaRCalculate Proxy Add-onCalculate Curve Risk Add-onCalculate Index Skew Add-onCalculate AdvancedCVA Using Internal ModelCalculate Advanced CVAUsing Full Revaluation ApproachCalculate Default Grade(DG) for TradesCalculate Implied VolatilityCalculate Single NameHedge Notional & Cs01Identify and ExcludeInternal Trades.Define IMM Risk TenorCalculate 95% 1 Day VaRCalculate Reg CS01 (CreditSpread Sensitivities) forLiquid NamesCORE CALCULATIONTrade Details CollateralLimits &Thresholds Trading DeskP&L AND VARCALCULATIONSAssign Credit Ratings toNon-IMM TradesCalculate Index HedgeNotional & Cs01Assign SystemParametersIdentify Internal TradesDefine Bucketingfor Proxy SpreadsIdentify Agency TradesCalculate Portfolio Risk WeightCalculate StandardizedCVA for Non-IMM trades(Standard Regulatory Model)Figure 1cognizant 20-20 insights4Add Overall CVA Charge Based on Reporting ScopeExpected Exposure –CEM TradesDATASOURCESCredit LinesCSA Annexure/ISDA AgmtsExpected Exposure(IMM Model)CVA FLOWRISK AGGREGATIONDATA RECEIVED FROMUPSTREAM SYSTEMS(PHYSICAL FEEDS) (T-2 DAYS)ADVANCED CVA (Stressed Unstressed) Standard CVA (Stressed & Unstressed)Calculate RWA BASED ON Reporting ScopeA Typical CVA LandscapeRegulatoryReportsRiskManagersCVR Reports(T 2)What-ifAnalysisVerify RWAAggregation LevelCustomizedReports
We propose a hybrid solution that combines ahost of available approaches not restricted tothe capital markets or actuarial science arena,including a bio-informatica model. For modelvalidation and “best fit” in terms of “noise,” wesuggest a champion-challenger model as well. Weaddress WWR towards the end.Note: CCP clearing issues are not addressed inthis paper.Margin period of risk (MPR), also known as the“liquidation period,” stands for the time periodfrom the most recent exchange of collateralcovering a netting set of financial instrumentswith a defaulting counterparty until the financialinstruments are closed out and the resultingmarket risk is re-hedged.Mark-to-MarketMark-to-market, sometimes known as fair valueaccounting, refers to the accounting standardsthat determine the value of a position held ina financial instrument based on the currentfair market price for the instrument or similarinstruments.IFRS 13 Fair Value Measurement, which is thelatest standard within the International FinancialReporting Standards (IFRS) framework dealingwith the measurement of fair value, definesfair value as “the price that would be receivedto sell an asset or paid to transfer a liability inan orderly transaction between market participants at the measurement date.” The definitionof fair value in U.S. GAAP is consistent. Broadlyspeaking, fair value can be estimated usingeither a quoted price in an active market(mark-to-market) or, in the absence of anactive market, a valuation technique based onobservable market inputs and/or recent markettransactions (mark-to-model).Both U.S. GAAP and IFRS recognize that pricequotations in an active market are the bestevidence of fair value and must be preferred overother valuation techniques such as mark-to-modelmethods. This hierarchy is also encouraged withinIOSCO’s policy recommendations for MMFs2.Under normal market operating conditions, markto-market reflects the values in actual markettransactions between willing buyers and sellers.There is a single price, transparent to all in themarket. Mark-to-model has meaning only if themodel used reflects the reality of the market. Thecognizant 20-20 insightsdegree to which the model reflects market valueis usually determined by regular stress testingand back testing.Often, while models are operative over the longterm, market factors can cause the model to failat a specific point for any number of reasons. Allmodels require raw data to calculate a valuationof an asset. This presents many issues that mustbe addressed by the user of the models.Mark-to-ModelCommercial paper (CP) and certificates of deposit(CDs) are transferable securities but are rarelytraded in the secondary market. Due to the shortmaturity of these types of financial instruments,they have very low sensitivity to movementsin market rates and, as such, there is minimalincentive to trade these instruments. Investorswill typically hold onto CPs and CDs till maturity.We propose a hybrid solution thatcombines a host of available approachesnot restricted to the capital markets oractuarial science arena, including a bioinformatica model.Therefore, fair value for these assets must beestimated using a discounted cash flow methodology based on current yield curves. Normalmarket conditions do not pose any significant difficulties for the mathematical modelling of cashflows. However, market participants might differon the construction of yield curves for discounting those cash flows.There are two different approaches that could beemployed:Money market yield curve: The simplestapproach, and one that is already used by manyMMFs, would be to discount the cash flowsusing money market yield curves. One commonapproach is to use LIBOR curves (rates forshort-term, unsecured interbank borrowing andlending) for the relevant currencies. However, tominimize basis risk (i.e., the risk that the valuationis based on a yield curve that fails to incorporateall components of risk within these instruments)in the valuation of CP and CD, a more accurateapproach would be to use composite rate quotesfor new CP and CD issuances, typically quoted inthe market for top-tier and second-tier issuers inUSD, EUR and GBP. While such rate quotes areavailable from some market data vendors, there5
are concerns in the market about the accuracyand the transparency of these composite curves.Additionally, while the use of money marketcurves captures the effect of industry-level yieldchanges on asset valuations, it excludes theimpact of issuer level, idiosyncratic risk (i.e., therisk of default by a specific issuer).The highlights/steps are as follows, in sequence: A hierarchy of forward curves4 is constructedinstead of just one curve. Each curve in thehierarchy corresponds to a collateralizationtype. For example, the root of the hierarchytypically corresponds to zero credit risk andis used for discounting all cash flows in thecalibration instruments. Other collateralizationtypes include LIBOR, etc. However, the tradercan arrange the hierarchy any way they likeand/or add extra collateralization types (e.g.,for non-USD currencies, currency equivalentsof USD curves can be added and calibratedagainst cross-currency swaps). There is noneed for a separate “cost of funding” anymore. Each forward curve to be constructed isrepresented as a sequence of linear segments;the time intervals of these segments can beas short as necessary. They do not need tocorrespond to standard tenors. As a result,once the curves are constructed, they canbe used directly, without any interpolation.The linear coefficients of all curves are the Nunknowns to be found (technical details havebeen omitted). “Spikes” in LIBOR rates at year turns are automatically corrected. Any number (M) of calibration instruments canbe put in, providing the equations to be solved.It is possible to have N M (the usual case), N M or N M. Virtually all kinds of instrumentscan be used, and they may have overlappingtenors without any restrictions. For JPY, it iseven possible to use both LIBOR- and TIBORderived prices at the same time. The spec foreach calibration instrument contains explicitreferences to the collateralization types andthe index (e.g., LIBOR/TIBOR) it depends upon. As follows from the above setup, the forwardcurve parameters are to be derived via a constrained optimization procedure. The constraints are market prices, and the cost functionof this procedure is user-configurable: it allowsthe trader to put in their educated guess of thenext central bank rate moves, the requirementsfor curves continuity or (otherwise) jumps, etc. It is even possible to use illiquid marketinstruments. Their prices are not to be matcheddirectly – the degree of illiquidity serves as ameasure of tolerance in matching the marketprices (higher illiquidity higher tolerance).Mark-to-matrix is a technique used forless actively traded assets, such asemerging market securities, municipalbonds and asset-backed securities (ABS).Issuer yield curve: While composite rate quotescan be obtained for new issuances, observabilitycan be limited in EUR and GBP CP/CD markets.Also, these curves are not sufficiently granularto determine the rate at which a specific issuerwill be able to issue new CPs and CDs. Someissuers will pay rates above the industry curveand some will pay lower rates. Therefore, tomost accurately determine the fair value of theCPs and CDs from specific issuers, the cashflows should be discounted using issuer-specificyield curves. In the absence of daily, issuer-level money market rate quotes, the constructionof issuer yield curves presents some modellingchallenges. Any curve construction will sufferfrom the absence of secondary market quotes atthe short end. However, the objective will be toproduce issuer yield curves that are responsive toidiosyncratic risks and that produce accurate fairvalues when the issuer experiences positive ornegative market sentiment. Without a secondarymarket, credit spread data can only be observedin the new issuance market. New issuance can beinfrequent, leading to static pricing information atthe short end of the issuer curve, making it nonreactive to current market sentiment. Up-to-datepricing data for a specific issuer may be observedin the bond or credit default swap (CDS) marketbut incorporating this information to producecurrent issuer CP and CD curves can be difficultas the dynamics of the bond and CP/CD marketsare very different.Mark-to-MatrixThis is a technique used for less actively tradedassets, such as emerging market securities,municipal bonds and asset-backed securities(ABS). It involves “bootstrapping” – estimatinga credit spread of the asset relative to a moreactively traded instrument that can be pricedeasily.cognizant 20-20 insights6
CVA ModellingOur approach suggests creation or consolidation at two desks, one at the front office leveland the other at the risk management level. Thefront office CVA desk needs to be accurate andextremely fast, given the complexity of analytics,sensitivities and scenarios. On a parallel plane,each of these trades must reconcile with all levelsof collateral posted and/or other credit supportdocuments (CSA) agreements, TPA guarantees,etc. Often ignored or infrequently valued aretrades of highly rated counterparties. A combination of short dated, collateralized trade alongwith other larger exposures must be valued andmonitored in real time.Several banks have no convergence of systemsand models between front office and riskmanagement, further compounded by the introduction of new functionality – change requests.To “run a thread” through each of the existingfunctionalities and align these with the “blackbox” algorithms/formulas is time-consumingand manually driven. In the wake of changesin technology, new trading venues, collateralmanagement and valuation and emergingregulations, many legacy systems have eitherbecome obsolete or are unable to match thespeed in reporting or generating alerts. Often,this practice of multiple reports from acrosslegacy, bespoke applications runs the risk ofduplication. With the advent of cloud computing,several sectors have been completely revolutionized that were once dominated by largeand expensive legacy applications. Thus quickmanagement alerts are a prerequisite and a vitaltool for effective risk mitigation.Another area that requires instantaneous data isthe ubiquitous risk management and regulatorydesk arena. Trade level population should havethe same intensity of computation, speed andaccuracy irrespective of the perceived risksof the trades. An overwhelming majority ofbanks rely on Monte Carlo simulation (withpath ranges between 1,000–10,000) withvarying time steps. We believe that in additionto the MC simulation method it would beprudent to compare the results with that fromanother filtration methodology that we call the“champion-challenger” model.We chose the model for its overall simplicity,the complexity of the inputs, good results inpractice due to its structure, its conveniencefor online real-time processing and because it iscognizant 20-20 insightseasy to formulate and implement (measurementequations need not be inverted).The one-size-fits-all approach might not workfor every trade, especially when pricing illiquidinstruments. Given the perils of low sophistication and the resultant exposure increasing exponentially and driving CCR, banks need to strike abalance between the levels of complexity theirmodels ought to handle – especially in terms ofcurve dynamics and volatility.The final component of inputs to this model wouldbe the correlation factor between and within assetclasses and between CVA and WWR. Though firmsuse the historically-based correlation approach,we think this approach does not factor in certaindormant elements that might seem like a “lonewolf” acting with other noise but might manifestin a totally unpredicted fashion. We propose amodel that factors in information as it arrivesand determines and deploys a coefficient that notonly detects a correlation between asset classesand exposure but also quantifies the extent ofthe correlation. In other words, the tangibility innumbers helps ascertain the extent to which riskmitigating factors need to be used on existingportfolios. This is in line with our approach ofincorporating the default time approach (DTA) aswell as the default probability approach (DPA), asexplained earlier.Our approach suggests creation orconsolidation at two desks, one at thefront office level and the other at therisk management level. The front officeCVA desk needs to be accurate andextremely fast, given the complexity ofanalytics, sensitivities and scenarios.Collateral and ValuationPosting of collateral usually involves a choicebetween eligible assets as mutually agreed uponin the Credit Support Annexure (CSA) agreement,with eligible collateral usually including cash,bonds, shares, gold, etc. “Haircuts” apply todifferent kinds of collateral. Equivalent cashamount in CSA base currency is computed (byhaircuts and currency exchanges) for all postedcollateral as per Basel norms.Margin period of risk (collateral lag), a newfeature under Basel III, has been introducedsince most financial defaults were triggered by7
liquidity. When stressed, a derivatives party canbe expected to delay margin payments. Thus therun-up to CVA calculation involves valuation ofcollateral as well (in case of margin calls breachinga threshold or high correlation between exposureand collateral).The objective is to address the valuation andreal-time reconciliation between collateral andcounterparty exposure as a result of the margincall requirements.Given the human nature of relationships,fostered over a period of time thatsometimes spans generations, extendedcredit lines or illiquid instruments couldbe pledged and accepted as collateral.haircuts and selecting an appropriate methodfor low-probability events (e.g., large, unexpecteddeclines in asset prices) and one that takes intoaccount the cost of pledging collateral.Two components are needed to calculate a haircutfor collateral: The first is a model of the distribution of losses(i.e., frequency with which the asset declinesin value), since the distribution of returns isunknown. The second is a risk measure, which can bethought of as a way of mapping the lossdistribution into a single number (the haircut).There are several ways to model the lossdistribution for collateral based on historicaldata for returns. These include: Parametric approaches that use historicaldata to obtain the parameters necessaryto characterize a given distribution (e.g.,normal, t, etc.). These parameters are thenused to approximate the return distribution, and the haircut is obtained from theresulting quantile given a particular distribution and a confidence level.It bears mention here that collateral could consistof several types and these could either fall or risein value. An example could be a plain vanilla stockthat could rise or fall giving rise to margin calls orposting of additional or different collateral. Froma collateral optimization perspective, it can workin two ways: From a bank perspective that receivescollateral, it is protected from any rise incounterparty exposure. The bank in turn can sellthis collateral in case thresholds are breachedor the counterparty fails in its commitment tomake variation margin payments. The same would be the case when the bank’scollateral remains with its counterparty.Any rise in collateral value posted with thecounterparty cannot be used by the bank, thusreducing its ability to make good on collateralvalue which otherwise would have been in thebank’s books.Another important point is the type and kind ofcollateral that counterparties could pledge. Giventhe human nature of relationships, fostered over aperiod of time that sometimes spans generations,extended credit lines or illiquid instruments couldbe pledged and accepted as collateral. In recenttimes, art and relics also have been presented ascollateral. In the light of such exotic collateral,valuations could be incorrect, overstated or sentimental in nature, thereby making the task ofmonitoring and valuing such collateral risky andtime-dependent.We propose a framework that can be used tocompare different methods for calculatingcognizant 20-20 insights Non-parametric approaches, such as his-torical-simulation techniques that do notmodel the return distribution under someexplicit parametric model, but instead usethe empirical distribution of the data to estimate the quantiles for a given confidencelevel.Along with choosing one of the above approaches,the estimation of haircuts requires a means ofquantifying risk: a risk measure. Various riskmeasures can be used. One of the most commonis the value at risk (VaR). An additional/alternaterisk measure called expected shortfall (ES) hasbeen introduced in Basel III.To estimate the haircut for such an asset, we usea parametric approach (e.g., a normal return distribution) and select a risk measure (e.g., VaR).Knowing that the asset has a daily percentagechange in price with a mean of zero and a standarddeviation of x%, we estimate the correspondingnormal distribution. Next, we choose a confidencelevel for the haircut (e.g., 0.5%) and then selecta holding period (e.g., one day
the traditional control mindset of credit risk limits . and to quantify counterparty risk as a single measurable P&L number, but also offers an oppor-tunity for banks to dynamically manage, price and hedge counterparty risk. The benefits of CVA are widely acknowledged. Many banks have set up internal credit risk trading desks to manage coun-