Transcription
Wickenden et al. Diagnostic Pathology (2018) ARCHOpen AccessPD1hi cells associate with clusters ofproliferating B-cells in marginal zonelymphomaKatherine Wickenden†, Nadia Nawaz†, Sami Mamand, Deevia Kotecha, Amy L. Wilson, Simon D. Wagner*†and Matthew J. Ahearne†AbstractBackground: Abnormally sustained immune reactions drive B-cell proliferation in some cases of marginal zonelymphoma but the CD4 T-cell subsets, which are likely to contribute to the B-cell responses in the tumourmicroenvironment, are not well characterised and neither has the spatial distribution of the different subsetsin involved lymph nodes been investigated.Methods: Employing a workflow of multiplex semi-automated immunohistochemistry combined with imageprocessing we investigated association between infiltrating T-cells and proliferating lymphoma B-cells.Results: Both total numbers of activating follicular helper (Tfh) cells (defined by high expression of PD1) andsuppressive regulatory (Treg) T-cells (defined by FOXP3 expression) and the Tfh:Treg ratio, assessed overrelatively large areas of tissue, varied among cases of marginal zone lymphoma. We determined spatialdistribution and demonstrated that PD1hi cells showed significantly more clustering than did FOXP3 . Toinvestigate the association of infiltrating T-cells with lymphoma B-cells we employed Pearson correlationand Morisita-Horn index, statistical measures of interaction. We demonstrated that PD1hi cells were associated withproliferating B-cells and confirmed this by nearest neighbour analysis.Conclusions: The unexpected architectural complexity of T-cell infiltration in marginal zone lymphoma, revealed in thisstudy, further supports a key role for Tfh cells in driving proliferation of lymphoma B-cells. We demonstratethe feasibility of digital analysis of spatial architecture of T-cells within marginal zone lymphoma and futurestudies will be needed to determine the clinical importance of these observations.Keywords: Marginal zone lymphoma, Follicular helper T-cells, Spatial characteristicsBackgroundMarginal zone lymphoma (MZL) includes three entities:nodal, extranodal (mucosa associated lymphoid tissue(MALT) lymphoma) and splenic marginal zone lymphoma (SMZL) [1]. These conditions share phenotypic andmorphological features [1] but show varying genetic aberrations [2–5].Extranodal MZL, the commonest of the three subtypesof MZL, has been linked to infectious micro-organisms* Correspondence: sw227@le.ac.uk†Katherine Wickenden, Nadia Nawaz, Simon D. Wagner and Matthew J.Ahearne contributed equally to this work.Leicester Cancer Research Centre and Ernest and Helen Scott HaematologyResearch Institute, University of Leicester, Lancaster Road, Leicester LE1 7HB,UK[6] or autoimmune disorders prompting the idea thatoveractive immunity underlies lymphomagenesis [2] andthis is supported by the association between some autoimmune conditions such as Sjögren’s syndrome withMZL.There are recognised to be several different CD4 T-cell subsets with different functions in normal immunity [7]. One of these subsets, follicular helper (Tfhcells) T-cells, is essential for normal immunity and isalso required for the development of autoimmunity [8].As well as characteristically producing IL-4 and IL-21,Tfh cells demonstrate high surface expression of PD1(CD279) and nuclear expression of BCL6. SuppressiveCD4 T-cell subsets (regulatory T-cells (Tregs), (PD1lo The Author(s). 2018 Open Access This article is distributed under the terms of the Creative Commons Attribution 4.0International License (http://creativecommons.org/licenses/by/4.0/), which permits unrestricted use, distribution, andreproduction in any medium, provided you give appropriate credit to the original author(s) and the source, provide a link tothe Creative Commons license, and indicate if changes were made. The Creative Commons Public Domain Dedication o/1.0/) applies to the data made available in this article, unless otherwise stated.
Wickenden et al. Diagnostic Pathology (2018) 13:74Page 2 of 10and FOXP3 ), and follicular regulatory T-cells (Tfr)(PD1hi and FOXP3 ) counter the activating effects ofTfh cells [9].Recent progress in computational biology that allowsunbiased statistical modelling of the spatial distributionof lymphocytes has been applied to breast cancer inorder to understand how the different cell types i.e. cancer cells, lymphocytes and stromal cells, interact withone another. This work has demonstrated that patternsof lymphocyte infiltration are prognostic [10] and specifically that Tfh cell infiltration and gene signature predicted response in breast cancer [11].Numbers and pattern of T-cell infiltration have beendemonstrated to correlate with some clinical characteristics in follicular lymphoma [12] and diffuse large B-celllymphoma [13] and biologically this might be associatedwith their effects on B-cell proliferation: either activation(Tfh cells) or inhibition (Tregs). There are also recognised to be specific patterns of Treg infiltration infollicular lymphoma [12] but more detailed and quantitative investigation has been hampered because manualmethods do not allow large areas of tissue to beanalysed.There has been much less work on T-cells in MZL.Tregs, are present in the tumor microenvironment(TME) in extranodal MZL [14] but activating follicular helper T-cells (Tfh) have not been characterisedalthough they are a highly relevant subset becausethey are the principal producers of IL-21 and IL-4,which are growth factors important for normal andmalignant B-cells [15]. MZL, unlike follicular lymphoma, usually has no discernible histological structure,which adds to the difficulty of detecting the spatialcharacteristics of infiltrating T-cells. In this report wecombine immunohistochemistry and computationalmethods to show unexpected differences in the distribution of PD1hi and FOXP3 cells in MZL.MethodsSamplesFifteen MZL biopsy samples (spleen 3, lymph node 7,periorbital 2, parotid, lung, thyroid 1 each) were obtained from Leicester Royal Infirmary under ResearchEthics Committee 14/EM/1176. (female 11, male 4;median age 63.5 years (range 48–74 years)). The characteristics of the patients and the treatment they receivedare shown (Table 1).Immunofluorescence microscopyImmunofluorescence (IF) staining was performed usingOpal 4-color fluorescent IHC kit (NEL800001KT, PerkinElmer, Waltham, MA, USA). Following antigen retrievalformalin fixed and paraffin embedded (FFPE) sectionswere incubated with protein block (RE7102, Novolink Table 1 Patient 62ISRTExtranodalPeriorbitalFoliicular architecture with colonisationof follicles59I257NA062W&WDiffuse67IV3291070Rituximab CHOPDiffuse67IV4241049Rituximab FCResidual germinal centres48IV2373030Rituximab CVP Rituximab maintenaceNodalDiffuse61III2275036Rituximab iffuse61IVND20132Splenic RT; CVP; dalDiffuse72IV277111Rituximab CVPNodalDiffuse55IV2349062Obinutuzumab CVP italExtranodalDiffuseDiffuse74INDNA031Lung lobectomyExtranodalDiffuseDiffuse63I202NA025W&WThe type of MZL is indicated (extranodal, nodal and splenic) and the site of extranodal disease together with the histological appearance (diffuse in 13/15 cases,with one case showing residual germinal centres and another case showing follicles with colonisation by lymphoma. Age (years), clinical stage (I to IV) and lactatedehydrogenase (LDH) are also shown. For LDH the upper limit of normal 255 IU/L. ND not determined. Time to first treatment (TTFT) and overall survival (OS) inmonths is shown and whether the patients are alive (0) or dead (1). Three patients were managed by watch and wait (W&W) while the others received varioustreatments: involved site radiotherapy (ISRT), rituximab with cyclophosphamide, adriamycin, vincristine and prednisolone (CHOP), rituximab withcyclophosphamide, vincristine and prednisolone (CVP), obinutuzumab with CVP or rituximab with fludarabine and cyclophosphamide (FCR). Single agentchlorambucil, splenectomy or splenic radiotherapy were used as indicated
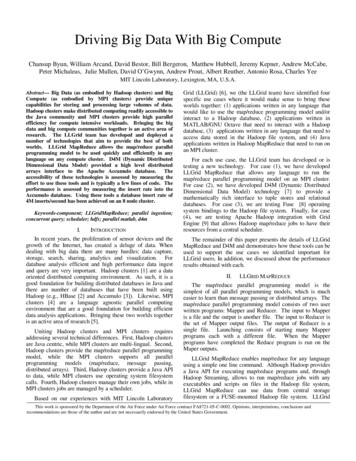
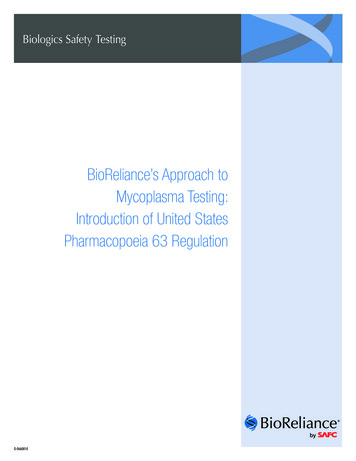
Wickenden et al. Diagnostic Pathology (2018) 13:74Polymer Detection System, Leica Biosystems, Wetzlar,Germany) for 10 min. For multiplex staining antibodies were used sequentially, first, anti-CD20 (1:100)(M0755, DAKO, Glostrup, Denmark), second antiPD1 (used undiluted) (ab52587, Abcam, Cambridge,UK) and lastly anti-Ki67 (1:100) (M7240, DAKO)antibodies were incubated with tissue sections for30 min at room temperature. Following incubationwith HRP conjugated goat anti-mouse-IgG (1:200)(P0447, DAKO) for 1 h at room temperature slideswere washed and incubated for 10 min at roomtemperature in the dark with Opal 520 (dilution 1:50)for anti-CD20, Opal 670 (1:100) for PD1 and Opal570 (dilution 1:50) for Ki67. After additional washesnuclei were counterstained with DAPI (D1306, ThermoFisher). A negative control slide, incubated withmouse IgG1 (X0931, DAKO) was included in eachstaining run. Images of the stained slides were recordedusing NanoZoomer-XR Digital slide scanner C12000–01 (Hamamatsu Photonics, Hamamatsu, Japan) and theimages were pseudo-coloured and merged by usingImageJ analysis software [16].ImmunohistochemistryIn order to identify specific T-cell subsets by multipleximmunohistochemistry (workflow illustrated in Fig. 1a)FFPE tissue sections were stained with anti-CD4 (4B12,DAKO) (1:80 dilution for 20 min), anti-PD1 (EuroMabNet, clone NAT105) (used undiluted for 60 min) andanti-FOXP3 (EuroMabNet, clone 236A) (1:100 dilutionfor 60 min) [17, 18]. For all antibodies antigen retrievalwas with Tris-EDTA pH 9. Peroxidase-coupled secondary antibody (MP-7452, Vector Laboratories, Burlingame, CA, USA) was employed with AEC-peroxidasesubstrate (SK-4205, Vector Laboratories). Tissue sectionswere processed through sequential staining and destaining (glycine (25 mM), 1% SDS, pH 2) following whichimage data was acquired and downstream processingcarried out. This involved registration of the separatelystained images followed by data analysis, which includesboth enumeration of stained cells and also spatial information i.e. co-ordinates of each cell (Visiopharm, Hoersholm, Denmark). All images that were taken forwardfor data analysis were carefully checked for successfulregistration. Persisting antibody from early rounds ofstaining could be a confounding factor and we, therefore, confirmed that the elution process reducedresidual staining to background levels (Fig. 1b). Visiopharm apps were developed (available on application tothe authors) to paint Tfh cells (CD4 PD1hiFOXP3 ) orange, Treg cells (CD4 PD1 FOXP3 ) yellow and Tfrcells (CD4 PD1hiFOXP3 ) turquoise (Fig. 1c and d)prior to extracting cell numbers and locationPage 3 of 10coordinates. An intensity threshold for the definition ofhigh PD1 expression was set by utilising PD1 expression of Tfh cells within tonsillar germinal centres fromhealthy subjects.Tissue sections from 6 cases (Fig. 2b) were stainedwith anti-CD20 (M0755, DAKO), anti-CD4 (M7310,DAKO), and anti-CD8 (M7103, DAKO). Surface plotsgenerated in ImageJ (https://imagej.net/Fiji) are shownfor each stain. Intensity has been normalised so that images can be compared.StatisticsDistance from either FOXP3 cells or PD1hi cells to thenearest Ki-67 cell was plotted for 105 cells sampled from10 cases. All clustering and spatial analysis was performed using the statistical programme R (Spatstat package [19] and ggplot2 package [20]).R was also used to determine Ripleys K function, ananalysis tool to quantify the spatial distribution observedfor each cell subtype as compared to complete spatialrandomness (CSR).Other statistical tests (Mann-Whitney, Kruskal Wallistests and linear regression) were carried out with Prism 6software (GraphPad Software, La Jolla, CA). Gene set enrichment analysis [21] ) was employed to analyse gene expressiondata from a publicly available database [22] under accession numbers GSE32233 and GSE32231.ResultsT-cell infiltration and T-cell gene expression signaturesTo gain an understanding of T-cell distribution in MZLmultiplex semi-automated immunohistochemistry wascarried out for CD20, CD4 and CD8. Whole tissue heatmaps show the density of infiltrating T-cells (Fig. 2a).These reveal T-cell zones comprising low numbers ofCD8 and abundant CD4 T-cells with clearly differingpatterns of spatial localisation.To provide support for the presence of activatedT-cells in the MZL TME we carried out gene set enrichment analysis on data from nodal MZL [22]. Twosignatures (GSE2770 - genes up-regulated in CD4 lymphocytes induced to differentiate into Th1 and Th2 bytreatment with IL-12 and IL-4 respectively in the presence of TGFbeta and GSE26928 - genes up-regulated ineffector memory T-cells as compared to CXCR5 T-cells) of polarised CD4 T-cells (Fig. 2b) were obtained (FDR 0.25). The tissue density maps and GSEAtogether suggest effector CD4 T-cells are present inthe tumour microenvironment.Quantitation of CD4 T-cell subsetsNext we used image analysis to overcome biased representation due to counting relatively small fields and
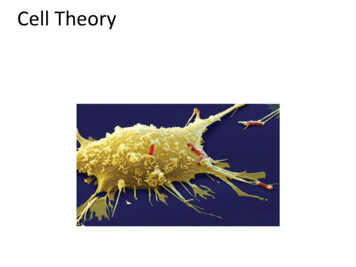
Wickenden et al. Diagnostic Pathology (2018) 13:74Page 4 of 10Fig. 1 Workflow for immunohistochemistry and image analysis. a Diagram of the immunohistochemical workflow. b Quantification of theefficiency of elution for three antibodies: anti-PD1, anti-FOXP3 and anti-CD4. Black bars represent antibody staining intensity (mean SEM)and gray bars represent staining intensity following elution. Each experiment was carried out three times. The dotted line is the background intensityproduced by an unstained tissue section. c Flow diagram to show Visiopharm methodology (www.visiopharm.com) used to analyse tissue sectionsstained sequentially with anti-CD4, anti-PD1 and anti-FOXP3 antibodies. The algorithm first identified cell nuclei by haematoxylin counterstainfollowing which CD4 expressing cells were marked green. Next CD4 expressing cells were interrogated for co-expression of FOXP3. There wasthen a branch point in the algorithm. If FOXP3 expression was detected but there was no co-expression of PD1 at a high level (PD1hi), aspreviously defined by comparison with tonsillar Tfh cells, then the cell was determined to be Treg and the nucleus was labelled yellow.However, if the cell co-expressed CD4, FOXP3 and was PD1hi then it was determined to be a Tfr cell and the nucleus was labelled turquoise.Cells that were CD4 expressing and PD1hi, but not FOXP3 expressing were determined to be Tfh cells and the nuclei were labelled orange.Cells of each subset were then counted digitally. d Identification of specific T-cell subsets by multiplex immunohistochemistry. Tissue sectionswere stained with anti-CD4, anti-PD1 (EuroMabNet, clone NAT105) and anti-FOXP3 (EuroMabNet, clone 236A). Example Tfh cell (CD4 PD1 FOXP3 )painted orange, Treg cell (CD4 PD1 FOXP3 ) painted yellow and Tfr cell (CD4 PD1 FOXP3 ) painted turquoise are presentedacquired similar quantitative information about infiltrating CD4 T-cell subsets (Tfh, Tfr and Treg).We defined Tfh cells as CD4 PD1hiFOXP3 , Tfrcells as CD4 PD1hiFOXP3 , and Treg cells as CD4 PD1 FOXP3 (Fig. 1c and d). Collectively these threepopulations accounted for 16.4 3.6% mean SEM)of total CD4 cells (n 8). Tfr cells represented onlya rare population accounting for 4.6 1.3% (mean SEM) of CD4 PD1hi and were not anlaysed further.We found strong associations between PD1hi andTfh cell numbers (R2 0.98; P 0.0001) and FOXP3 and Treg numbers (R2 0.64; P 0.017). Therefore,to facilitate this analysis and future translationallymphoma research we followed others in employingsingle markers, either PD1hi or FOXP3 [12, 23] assurrogates for Tfh and Treg subsets respectively(Fig. 2c).Total numbers of PD1hi and FOXP3 numbers variedover 20-fold with some cases having very much heavier T-cell infiltration than others (Fig. 3a). The ratio(PD1hi:FOXP3 ) also varied with activating PD1hi cellsthe majority in some cases whereas suppressive FOXP3 cells were dominant in others.Analysing SMZL, nodal and extranodal MZL separately showed no significant differences between overalldensity of PD1hi or FOXP3 cells or PD1hi:FOXP3 inthe three groups (Kruskal Wallis test) (Fig. 3b). Therewere also no significant differences in T-cell density or
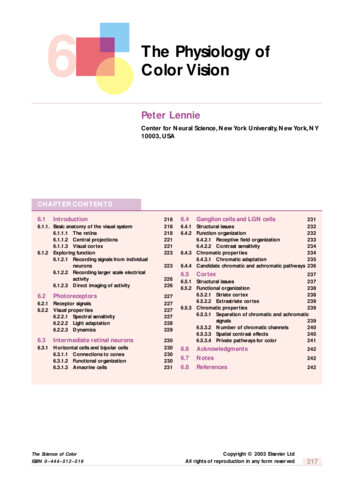
Wickenden et al. Diagnostic Pathology (2018) 13:74Page 5 of 10Fig. 2 Architecture of CD4 T-cell infiltration and T-cell gene signatures. a Tissue sections from 6 cases were stained with anti-CD20, anti-CD4and anti-CD8. Surface plots generated in ImageJ (https://imagej.net/Fiji) are shown for each stain. Intensity has been normalised so that imagescan be compared. T-cell zones are evident and whilst these comprised both CD4 and CD8 T-cells, CD4 T-cells were found at higher density in 4of 6 cases (#1, #2, #4 and #6). b Gene set enrichment analysis. Data from Arribas et al. (2012)5 was employed to discover T-cell signatures. Utilisinga false discovery rate (FDR 0.25) for exploratory work. Two gene signatures were found to be positively enriched in MZL. NES is normalisedenrichment score. c Support for use of PD1hi and FOXP3 as single surrogate markers of Tfh and Treg cells respectively. Numbers of Tfh and Tregcells, as defined (Fig. 1d), were compared against single marker expression of PD1hi and FOXP3PD1hi:FOXP3 when the cases were analysed by stage(Fig. 3c).Spatial distribution of T-cellsNext, we chose to explore the spatial distribution of infiltrating PD1hi and FOXP3 cells, having observed various patterns of CD4 T-cell infiltration (Fig. 2a), inorder to determine whether these cells are randomly distributed or clustered. Ripley’s K test, was applied to datafrom whole tissue sections (mean area 50.7mm2, range4.8–112 mm2) (n 15) (Fig. 4a). Overall we found thatPD1hi cells were significantly more clustered i.e. greaterseparation of observed curve (solid black lines in Fig. 3a)from CSR (dotted red lines), than FOXP3 cells (mediancluster score 1.84 for PD1hi cells and 0.45 for FOXP3 cells; Mann-Whitney test P 0.003) (Fig. 4b).Tfh cells strongly drive B-cell proliferation and evenextra-nodal CD4 PD1hi T-cells are able to secrete factorsenabling B-cell help [24]. We hypothesised that thePD1hi cells might associate with proliferating lymphomaB-cells. To support this idea we first carried out immunofluorescence microscopy on a single case (Fig. 4c).This showed that proliferating Ki-67 cells were predominantly B-cells and formed clusters but without thestructure of normal or residual germinal centres. Therewas also an apparent association between areas with ahigh density of proliferating cells and PD1hi cells. Inorder to support the hypothesis that PD1hi cells associate with Ki-67 lymphoma B-cells we quantified thespatial interaction between Ki67 cells and Ki67 PD1hiT-cells. Cell co-localization was objectively determinedby virtually tessellating stained tissue sections intonon-overlapping equally sized quadrants prior to cellcounting within each defined spatial area [25]. Two measures, Pearson correlation and Morisita-Horn index, anecological measure of interaction (illustrative examples
Wickenden et al. Diagnostic Pathology (2018) 13:74Page 6 of 10Fig. 3 Automated quantitation of marker proteins. a Automated quantitation of PD1hi and FOXP3 cells in 15 cases of MZL. Numbers above barsrepresent PD1hiFOXP3 ratio. b Analysis of cell density data and PD1hi:FOXP3 ratio by type of MZL: nodal, extranodal or splenic. Box and whiskerplots show median, 90th and 10th centile. c Analysis of cell density data and PD1hi:FOXP3 ratio by stage of disease, either early stage (I and II) oradvanced stage (III and IV)Fig. 5a), were employed to analyse data from 17,000200μm2 quadrants from 10 patients. Ki67 and PD1hicells demonstrated closer interaction than did Ki67 andFOXP3 cells (Pearson correlation 0.4 vs 0.03; MorisitaHorn index 0.46 vs 0.25, Fig. 5b). To further interrogatespatial interaction we compared the distance betweenPD1hi or FOXP3 cells and the nearest Ki67 cell in anearest neighbour analysis. Ki67 PD1hi cells (mediandistance 11.3 μm) were significantly more likely to befound in close proximity to Ki67 B-cells than wereKi67 FOXP3 cells (median distance 35.1 μm) (Mann-Whitney test P 0.0001) (Fig. 5c) suggesting for thefirst time that infiltrating Tfh cells might have a role indriving proliferation, and hence contribute to the varyingclinical course of MZL.DiscussionIn this report we demonstrate unexpected architecturalcomplexity within MZL, defined by the analysis of singlesurface markers, PD1, representing Tfh cells and FOXP3,representing Tregs. Infiltrating CD4 T-cell subsets havebeen studied by others in follicular lymphoma and thedistribution of cells in relation to the follicle associateswith clinical characteristics [26]. MZL shows histologicalheterogeneity: while some cases show a diffuse patternof infiltration in others a follicular pattern is observed.Residual germinal centres, which are presumed to benormal reactive follicles, are also a feature of MZL. Residual germinal centres show the characteristic featuresof a polarised structure with BCL6 expressing proliferating B-cells in the dark zone and Tfh cells within the lightzone. A limitation of our study is that we cannot entirelyresolve the issue of whether the Tfh clusters we observerepresent residual germinal centres. Inspection of thePD1 stained slides suggested that, in our series therewere relatively few residual germinal centres and, therefore, our data supports the notion that Tfh clusters are afeature of the lymphoma but does not definitively exclude the possibility that some clusters are due to residual germinal centres. This study also prompts further
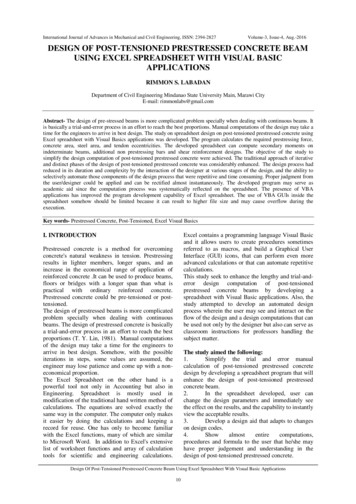
Wickenden et al. Diagnostic Pathology (2018) 13:74Page 7 of 10Fig. 4 Clustering of PD1hi cells. a Left hand panels are density plots representing PD1hi (top) and FOXP3 (bottom) for one case (lymph nodetissue). The impression of greater clustering of PD1hi cells is confirmed by statistical analysis using Ripleys K function (right hand panels). Ameasure of distance (r) on the x-axis is plotted against K(r) function on the y-axis. The curve for complete spatial randomness (CSR) (dotted redline) is compared to K function for MZL (solid black line) for PD1 (upper panel) and FOXP3 (lower panel). Greater upward deflection of theobserved curve compared to CSR represents greater clustering with the difference between these curves calculated to provide an overall clusterscore. b Cluster scores for MZL cases (n 15). PD1hi cells are significantly more clustered than FOXP3 cells (Mann-Whitney test, P 0.01). cImmunofluorescence images. CD20 (green), Ki-67 (blue) and PD1 (red) staining of a lymph node from a patient with MZL. Low power (10 ) viewsof the merged antibody stains show that proliferating cells occur in clusters. Three fields are shown as high power views (80 ). Two of thesefields are from regions that contain a high density of Ki-67 cells (upper and lower rows) while the middle row is from a region of lowerKi-67 densityquestions about possible extra layers of complexity inthe structure of MZL, which lie outside the scope of thiswork. For example, could Tfh clusters be associated withresidual germinal centres?In order to determine whether patterns of cell distribution are non-random analysis has to be carried outacross whole tissue sections using an unbiased biostatistical approach. The number of patient cases in this studyis low and we cannot, therefore, make definitive statements about the spatial characteristics of infiltratingT-cells in a disease as diverse as MZL. However, usingautomated techniques we determined spatial characteristics over large areas and taking into account data from106 cells (Fig. 5c) this allows robust and statistically significant conclusions to be drawn and, in turn, this allowsus to generate hypotheses about the role of infiltratingT-cells in MZL.CD4 T-cell subsets are characterised by multiple surface markers, cytokine production and transcriptionfactors. Supported by the work of others [23] who demonstrated that PD1 was highly expressed only on Tfhcells in follicular lymphoma we have used PD1hi as a single marker to define Tfh cells. Both Treg and Tfr populations express FOXP3. We are interested in translatingour work into the clinical laboratory and, therefore, wechose to employ immunohistochemistry for the bulk ofthe work described here although our observation ofpossible interaction between PD1hi cells and B-cells wasmade by immunofluorescence microscopy.We showed good correlation between single markerand multiplex immunohistochemistry (Fig. 2c) and choseto employ single markers because the simplicity of thismethodology will facilitate future studies involving largernumbers of patients. We show the feasibility of mapping
Wickenden et al. Diagnostic Pathology (2018) 13:74Page 8 of 10Fig. 5 PD1hi cells cluster with Ki-67 cells. a Illustrative cartoon depicting low and high interactions with the respective Pearson correlation andMorisita-Horn index for both patterns. b Spatial interaction between FOXP3 or PD1 and Ki-67 cells. Scatter plots displaying Ki67 against PD1hicells (upper panel) and FOXP3 cells (lower panel) measured in spatial quadrants (200μm2). Only quadrants containing at least 5 cells of anypopulation are displayed. Quadrants containing higher densities of both cell types ( 50 cells) were considered to represent high interaction.11.3% of all quadrants analysed for Ki67 and PD1hi cells met this definition of high interaction compared to only 1.6% of Ki67 and FOXP3 cells.Analysis was repeated for different sized quadrants (100 and 400μm2) confirming similar results. c Nearest neighbour analysis. Distance fromeither FOXP3 cells (upper panel) or PD1hi cells (lower panel) was plotted for 105 cells sampled from 10 cases. For PD1hi cells the large peakoccurring at short distances to the nearest Ki-67 cell indicates that these cells are closer to Ki-67 cells than FOXP3 cells, which are more evenlydistributed. All clustering and spatial analysis was performed using the statistical programme Rthe spatial architecture of T-cell infiltration in MZL butthe clinical impact of our findings in MZL, and possiblyother low-grade B-cell lymphoma subtypes, needs testing prospectively. Importantly, we suggest the hypothesisthat Tfh cells have a role in driving B-cell proliferationin MZL. This idea is compatible with the biological roleof normal Tfh cells, which are required for driving B-cellproliferation [27] and antibody production [28] and alsosupports evidence for Tfh involvement in follicularlymphoma [29, 30].ConclusionsOur data suggests that CD4 T-cell subsets other thanTfh cells are present in the tumour microenvironmentof MZL warranting further studies characterising theseand establishing their biological and clinical significance.The mechanisms determining tumour ecology in MZLare unclear but a testable hypothesis is that the specificmutational spectrum of the B-cell lymphoma influencesthe character of T-cell infiltration in the TME. Overallcombining spatial characterisation and genomic features,such as IgVH repertoire and KLF2 mutational status[31], might identify MZL patients with poor outcomesand help to define effective treatments.AbbreviationsCSR: Complete spatial randomness; MZL: Marginal zone lymphoma;Tfh: Follicular helper T-cell; Tfr: Follicular regulatory T-cell; TME: Tumormicroenvironment; Treg: Regulatory T-cellFundingNN and ALW were supported by the Leicester Haematology Research Fundand the Hope Fund for Cancer Research. SM was supported by a PhDstudentship from the Government of Iraq.
Wickenden et al. Diagnostic Pathology (2018) 13:74Availability of data and materialsAll data generated or analysed during this study are included in this publishedarticle. The Visiopharm app is available on request to the authors.Authors’ contributionsKW designed and carried out experiments. NN, SM, ALW carried out experiments.DK designed essential software. MJA analysed the data and wrote themanuscript. SDW wrote the manuscript. All authors read and approvedthe final manuscript.Ethics approval and consent to participateResearch involving human material was performed in accordance with theDeclaration of Helsinki. Tissue samples were obtained from Leicester RoyalInfirmary. Tonsil material was obtained after informed consent was taken(Research Ethics Committee (REC) number 09/H0406/42). No consent wasnecessary for using material from lymphoma patients. The study usedsurplus archival tissue from lymphoma patients in line with the exemptionfrom consent outlined in The Human Tissue Authority code of practice (Para41 HTA code of practice section 9), which allows for research upon tissue tobe conducted without consent if part of a research project approved by arecognised REC (Health Research Authority (HRA) National Research EthicsService (NRES) Committee East Midlands REC number 14/EM/1176).Consent for publicationNot applicableCompeting interestsThe authors declare that they have no competing interests.Publisher’s NoteSpringer Nature remains neutral with regard to jurisdictional claims in publishedmaps and institutional affiliations.Received: 4 June 2018 Accepted: 3 September 2018References1. Zinzani PL. The many faces of marginal zone lymphoma. Hematology AmSoc Hematol Educ Program. 2012;2012:426–32. https://doi.org/10.1182/asheducation-2012.1.426.2. Du M-Q. MALT lymphoma: genetic abnormalities, immunologicalstimulation and
Numbers and pattern of T-cell infiltration have been demonstrated to correlate with some clinical characteris-tics in follicular lymphoma [12] and diffuse large B-cell lymphoma [13] and biologically this might be associated with their effects on B-cell proliferation: either activation (Tfh cells) or inhibition (Tregs). There are also recog-