Transcription
Data Portraits: Aesthetics and AlgorithmsbyAlexandru C. DragulescuBS, Cinema and Photography, Ithaca College (2000)MFA, Visual Arts, University of California at San Diego (2005)Submitted to the Program in Media Arts and Sciences,School of Architecture and Planningin partial fulfillment of the requirements for the degree ofMaster of Science in Media Arts and Sciencesat theMASSACHUSETTS INSTITUTE OF TECHNOLOGYSeptember 2009c Massachusetts Institute of Technology 2009. All rights reserved. Author . . . . . . . . . . . . . . . . . . . . . . . . . . . . . . . . . . . . . . . . . . . . . . . . . . . . . . . . . . . . .Alexandru C. DragulescuProgram in Media Arts and Sciences,School of Architecture and PlanningSeptember, 2009Certified by . . . . . . . . . . . . . . . . . . . . . . . . . . . . . . . . . . . . . . . . . . . . . . . . . . . . . . . . .Judith DonathAssociate Professor of Media Arts and SciencesThesis SupervisorAccepted by. . . . . . . . . . . . . . . . . . . . . . . . . . . . . . . . . . . . . . . . . . . . . . . . . . . . . . . . .Deb RoyChair, Department Committee on Graduate Studies
2
Data Portraits: Aesthetics and AlgorithmsbyAlexandru C. DragulescuSubmitted to the Program in Media Arts and Sciences,School of Architecture and Planningon September, 2009, in partial fulfillment of therequirements for the degree ofMaster of Science in Media Arts and SciencesAbstractWhile interacting online, one generates a multitude of personal data trails, both textual andbehavioral. The data portrait is a way to collect, condense and represent these informationtrails, which are often time consuming and tedious to find and grasp when read linearlyacross web pages or domains, into an easy, legible, and compelling visualization.This thesis presents various data portraiture techniques that generate both individualand collective portraits of users participating in online social media. The data used in generating the portraits are unstructured text and publishing timestamps of Twitter micro-blogposts, as well as aggregate RSS feeds from FriendFeed. The strategies for depicting people’s online personas explored in this thesis focus on the compression, mapping and visualrepresentation components of the visualization pipeline. The resulting portraits attempt tomaintain a tight connection with the data, and be legible to viewers, but at the same time,venture to explore more expressive visual forms, and engage with the evolving aestheticsof cinematography, typography and animation.Thesis Supervisor: Judith DonathTitle: Associate Professor of Media Arts and Sciences3
4
Data Portraits: Aesthetics and AlgorithmsbyAlexandru C. DragulescuThe following served as a reader for this thesis:Thesis Reader . . . . . . . . . . . . . . . . . . . . . . . . . . . . . . . . . . . . . . . . . . . . . . . . . . . . . . . . . . . . . . . . . . . . .Caroline JonesDirector, History, Theory and Criticism SectionDepartment of ArchitectureMIT5
6
Data Portraits: Aesthetics and AlgorithmsbyAlexandru C. DragulescuThe following served as a reader for this thesis:Thesis Reader . . . . . . . . . . . . . . . . . . . . . . . . . . . . . . . . . . . . . . . . . . . . . . . . . . . . . . . . . . . . . . . . . . . . .Martin WattenbergDirector, Visual Communication LabIBM7
8
AcknowledgmentsI am very grateful to my advisor, Judith Donath, for her inspiring classes, guidance, invaluable insight and critique.Many thanks to my readers, Caroline Jones and Martin Wattenberg, for their thoughtfulcommentary and critique.Thanks to Yannick Assogba, Luis Blackaller, Drew Harry, Kate Hollenbach, Ana LuisaSantos and Aaron Zinman, my colleagues and best friends at the lab.Thanks to Aaron Blankstein, Don Goldin, Joe Tennent, Jenny Chan and Tuan Huynh fortheir dedication and contributions in the implementation stage.Thanks to Linda Peterson for her guidance and patience. Thanks to all the students, facultyand staff for making the Media Lab such an unique research environment.This thesis is dedicated to my soul mate, Laura, my parents, Elena and Emilian, and mysister, Liliana. Thank you all, for your love.9
10
Contents1 Introduction132 Background and Related Work172.1Related Work . . . . . . . . . . . . . . . . . . . . . . . . . . . . . . . . . 182.2Portraiture and the Mechanical Artist . . . . . . . . . . . . . . . . . . . . . 202.2.1Metaphor . . . . . . . . . . . . . . . . . . . . . . . . . . . . . . . 232.2.2Words . . . . . . . . . . . . . . . . . . . . . . . . . . . . . . . . . 252.2.3Time . . . . . . . . . . . . . . . . . . . . . . . . . . . . . . . . . 263 Designing Data Portraits3.129Process: Portraiture with Motion and Typography . . . . . . . . . . . . . . 293.1.1Pre-visualization: Getting to Know the Data . . . . . . . . . . . . . 293.1.2Twelve Typographical Devices . . . . . . . . . . . . . . . . . . . . 313.1.3Sketch: Keyframes . . . . . . . . . . . . . . . . . . . . . . . . . . 383.1.4Sketch: Waveforms . . . . . . . . . . . . . . . . . . . . . . . . . . 403.1.5Sketch: Depth of Field . . . . . . . . . . . . . . . . . . . . . . . . 463.1.6Wordtraces: Transition to Animation . . . . . . . . . . . . . . . . . 473.1.7Sketch: Clocks . . . . . . . . . . . . . . . . . . . . . . . . . . . . 503.2Amoeba . . . . . . . . . . . . . . . . . . . . . . . . . . . . . . . . . . . . 533.3Lexigraphs . . . . . . . . . . . . . . . . . . . . . . . . . . . . . . . . . . 593.4Data Ghosts . . . . . . . . . . . . . . . . . . . . . . . . . . . . . . . . . . 624 Collective Portraits6511
4.1Lexigraphs . . . . . . . . . . . . . . . . . . . . . . . . . . . . . . . . . . 664.2Cityscape . . . . . . . . . . . . . . . . . . . . . . . . . . . . . . . . . . . 664.3Ecosystem Simulation . . . . . . . . . . . . . . . . . . . . . . . . . . . . 715 Critique796 Conclusion and Future Work85Appendix: Critic Biographies89Bibliography9112
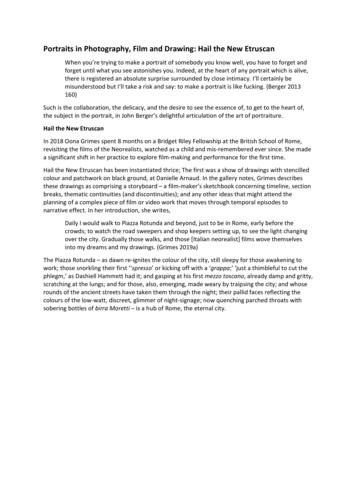
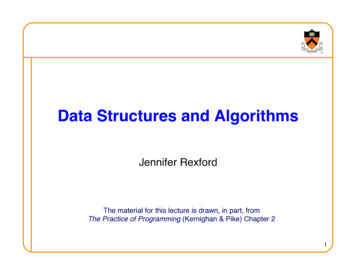
Chapter 1IntroductionPrior to coming to the Media Lab, my projects have revolved around creating artworkswith data and algorithms (Fig 1-1). In Blogbot [14], text extracted from blog posts relatedto the Iraq war and appropriated video game assets were rendered automatically into experimental graphic novels. Together with Tim Jaeger, I created Respam [15], a series of audioand visual compositions driven by the rhythms and contents of junk emails. These performances presented a dystopic information society, overloaded by advertising and plaguedby consumerism, phishing and fraud. The same unwanted email messages provided therhythms that generated virtual structures for the Spam Architecture Series [16].My intentions have always been to find and give form to data, or to sculpt with data, inorder to provoke the audience to think about this new material that has become so pervasivein our lives. Daily we consume and generate vast quantities of data. In online communications, data is the material that composes our digital personas, projections of our real selvesin a mediated world.In this thesis, I extend my previous work by exploring ways to represent and renderour “data bodies”. Our data bodies are formed by the multitude of information traces weleave behind while communicating online. Some of this data is public, while some of it isprivate. Some of it resides on the client side – on our mobile phones and computers, whilesome resides replicated on nodes in the computing cloud. We are often not aware, or we donot pay enough attention to whom else this data is visible.This thesis is organized as follows. Chapter I, Background and Related Work, discusses13
the motivation behind the concept of data portraits as a means for evoking our data bodies,and describes my approach into this relatively new research area. I give a brief history ofportraiture, highlighting milestone moments and shifting trends. I then discuss the functions of the traditional portrait, as well as the data portrait, and present related work fromdesign, photography, and information visualization projects.The main body of this work is discussed in Chapters 3 and 4. Chapter 3, Designing DataPortraits presents sketches and explorations that use typography and motion to condensean individual’s micro-blog into a static or animated portrait. This chapter shows a series oftypographic strategies and visualizations metaphors that are used in the final instantiationsof the data portraits.Chapter 4, Collective Portraits, presents data portraiture techniques that are re-purposedin the context of one’s social network. Audiences can now contrast and compare a multitudeof portraits synchronized in an unique timeline, as well as observe semantic interactions inan ecosystem of Twitter users.Chapter 5, Critique, summarizes the results of a critique session with my thesis readers,and presents the outcome of informal interviews with museum visitors who experiencedsome of the collective data portraits. Finally, Chapter 6 concludes with directions for futurework.14
Figure 1-1: Sculpting with data, previous work: top: Blogbot, software for generatingexperimental graphic novels; bottom left: Spam Architecture, Structure 11, digital print;bottom right: Respam, audio visual performance.15
16
Chapter 2Background and Related WorkIncreasingly we spend our lives in electronic habitats: e-mail, RSS feeds, Facebook, Twitter, online shopping and banking. Our presence in these habitats is a projection of our realselves and is manifested and perceived by the textual or behavioral data we generate whiledwelling in these environments. This data might be open for read access to all other users,or it may be protected from other users, but readable and shareable by the commercial entities owning the channels of communication. Most of the time, the data streams we generateare social, they are intertwined and interconnected with other users’ information, and mostimportantly, they reside on commercially-owned servers. Hence, the question of Who ownsthe data? is a difficult one to answer [40]. Because of the fuzzy ownership of data, andthe access control concerns, the question of How do we capture and portray our onlinepersonas? becomes an interesting and beneficial issue to investigate.The data portrait is a way to collect, condense and represent a multitude of substantialpersonal information trails, that are time consuming and tedious to find and grasp when readlinearly across web pages or domains, into an easy, legible and compelling visualization.As such, the data portrait can increase awareness, allowing users to understand how theyproject themselves in online habitats, or in other words, how others perceive them, and whatinformation is available and stands out about them. In addition, the data portrait could alsoserve as instrument of reflection on social relationships and interpersonal exchanges, aswell as personal narratives and histories.The design of these data portraits requires an interdisciplinary approach, which finds17
itself at the intersection of many domains such as information retrieval, natural languageprocessing, design, aesthetics and visualization. The data portraiture techniques developedfor this thesis have the goal of maintaining a tight connection with the data, and be legibleto viewers, but at the same time, venturing to explore more expressive visual forms, andengage with the evolving aesthetics of cinematography, typography or animation. Thisthesis concerns itself more with the mechanics of how to represent online personas anddoes not attempt to exhaustively make use of all possible types of data. Furthermore, itreflects on the data portrait as an artistic genre in the light of traditional portraiture.2.1 Related WorkThe first text and visualization work that mentions and proposes the concept of data portraitis PeopleGarden: creating data portraits for users [39]. In the context of Usenet groups,message boards and chat rooms, Judith Donath and Rebecca Xiong ask the question Howcan we compactly convey information about these participants to each other? The answeris using data portraits, an abstract representation of users’ interaction history:”In real life, successful portraits show the physical likeliness of people; theyalso use objects in people’s lives to illustrate their interests and status. Thissecond aspect is an inspiration for our work. The on-line equivalent of one’sobjects is data about one’s past interactions.”PeopleGarden used a flower metaphor for the portrayal of users, and a garden metaphorfor representing the whole group. Various communication patterns are highlighted throughthe use of colors, the number of petals or the length of the stem. PeopleGarden’s goal wasto facilitate forming a mental image of an individual’s participation in an online interactionenvironment and help answer questions such as: Do participants here really get involved? (Post frequently or only once in a while?) How much interaction is there? (Do people respond to each other?) Do participants here welcome newcomers? (Do newcomers get many replies?)18
Who are the experts? (Who has been here for some time or posted many messages?)Themail [33] is an email archive visualization that portrays relationships between individuals. As a data portrait, the focus is more on the relationship than the individual, however, the presence of topical patterns characterize and create impressions of people throughtheir information history. Themail is an interactive tool meant for reflection on past conversations and events, and allows the user to gain insight on the evolution of relationships.It uses typographical devices for representation, and text analysis to filter large quantitiesof data, similar to the techniques used in the data portraits proposed by this thesis.What the World Eats [26], a photo essay on the Time magazine’s website shows theitems on the dinner table of fifteen families around the globe. The photographs are extractedfrom Peter Menzel’s book Hungry Planet [27]. These images are a fantastic example ofdata portraits. Besides the photographic likeness of the individuals in a family, there is amultitude of additional data: the quantity, types and diversity of food, the decoration intheir home, the clothes they are wearing, the size of the family. There is also informationabout the weekly expenditure for food, as well as their favorite food or recipe. The audienceis left to infer from this data impressions and characteristics of the portrayed individuals.Looking across these portraits, the audience can reflect on globalization, or health concerns.For example, there is a strong contrast between the packaged food of families from theindustrialized world and the bulk foods of families from rural areas or developing nations.A day in brands [5] is a visualization of daily services and products usage by AnaBierzanska. This is one of the many instances of an exercise first created by an Account Executive at an advertising agency who blogged anonymously at the now defuncthttp://dearjanesample.wordpress.com/. The logos are arranged in groups and ordered bytime. There is a large variety of products from toothpaste, toothbrush, clothing, drinks,software applications, phone and computer hardware, to media outlets. Actions are decoded via the type of product or service and the time of day of use. Again, data is used as aintermediary for creating an impression, a mental image about what the person behind theportrait might be like. For example, from the type of software she is using, we can inferthat she is a designer or digital media maker. This self-portrait is also a vehicle for fashion statements, from clothing brands to the use of open-source applications like Firefox or19
VLC.Wish Lists [31] is a series of forty inkjet prints on paper created by Kelly Sherman. Thecontent of the prints consists of wish lists found on the Internet. The entries are printedorderly, left-aligned and minimalistically displayed as a vertical list. At the top of thelist there is the name of the author or a generic name such as Family #13. The itemsdescriptions vary, from really specific products, such as Little Tikes Cookin’ Fun InteractiveKitchen Set to very generic ones: baby doll - any. Through these pieces of information, theaudience tries to deduct age and gender, imagine character traits or narratives, eventuallyreconstructing the persona of the author.The Feltron Annual Reports [19] are a series of yearly compilations of personal statisticsby designer Nicholas Felton. These highly designed and typographically elegant brochuresare a form of data self-portrait. Their form is transplanted from the contemporary corporateculture, where companies give shareholders a report on financial performance and futuredirection. Felton keeps track of many types of data: the number and brands of beers, thenumber of vacation days, the average daily subway traveled miles, the weight gain, thenumber of burglars confronted, the countries traveled to, the ten most listened to musicartists, the best wedding attended. Information is displayed using infographics devicessuch as line charts, pie charts and maps.2.2 Portraiture and the Mechanical ArtistSimilar to traditional portraits, the role of the data portrait is to create an evocative representation of an individual. It is therefore important to discuss the similarities and differencesbetween the two genres and understand how the latter registers and distinguishes itself inthe broader context of portraiture.Joanna Woodall, the editor of Portraiture, Facing the Subject [38], a collection of essays on portraiture, delineates various paradigms in the history of portraiture in westernart. Central to western art, is the idea of likeness and naturalistic portraiture, where physiognomic similitude represents identity. Across time and geography, this idea had variousdegrees of adoption. In the medieval period, identity was not represented through likeness,20
but through symbols of status and position, such as a blazon, or coat of arms. The realistportrait emerged at the beginning of the fifteenth century, introduced by the early Flemishpainters, and perfected by Jan Van Eyck. It is characterized by ”the adoption of intenselyillusionistic, closely observed facial likeness, including idiosyncrasies and imperfections”.In the sixteenth century, artists in Italy ”reconciled attention to the physiognomic peculiarities of the subject with more generalizing visual devices, such as the profile view (especiallyfor women) or the analysis of face and body in smooth, consistently lit geometrical shapes.Such techniques were traditionally understood to attribute universal and ideal qualities tofigures.”The need for scientific likeness was materialized with the advent of photography. Furthermore, as Freud’s writings on psychoanalysis became widespread, artistic explorationshifts from depicting the external appearance, towards investigating and portraying thesubconscious and the interior life of the subject. In the early twentieth century, naturalistic portraiture is further subverted by the experimentation with non-figurative paintingand sculptural techniques. The dynamic between artist and sitter has also changed dramatically during this period. Whereas in the Renaissance era the power dynamic was clearlydictated by the patron who commissioned the portrait, the beginning of the twentieth century marks the act of commissioning being seen as an act of submissiveness, detrimental toartistic creativity. The portrait refers now more to the identity and aura of the artist, whilethe sitter becomes secondary [38].Data portraiture follows in the tradition of modern and contemporary art, where therelationship between artist and subject becomes much more diluted. The act of commissioning is more mechanical and symbolical: in the case of Lexigraphs (see Chapter 3),Twitter users will enter their login name into a form. Knowing each individual and portraying it separately is impossible: the vast and daily expanding data needs to be synthesizedby algorithm. The actual data portrait is rendered by the intermediary mechanical artist,a program or a collection of programs that materialize the will of the artist/programmer.The mechanical artist blurs the lines between art material, art instrument, art experienceand art object. It also subverts the power relationship between sitter and artist: the representation of the subject’s identity is controlled now by the program. The software is one21
part material: the electronic canvas is the support on which the portrait manifests itself,and the interface is an integral, ”tangible” component of the data portrait that allows forexploration; and one part instrument: it contains the code that collects and generates thefinal art object/experience.Unlike paint or marble, data is fluid, processable and malleable. Through code, data canbe infinitely sculpted and layered into various forms and can be interactively experiencedby the sitter or audience. Precisely because of these qualities of data, the artistic processof algorithmic creation in general, and data portraiture specifically, is very different fromits traditional counterpart. In creating portraits, a traditional artist would use additive orsubtractive processes. In data portraiture, the process of evoking ones persona is nowiterative. The artist starts by looking across the data (see Section 3.1.1) and experimentswith algorithms of extraction and representation of facets of one’s data body (see Chapter3). The artist has less control on the output and result of each portrait. The subjects areevoked through broad, general algorithmic gestures as opposed to sitter-specific, carefullyplaced brush strokes.The goal for the data portraits is to allow the subject to observe how facets of the onlineself are portrayed, and compare with the depiction of others through the same lens. Assuch, customizing and tweaking individual portraits (shape, speed) is not desired, so as toallow an audience to observe the same mapping across portraits. An artist’s point of view,or commentary is automatically embedded through subjective selection of various portrayalstrategies, as well as the choice of metaphor, or filtering and condensing algorithms.The algorithms in data portraiture are in a sense recipes that emulate to a certain degreethe capacity for evaluating one’s persona by reading through the flat data. The tensionsbetween portraiture and scientific visualization emerge during this process, as data portraiture is situated at the intersection of these two fields. The key decisions of the dataportraiture pipeline allow for trade-offs between subjectivity and expressivity on one side,and legibility and recognizability on the other side: Choice of algorithm, and parameters: How do we compress the data? What do wechoose to show? How do we filter out noise?22
Data mapping: How are the quantities and attributes of the data expressed? Is thisa simple mapping that is immediately legible (e.g., size of type denotes frequency,opacity denotes presence or activity)? Does it require a legend or an explanation ofthe mapping? Metaphor and rendering style: How do we visually represent the data and patterns?Is it abstract (e.g. using lines and color) or do we use a metaphor (e.g. silhouette,clock) to arrange the data?2.2.1 MetaphorThe metaphor is well known as a literary device employed by poets. However, we areoften unaware of the crucial role metaphors play in our perception and day-to-day living,as exposed by George Lakoff and Mark Johnson in their book Metaphors we live by [23]:”The concepts that govern our thought are not just matters of the intellect.They also govern our everyday functioning down to the most mundane details.Our concepts structure what we perceive, how we get around in the world, andhow we relate to other people. Our conceptual system thus plays a centralrole in defining our everyday realities. If we are right in suggesting that ourconceptual system is largely metaphorical, then the way we think, what weexperience and what we do every day is very much a matter of metaphor.”Structural metaphors allow us to understand an abstract idea through another conceptthat is more clearly grounded and delineated in our experience. We borrow them from onedomain of experience to characterize and understand concepts in other domains. Orientational metaphors are based on our physical spatial interaction with our environment andnavigating the real world with our bodies. Containers, paths, center-periphery, force, links,balance are central to orientational metaphors. For example, ”Happy is up; sad is down”.Our language reflects what we experience physically through our bodies and how our bodies, in this case, posture, reflect emotional state: ”That boosted my spirits. You’re in highspirits. Thinking about her always gives me a lift. I’m feeling down. I’m depressed. Myspirits sank.”23
The data portraits at the center of this thesis, are using both structural and orientational metaphors as a mechanism to facilitate perception, but also as a vehicle for artisticstatement. Chapters 3 and 4 show explorations of how personal data can be imagined andrepresented through the use of various metaphors. One’s collection of information tracesand artifacts is imagined as a human body (Sections 3.3 and 4.1), a clock (Section 3.1.7), acellular organism (Sections 3.2 and 4.3), or as architecture (Section 4.2).”The reason we have focused so much on metaphor is that it unites reasonand imagination. Reason, at the very least, involves categorization, entailment,and inference. Imagination, in one of its many aspects, involves seeing onekind of thing in terms of another kind of thing – what we called metaphoricalthought. Metaphor is thus imaginative rationality.” [24]Finding the right metaphor is challenging. Some metaphors will highlight certain aspects of the concept meant to be illustrated or understood, while at the same time hideothers. For example, a clock is great for representing rhythmical data, but it might be toomechanical to illustrate an individual. The qualities of the visualized data need to be takeninto account when employing metaphors. Can a piece of data be considered solid andperpetual, so that it can be portrayed as the building block for a physical structure or anarchitectural fragment? Metaphors may have rich and complex associations and interpretations, some of them experiential and some cultural, which might not reflect the traits ofthe data, or might help infer undesirable qualities. On the other hand, the large spectrumof social data needed to be visualized might not be entirely characterizable by the chosenmetaphor. Judith Donath writes on the perils of metaphor scope or coverage, critiquing thePeopleGarden visualization [39] that used a garden of flowers as a metaphor to representUsenet users [12]:”The flower imagery is highly evocative, which is both its appeal and itslimitation. Gardens are organic, we associate them with life, beauty, freshness.This imagery is fine when the visualization is of, say, a welcoming supportgroup. It seems jarringly inappropriate for depicting dry technical announcements or vitriolic flame wars.”24
2.2.2 WordsThe information sources for the data portraits presented in Chapter 3 are the RSS feedsof Twitter micro-blogs. The two components of interest are the contents of the post: theraw unstructured text, together with the publishing timestamps. The goal is to extract andrepresent patterns in the text by filtering and compressing the original content. Becauseof the limited message length of 140 characters, micro-blog users are already doing a firststage of compression by trying to communicate ideas succinctly, using a small number ofwords.Twitter users are supposed to answer the question What are you doing? but the range ofmessages show a large variety of uses. Some of the posts describe present or past actions,while other are observations or musings. Some posts are replies in conversation threadswith one or multiple users, while others simply link to photos, or other websites.Text analysis research [28] has shown that ”the words people use in their daily livescan reveal important aspects of their social and psychological worlds” and that ”particles,which serve as the glue that holds nouns and regular verbs together, can serve as markersof emotional state, social identity, and cognitive styles.”By using word frequency/counts or more sophisticated filtering techniques like tf-idf[30], the Lexigraphs series, discussed in Chapter 3 builds a collection of relevant wordsfor a certain user which are then employed to render the portrait. The portrait only filters,condenses and attempts to replay behavioral rhythms, while the task of judging, comparingand extracting gist is left to the audience. In Designing Visualizations of Social Activity:Six Claims [17], Thomas Erickson argues that visualization should allow user to interpretinformation and suggest rather than inform:”Our response is that accurately presenting information is not the point of a social visualization; its primary role is to provide gist for inferences, and, in fact,it is less important that the inferences are correct. Our users have proved verycomfortable with making best guesses from incomplete information. Thus, itis OK to distort activity, to magnify small amounts of activity, and to dampenlarge amounts of activity; for example, it is much more important for users to25
be able to tell whether there are 3 or 7 people present, than whether there are103 and or 107 present. Ideally, the ambiguity of the visualization should beclear to users.”In other text visualizations, like the State of the Union Address in Words [36], the wordsare mapped into charts and the actual words appear only in the legend. In contrast, thewords are an essential part of the portraits put forth by this thesis. There are both advantagesand
Data Portraits: Aesthetics and Algorithms by Alexandru C. Dragulescu BS, Cinema and Photography, Ithaca College (2000) MFA, Visual Arts, University of California at San Diego (2005) Submitted to the Program in Media Arts and Sciences, School of Architecture and Planning in