Transcription
Cluster AnalysisJohann BacherChair of SociologyUniversity Erlangen-NurembergFindelgasse 7-9D-90402 NurembergNuremberg, 2002Note: Do not quote without permission of the author.1
ContentsChapter 1: Overview and Examples1Chapter 2: Transformation of Variables21Chapter 3: Dissimilarity and Similarity Measures29Chapter 4: Hierarchical Clustering Techniques43Chapter 5: K-Means104Chapter 6: Special Issues162Chapter 7: Probabilistic Clustering1842
Chapter 1:Overview and ExamplesChapter 1: .1Overview and Examples .11.1 Purpose and Techniques .21.2 Examples .81.3 Criteria for a Good Classification.171.4 Typologies without Cluster Analysis .191.5 Further Applications of Clustering Techniques.19References .201
1.1 Purpose and TechniquesThe main idea of cluster analysis is very simple (Bacher 1996: 1-4): Find K clusters (or a classification that consists of K clusters) so that the objects ofone cluster are similar to each other whereas objects of different clusters aredissimilar.The following quotations should additionally illustrate this task:"This monograph will be concerned with certain techniques for the analysis of multivariate data,which attempt to solve the following problem:Given a number of objects or individuals, each of which is described by a set of numerical measures,devise a classification scheme for grouping the objects into a number of classes such that objectswithin classes are similar in some respect and unlike those form other classes. The number of classesand the characteristics of each class are to be determined".(Everitt 1981: 1)."The subject of classification is concerned with the investigation of the relationships within a set of'objects' in order to establish whether or not the data can validly be summarized by a small number ofclasses (or clusters) of similar objects."(Gordon 1999: 1)Everitt's characteristic requires two notes: Clustering techniques can also be applied to cluster variables. Everitt only mentions cases! Clustering techniques can also be applied in a confirmatory way. Everitt's definitionsuggests that cluster analysis is an explorative technique.The description of Gordon also needs some remarks: According to Gordon the classification must be valid. The number of clusters should be small.2
Gordon formulates additional criteria: A cluster should contain similar objects and shouldsatisfy additional criteria. Compared to Everitt, Gordon's definition portrays the developmentin cluster analysis. Until the 80s the discussion concentrated mainly on techniques. At the endof the 80s the whole process of clustering – starting with the selection of cases and variablesand ending with the validation of clusters – became dominant. The steps in a clusteringprocess are:1. selection of appropriate cases, variables and methods2. application of the methods3. evaluation of the results.This last step includes:1. determination of the number of clusters, if unknown2. substantive interpretation of clusters3. test of stability4. test of internal validity (model fit), relative validity and external validityTechniquesDifferent techniques have been developed to cluster cases or variables. The lecture willdiscuss the most important ones: Hierarchical clustering methods (see chapter 4). They result in a hierarchy ofclassifications (partitions). K-means clustering methods (see chapter 5). They result in a classification with Kclusters. A sequence of clusters containing a different number of clusters is notautomatically generated. Probabilistic methods (see chapter 7), like latent class and latent profile methods ormixture models. These methods differ from the two approaches mentioned before(hierarchical and k-means techniques) in the assignment of objects to the clusters.Hierarchical and k-means techniques result in a deterministic assignment. An object canonly belong to one cluster, e.g. object 1 belongs to cluster 2, object 2 to cluster 2, object 33
to cluster 1, and so on (see table 1-1). Probabilistic techniques assign objects with certainprobabilities to the clusters, e.g. object 1 belongs with a probability of 0.1 to cluster 1,with a probability of 0.7 to cluster 2 and with a probability of 0.2 to cluster 3.deterministic clusteringprobabilistic clustering(hierarchical or k-means)objectsmember- cluster 1cluster 2cluster 3cluster 1cluster 2cluster 010.00.01.0Table 1-1: Deterministic versus probabilistic assignment of objectsMost techniques are known for many decades. K-means was developed in the 70s by Forgy(Jain and Dubes 1988: 97). Hierarchical Methods were already developed in the 60s (seeEveritt 1981: 28). However, the implementation of clustering techniques is stillunsatisfactory in standard statistical software, especially in SPSS. SPSS (Version 10.0.5 forWindows) offers only two procedures: One module for hierarchical clustering (CLUSTER) and one module for k-means clustering (QUICK CLUSTER).Statistical tests or criteria are not available. Probabilistic models are not covered, too.Therefore, a discussion of additional programme packages is necessary. We will concentrateon two programmes: ALMO and CLUSTAN (see chapter 4). LatentGold as a third one willalso be mentioned (see chapter 7).4
Clustering Cases or VariablesAgglomerative hierarchical techniques may be used to cluster cases (clustering cases) orvariables (clustering variables). K-means and probabilistic methods only allow you tocluster cases. Figure 1-1 visualizes the difference between clustering cases and variables.variables1, 2, .3, ., mcasesdata matrix12clustering cases:Similar rows (cases) should be.combined to clusters.nclustering variables:Similar columns (variables)should be combined to clustersFigure 1-1: Clustering cases or variablesExample: A sample of n persons have been asked about their sympathy for m countries('Here is a list of m countries. Can you select those countries you like?'). If a researcher wantsto analyse the question 'which countries are similar?' he will cluster variables and he mustapply agglomerative hierarchical techniques (or other techniques for clustering variables).If the question is 'do the persons differ in their sympathy and can different patterns ofpreferences be identified?' cases are clustered. For this purpose, all three methods5
(hierarchical techniques, k-means methods and probabilistic clustering) may be used inprinciple.Agglomerative hierarchical techniques can be - dependent on your hardware - applied for small (e.g.n 50) and moderate sample sizes (e.g. n 500). K-means methods require at least a moderate samplesize (e.g. n 300). K-means can be used for large sample sizes, too. Probabilistic techniques requirelarge sample size (e.g. n 3000). The size of sample depends on the structure of the data. If wellseparated clusters exist the sample size can be smaller. Therefore, general threshold values cannot begiven.Explorative Cluster Analysis and Confirmatory Cluster AnalysisClustering techniques are regarded as explorative methods in many text books. This iscorrect only to some extent. They only require a specificatoin of the variables and cases thatshould be used. A specification of the number of clusters is not necessary in advance. Thenumber of clusters can be determined in principle. It is also not necessary to specify certaincharacteristics of the cluster (e.g. clustering variables: country A and B are in the sameclusters; or clustering cases: cluster 1 prefers countries A, B and C, cluster 2 countries A andD, and so on). Therefore, clustering techniques may be used in an explorative way. But theycan also be applied as confirmatory techniques. In this case the number of clusters and certaincharacteristics of the clusters are fixed. Figure 1-2 shows the differences between exploratoryand confirmatory cluster analysis.6
Exploratory cluster analysisConfirmatory cluster analysis The number of clusters is unknown. The number of clusters has to be The number of clusters shall not beestimated.estimated.The characteristics of clusters (e.g. cluster Characteristics of clusters are - at leastcentres in k-means) are unknown.partially – known. Clusters have to be interpreted. Finding a Clusters already have a substantivesubstantive interpretation can be difficult. The number of clusters is known.interpretation. The fit to data is maximized.The fit to data may be poor.Figure 1-2: Differences between exploratory and confirmatory cluster analysisConfirmatory cluster analysis has two advantages (see figure 1-2): Confirmatory cluster analysis avoids the problem of determining the number of clusters.This problem is still unsolved. There is already a substantive interpretation for clusters. Finding such an interpretationcan be difficult.The disadvantages are: Fit to data may be poor. Methods for confirmatory cluster analysis are not available in standard software. SPSSoffers only a rudimentary confirmatory analysis. All starting values have to be fixed orfreed for estimation. Linear or non linear restrictions or fixing some parameters is notpossible.Despite these advantages confirmatory techniques are rarely used.7
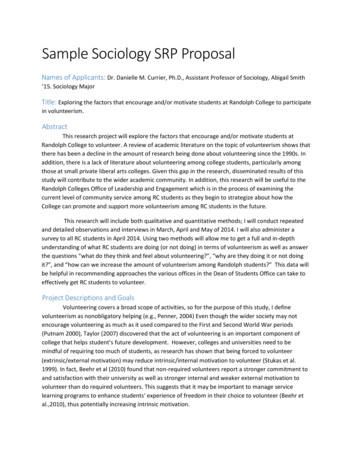
1.2 ExamplesClustering Variables: Affiliation to Youth CulturesNeumann et al. (1999) applied hierarchical techniques to analyse the perception of differentyouth cultures. Their analysis is based on a sample of 2.500 young Germans aged between 15and 19 years. The survey was carried out in four different federal states ("Länder":Brandenburg, Schleswig-Holstein, Bayern and Thüringen) in 1996 and 1997. Figure 1-3summarizes the results of their cluster analysis.8
Figure 1-3: An example of clustering variables (Neumann et al. 1999: 129)The authors differentiate between four clusters: right wing youth cultures hard youth cultures9
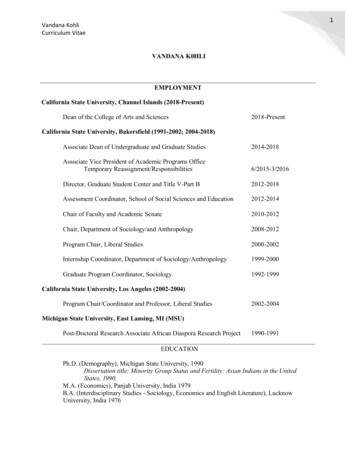
soft youth cultures pop culturesThe results (in the Cluster Tree) show the relations between the four clusters: Soft and hardyouth cultures are more similar to each other than the other clusters. They would be combinedin the next step of agglomerative hierarchical cluster analysis. The next step would join softand hard youth cultures with pop culture. These three clusters have large distances to the rightwing youth cultures. Right wing youth cultures are seen as different from other youthcultures. This has two implications: 1. Right wing groups have difficulties in attractingjuveniles with affiliations to other groups. 2. It is difficult to attract juveniles to other groups,who sympathize with right wing groups.Unfortunately, the authors do not document the method and the similarity measure used. Isuppose, it was an agglomerative hierarchical technique. Nonetheless, in chapter 4.2 we willtry to reproduce the method used.The procedure used by the authors can be applied in other research fields. Affiliations topolitical parties, to certain products or services, etc. can be analysed in a similar way.Clustering Cases I: Analysing an Attitude ScaleNeumann et al. (1999) also applied cluster analysis to the analysis of an attitude scale onxenophobia. The used scale consists of nine items. The items capture different aspects ofdiscrimination and assimilation of foreigners. The authors reported to have found fourclusters. The clusters are (see figure 1–4): "Romantic anti-racism" (n 576; cluster 2). All items of xenophobia are rejected. "Eliminatory" xenophobia (n 334; cluster 4). Members of these clusters agree to allitems. They support the exclusion of migrants and foreigners from Germany. "Assimilatory" xenophobia (n 292; cluster 1). Members of this cluster agree to all itemsexcept to those items, that demand the exclusion of foreigners from Germany (item af8and af39).10
The average (n 811; cluster 3). The authors assume that fear is the motive underlyingthis cluster.af5:Immigrants should practice their culture at home. They should adapt themselves to Germanculture when living in Germany.af8:Only Germans should live in Germany.af39:Germans should not marry immigrants.af15:Immigrants provoke xenophobia by their behaviour.af23:Most politicians take too much care of immigrants and do not take care of Germans.af26:Some immigrants do not work hard enough. Otherwise they could enjoy the same standard ofliving like Germans.af37:Male immigrants bother females more often than German males.af38:Immigrants in Germany should not interlope if they are not liked.af32:Immigrants have jobs that Germans should have.Figure 1-4: Items used by Neumann et al. (1999) to measure xenophobia11
In my opinion, the labels of the clusters are problematic, because anti-racism is regarded as aromantic attitude.I selected the example, because it is unusual to analyse attitude scales with cluster analysis.The example raises the question whether or not cluster analysis is superior to factor analysisand allows to discover patterns that are not captured by factor analysis. Factor analysisassumes parallel response patterns in the uni-dimensional case. Because of this, factoranalysis probably would not detect cluster 1. Factor analysis and cluster analysis will becompared in chapter 4.13.Clustering Cases II: Types of JuvenilesOn the basis of the 12th Shell youth study Münchmeier (1997) extracts five clusters: Kids: They have no clear opinion about politics. An uncritical attitude predominates, thepolitical interest is low. Kids are the youngest group. Critical, but loyal juveniles: They perceive social and economic problems, theirperception of the future is pessimistic. They are interested in politics. Therefore, theirpolitical knowledge is above the average. They support institutionalized political actionsavoiding conflicts. Traditional juveniles: They are convinced that politics is able to solve problems. Theyperceive fewer social and economic problems than the average. They feel less politicallyalienated and less pessimistic. Their political interest is high and they preferinstitutionalized means of political participation (e.g. to vote). They are labelledtraditional because they affiliated with SPD and CDU/CSU as traditional political parties. Conventional juveniles: Juveniles of this cluster are not interested in politics. They feelhighly alienated. Politics is not able to solve problems in their opinion. However, they donot perceive economic and social problems above the average. Their willingness toparticipate is low. (Not yet) integrated juveniles: These juveniles feel alienated, too. But they do notwithdraw to private live. They are willing to choose conflictual forms of politicalparticipation. The future is seen pessimistic. Economic as well as social problems areperceived.12
Münchmeier used the variables shown in figure 1-4a. gender age federal state (Bundesland) pessimistic view of future politicians are not interested in juveniles political alienation political knowledge institutionalized political activities political activities avoiding conflicts conflictual activities perception of social problems in the society perception of economic problems in the society efficiency of politics motivation for political action: efficiency motivation for political efficiency: effectiveness basic orientation: assertiveness basic orientation: privatism perception of a generation conflictFigure 1-4a: Variables used by MünchmeierMünchmeier used socio-demographic information (gender, age, federal state) on the one handand variables that are connected with politics (political interest, attitudes and behaviour) onthe other hand. The last variables are scales derived from manifest items by scalingtechniques. The scales are well documented. Figure 1-5 shows an example.13
Figure 1-5: Example of a scale used by MünchmeierThe variables connected to politics have different ranges. Pessimism, for example, has arange from 8 to 32 points, political alienation from 5 to 20 points, and so on. The variables are14
incommensurable. They must be transformed for cluster analysis. Cluster analysis (moreprecisely the tow deterministic methods) requires equal scales.The variables have different measurement levels, too. Federal state and gender are nominalscaled variables, all others are quantitative (interval-scaled) variables. This kind ofincommensurability must also be handled if cluster analysis (more precisely the towdeterministic methods) should be used.Different methods have been proposed for these problems. Some of them will be discussed inchapter 2 and chapter 7 (mixed variables). Münchmeier does not report the transformation heused. The clustering method he applied is not mentioned, too. Probably, he applied k-meansbecause of the large sample size (n 2011). However, he reports that the technique he usedcomputes similarities between all objects. This suggests that a hierarchical method was used.Clustering Cases III: Analysing Life StylesLechner (2001) selects leisure time preferences of juveniles (in her analysis apprentices) toidentify different life styles. The variables she used are: Preference for a special leisure time activity. Six factors were extracted by factor analysis:artistical (creative) activities, passive activities (consumption), going to parties/discos,visiting pop concerts and playing with computers, practising sports, drivingmotorcycles/cars. Preference for a special film category. Factor analysis differentiates five categories:action, horror, entertainment, classics and other films (like Western). Preference for a special music style. Factor analysis distinguishes between five categories:hard'n heavy, black roots, commerce, techno/house, grufties.Lechner found seven clusters: Rockers: they prefer aggressive music, they like to repair and drive with cars and motorcycles. Female mainstreamers: they prefer consumption and pop music.15
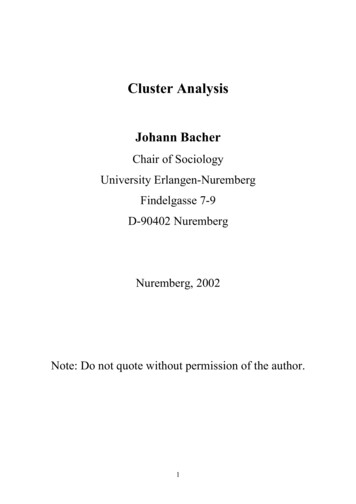
Balanced consumers: they combine passive and active leisure time activities. Athletes: sport is the most important activity, athletes have no preference for a certainmusic, action films are preferred. The young savages: they want to make as much experiences as possible, prefer going toparties, playing computer games, etc. Grufties: they prefer wave/industrial music, favour a wide range of different activities,creative arts are important to them. Television fans: their most important activity is watching TV, they like all kinds of filmsexcept horror films.Lechner used k-means. The starting values were computed with Ward's method. I refer to thisexample because data analysis is well documented.Some General Remarks on Life Style ResearchLife style typologies are based on different sets of variables. Lechner (2001; see above) usespreferences for special leisure time activities. Very often the interest is to find a more stableand general typology that allows you to predict behaviour in the different areas of life, e.g.politics, leisure and work. The SINUS-milieus, developed by the SINUS-Institute inHeidelberg (see for example Flaig 1997), are the most prominent examples of this generalapproach. The SINUS-milieus are based on general value orientations.They are normally described by two dimensions: social status and value orientation. Socialstatus constitutes the vertical dimension, the value orientation the horizontal one (seefigure 1-6). Five categories of social status are distinguished: lower class, lower middle class,middle class, upper middle class and upper class. The classes are characterized by differentvalue orientations. Six value orientations are distinguished: traditionalism, materialism withstatus/property and consumption as two subdimensions, hedonism, post-materialism and postmodernism. The characteristic orientations of these dimensions are: 'to preserve' forconservatism, 'to have' or 'to defend' for status/property, 'to buy' and 'to consume' forconsumption, 'to indulge' for hedonism, 'to be' and 'to share' for post-materialism and 'to have,to sense and to indulge' for post-modernism. It is assumed that the value orientations buildone dimension so that social milieus can be visualized in a two-dimensional space.16
Figure 1-6: The SINUS-milieus (Flaig et al. 1997: 74)Again, the clustering method is not documented. Indicators are published.1.3 Criteria for a Good ClassificationThe main objective of clustering techniques is to compute a classification: The objects of onecluster should be similar (to each other), objects of different clusters should be dissimilar. Agood classification should fulfil different criteria (Bacher 1996: 2-4, 150-154; Gordon 1999:183-211):17
Internal validity:1. The clusters of the classification (the partition) should be homogenous: The objects thatbelong to the same cluster should be similar.2. The clusters should be isolated from each other: Objects of different clusters should bedifferent.3. The classification should fit to the data: The classification should be able to explain thevariation in the data.Interpretability:4. The clusters should have a substantive interpretation: It is possible to give names to theclusters. Ideally, these names should correspond to types deduced from a certain theory.Stability:5. The clusters should be stable (stability): Small modifications in data and methods shouldnot change the results.External validity:6. The clusters should be valid (external validity): The clusters should correlate with externalvariables that are known to be correlated with the classification and that are not used forclustering.Relative validity:7. The classification should be better than the null model that assumes no clusters arepresent.8. The classification should be better than other classifications (relative validity).Further criteria:9. Sometimes the size and the number of the clusters are used as additional criteria: Thenumber of clusters should be as small as possible. The size of the clusters should not betoo small.The criteria are not completely independent. If clusters are isolated and homogenous, the fit todata will generally (but not necessarily) be high. If the fit to data is good, the null model (noclusters are present) will probably not fit (but not automatically).Sometimes, one is interested only in some criteria, e.g. in criteria 1 to 4. Very often more thanone good classification will be computed. One classification might fulfil criteria 1, 3, 4 and 7best, the other partition meets criteria 1, 2, 4 and 6, and so on. However, all classificationshave to fulfil criteria 4: They must be substantially interpretable.18
1.4 Typologies without Cluster AnalysisTo avoid misunderstandings: Not every typology is based on a cluster analysis. Moreover,well known typologies are constructed without using cluster analysis. A prominent example isInglehart (1979). He distinguishes four types: pure materialistic persons, purepostmaterialistic persons, mixed materialistic persons and mixed postmaterialistic persons.The types are built by a simple mathematical transformation. In the short version of his scalefour items (two materialistic and two postmaterialistic ones) are ranked from most importantto least important. If the two materialistic items or the two post-materialistic items are rankedfirst and second a pure materialistic type or post-materialistic type is assumed. In the mixedmaterialistic case or post-materialistic case a materialistic item is ranked first and a postmaterialistic item second or vice versa.1.5 Further Applications of Clustering TechniquesClustering techniques compute a classification. They can also be applied to other problems indata analysis. I would like to refer to the following: imputation of missing values (see chapter 6.3). data fusion (see chapter 6.3) statistical or optimal matching (see chapter 6.3) data mining (see chapter 6.4)All these problems are intensively discussed nowadays. Among other methods, clusteringtechniques can be used to solve them. However, cluster analysis is ignored in some of thesefields (imputation of missing values, optimal matching). In the other two fields clusteranalysis is an important method.19
ReferencesMethods and TechniquesBacher, J., 1996: Clusteranalyse [Cluster analysis]. Opladen. [only available in German].Everitt, B., 1981: Cluster analysis. 2nd edition. London-New York. [4th edition available: Everitt, B.,Landau, S., Leese, M., 2001: Cluster analysis. 4th edition. London-New York]Gordon, A. D., 1999: Classification. 2nd edition. London and others.Jain, A. K., Dubes, R.C. 1988: Algorithms for Clustering Data. Englewood Cliffs (New Jersey).Substantive ExamplesFlaig, B.B., Meyer, Th., Ueltzhöffer, J., 1997: Alltagsästhetik und politische Kultur [Aesthetic andpolitical culture]. Opladen. [only available in German].Inglehart, R., 1979: Wertewandel in den westlichen Gesellschaften: Politische Konsequenzen vonmateriellen und postmaterialistischen Prioritäten [Value change in Western societies: Politicalconsequences of materialistic and postmaterialistic orientations]. In: H. Klages und P. Kmieciak(Hg): Wertewandel und gesellschaftlicher Wandel. Frankfurt a. M., 279-316 [only available inGerman].Lechner, B., 2001: Freizeitverhalten von BerufsschülerInnen [Leisure time activities of apprentices].Nürnberg. [only available in German].Münchmeier, R., 1997: Jung – ansonsten ganz verschieden [young – and different]. In: Jugendwerkder Deutschen Shell (Hg.): Jugend 97. Opladen, 379-389. [only available in German].Neumann, J., Frindte, W., Fuchs, F., Jacob, S., 1999: Sozialpsychologische Hintergründe vonFremdenfeindlichkeit und Rechtsextremismus. [Social psychological determinants ofxenophobia and right-extremism]. In: F. Dünkel and B. Geng (Eds.): Rechtsextremismus undFremdenfeindlichkeit. Godesberg, 111-138 [only available in German].20
Chapter 2:Transformation of VariablesChapter 2: .21Transformation of Variables.212.1 Incommensurability .222.2 Original Variables or Derived Variables? .27References .28Note: For a detailed discussion on this topic see Bacher (1996: 173-191). The problem is alsodiscussed in Everitt (1981: 9-12) and Gordon (1999: 23-28).21
2.1 IncommensurabilityCluster analysis requires commensurable variables. The variables must have equal scales.This assumption is violated in the following situations: All variables are quantitative, but have different scales (e.g. AGE and INCOME are used). The variables have different measurement levels (e.g. AGE ( quantitative), GRADE( ordinal) and BRANCH OF STUDY ( nominal) are used). The variables are hierarchical. The occurrence of one variable depends on another variable(e.g. OCCUPATIONAL LEVEL depends on OCCUPATIONAL STATUS).In addition, substantive consideration may result in the opinion that variables areincommensurable (Fox 1982).This chapter concentrates on the first case. The second case will be discussed in chapter 6. Ifvariables have different scales a transformation to an equal scale is necessary. Differentapproaches are possible: Theoretical or empirical standardization Theoretical or empirical transformation to [0,1]22
Theoretical or Empirical Standardization (or z-transformation)z gi x gi xisiresp. z gi x gi µ iσi.xi is the empirical mean of variable i, si the empirical standard deviation. The theoreticalscale values are µ i (mean) and σ i (standard deviation). Note: µ i and σ i are not populationparameters, they are derived from the property of the scale. Figure 2-1 shows the difference.Theoretical or Empirical Transformation [0, 1] ( or [0, 1]-transformation)z gi x gi aix gi α iresp. z gi .βi αibi aiai is the empirical minimum of variable i, bi the empirical maximum. The theoretical scalevalues are α i and β i . The theoretical values are derived from the scale.scale used in a survey results of a survey1 strongly agreestrongly agree (1) 35%2 agreeagree (2) 45%3 disagreedisagree (3) 20%4 strongly disagreestrongly disagree (4) 0% theoretical scale valuesempirical scale valuesmean 2.5mean 1.850standard deviation 1.12standard deviation 0.73minimum 1minimum 1maximum 4maximum 3Figure 2-1: Theoretical and empirical scale values23
The formulas for computing the theoretical scale values are shown in figure 2-2. Three scaletypes are distinguished: Scale type I: Variables with continuous values in a given interval, e.g. percent of votesfor party A. Scale type II: Variables with discrete equidistant values, e.g. response categories of anattitude scale. Scale type III: Variables with discrete, but not equidistant values, e.g. frequency for acertain leisure activity: 7.0 daily, 3.5 several times a week, 1.0 weekly, 0.2 less.theoretical scale valuesminimumsymbolαiscale typesscale type Iscale type IIimmediately seen f
Exploratory cluster analysis Confirmatory cluster analysis The number of clusters is unknown. The number of clusters has to be estimated. The characteristics of clusters (e.g. cluster centres in k-means) are unknown. Clusters have to be interpreted. Finding a substantive interpretation can be difficult. The fit to data is .