Transcription
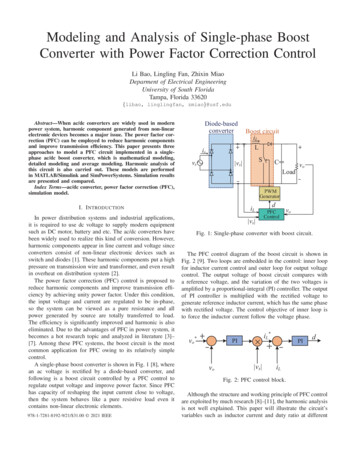
Modeling and Analysis of Single-phase BoostConverter with Power Factor Correction ControlLi Bao, Lingling Fan, Zhixin MiaoDeparment of Electrical EngineeringUniversity of South FloridaTampa, Florida 33620{libao, linglingfan, zmiao}@usf.eduAbstract—When ac/dc converters are widely used in modernpower system, harmonic component generated from non-linearelectronic devices becomes a major issue. The power factor correction (PFC) can be employed to reduce harmonic componentsand improve transmission efficiency. This paper presents threeapproaches to model a PFC circuit implemented in a singlephase ac/dc boost converter, which is mathematical modeling,detailed modeling and average modeling. Harmonic analysis ofthis circuit is also carried out. These models are performedin MATLAB/Simulink and SimPowerSystems. Simulation resultsare presented and compared.Index Terms—ac/dc converter, power factor correction (PFC),simulation model.Diode-basedconverterisvsBoost circuitiLLS vs LoadvoPWMGeneratorI. I NTRODUCTIONiLIn power distribution systems and industrial applications,it is required to use dc voltage to supply modern equipmentsuch as DC motor, battery and etc. The ac/dc converters havebeen widely used to realize this kind of conversion. However,harmonic components appear in line current and voltage sinceconverters consist of non-linear electronic devices such asswitch and diodes [1]. These harmonic components put a highpressure on transmission wire and transformer, and even resultin overheat on distribution system [2].The power factor correction (PFC) control is proposed toreduce harmonic components and improve transmission efficiency by achieving unity power factor. Under this condition,the input voltage and current are regulated to be in-phase,so the system can be viewed as a pure resistance and allpower generated by source are totally transferred to load.The efficiency is significantly improved and harmonic is alsoeliminated. Due to the advantages of PFC in power system, itbecomes a hot research topic and analyzed in literature [3]–[7]. Among these PFC systems, the boost circuit is the mostcommon application for PFC owing to its relatively simplecontrol.A single-phase boost converter is shown in Fig. 1 [8], wherean ac voltage is rectified by a diode-based converter, andfollowing is a boost circuit controlled by a PFC control toregulate output voltage and improve power factor. Since PFChas capacity of reshaping the input current close to voltage,then the system behaves like a pure resistive load even itcontains non-linear electronic elements. vs 978-1-7281-8192-9/21/ 31.00 2021 IEEECdPFCControlvoFig. 1: Single-phase converter with boost circuit.The PFC control diagram of the boost circuit is shown inFig. 2 [9]. Two loops are embedded in the control: inner loopfor inductor current control and outer loop for output voltagecontrol. The output voltage of boost circuit compares witha reference voltage, and the variation of the two voltages isamplified by a proportional-integral (PI) controller. The outputof PI controller is multiplied with the rectified voltage togenerate reference inductor current, which has the same phasewith rectified voltage. The control objective of inner loop isto force the inductor current follow the voltage phase.vo*PIvo vs iL*PIdiLFig. 2: PFC control block.Although the structure and working principle of PFC controlare exploited by much research [8]–[11], the harmonic analysisis not well explained. This paper will illustrate the circuit’svariables such as inductor current and duty ratio at different
Modeling of the single-phase ac/dc boost converter providesthe accurate analysis of dynamic and static performance.The converter can be modeled in several ways, this sectiondescribes mathematical model, average model and detailedmodel, all of them are developed on Matlab/Simulink andSimPoweSystem program.A. Mathematical modelMathematical model simulates the circuit by using thedifferential and algebraic equations of circuit variables. Compared with detailed model and average model, mathematicalmodel building requires a total understanding of target system,the transient analysis also needs to be investigated. As thesingle-phase ac/dc boost converter shown in Fig. 1, if allswitches are ideal and a large capacitor C ensures the outputvoltage be a constant, the general differential equations (1) and(2) for the output voltage and inductor current are obtainedbased on its working principle and Kirchhoff current andvoltage laws.td[i ;vv ]Matlab Fcnxx f(x,u) LoiLʃvoẋ f (x, u).(3)where iL and vo are state variables x1 and x2 , respectively,oso ẋ [ didtL ; dvdt ], input u is duty ratio d.Thus, the boost circuit can be expressed by the nonlineardifferential equations, which is integrated into the mathematical model as shown in Fig. 3.The differential equations of boost circuit are constructedin the Matlab function, the outputs i̇L and v̇o are sent back tothis function after being integrated. Another block t representsthe time used to produce continuous voltage signal. The codeassociated with the function is shown as:f u n c t i o n diLdvo fcn ( u , t , d )L 0 . 0 0 1 ; C 0 . 0 2 ; R 7 ; Vs 24 * s q r t ( 2 ) ;i L u ( 1 ) ;vo u ( 2 ) ;iL* vs vo*PIFig. 3: Mathematical model.v s Vs * a b s ( s i n ( 2 * p i * 60 * t ) ) ;d i L v s / L (1 d ) / L * vo ;dvo (1 d ) / C* iL vo / C / R ;d i L d v o [ d i L ; dvo ] ;B. Detailed modelDetailed model is the most intuitive simulation method tostudy the power system transient problems relying on GUI.It contains detailed electronic elements such as the differenttypes of switches, power sources, control blocks and etc.These elements are composed of a set of algebraic equationsto represent their physical characteristics [12]. Some solverssuch as Runge-Kutta or Euler method are employed to solvedifferential equations in power systems.The detailed model is built in SimPowerSystems and shownin Fig. 4. The solver for this model is ode4/Runge-Kutta." # , %&' ( %&' ( " )*# " # " #! " )*#" #" # " #" #diL vin (1 d)vo(1)Ldtdvovo (1 d)iL .(2)CdtRwhere iL is inductor current, vin is input voltage, vo denotesoutput voltage and d is duty ratio of switch.The variables in equation (1) and (2) can be represented asa function as: PI II. S YSTEM MODELING[iL;vo] frequencies through fast Fourier transform (FFT) algorithm.Three PFC models also carried out as mathematical model,average model and detailed model. These models shows thealmost same simulation results but their characteristics varies.The comparison is a good instruction for model building. Simulation results of variables waveform and FFT analysis are alsopresented and compared with the harmonic analysis. The paperis organized as follows. In Section II, the system modelingis developed. The analysis and simulation are presented inSection III. Finally, Section IV concludes this paper.Fig. 4: Detailed model.C. Average modelThe idea of average model is to replace switches by equivalent circuit based on the relationship of circuit’s variables,and the equivalent circuit has the same average behavior withdetailed model.Fig. 5 shows a boost circuit and its average model. Thiscircuit includes a diode and a insulated-gate bipolar transistor(IGBT) switch. IGBT is controlled by external control signaland diode by voltage direction. Since the switching is replaced,there is no switching loss. Thus, the input power is identicalto output power. If the boost circuit is treated as a currentsource, the current value can be calculated by equation (4).vin iin vout ioutvin iin iout .(4)voutAs the diagram illustrates, output voltage vout and inputcurrent iin are extracted from this circuit directly, while inputP
voltage vin is derived based on the relationship as vin (1 d)vout . Since the switch is not considered, switching harmonicis eliminated in the average model.iLLCSV̂s 42V̂s cos(nωt) n 2, 4, 6, . (8)ππ n2 1Since the components after second order are relativelysmall, we only consider the fundamental (dc value) andsecond harmonic component. Thus, the rectified voltage canbe calculated in Fourier series as:24cos 2ωt(9a) vs (t) V̂s V̂s π 3π vs (t) io vs Put equation (7) into (5) and (6), the Fourier series of the vs (t) is calculated as:LoadvoVDCiLControlledcurrent source vs Controlledvoltage sourcePin 21.61 14.4 cos(2ωt).If this system is only equipped with a voltage control toregulate the output voltage, and the reference voltage is Vo ,the control diagram block is shown in Fig. 6.voPWMGeneratorFig. 5: Schematic diagram of a boost circuit average model.III. S TEADY- STATE A NALYSISAs shown in Fig. 1, the voltage source is firstly rectifiedby a diode-based converter and increased to another level bythe boost circuit. The line current harmonics is supposed toeliminated, and power factor is improved to be unity throughthe PFC control. In this paper, the three models are built inMatlab/Simulink and SimPowerSystem based on the followingparameters:L 1 mH, C 20 mF , R 7 Ω, vs (t) 24 2 sin(2π 60t), the switching frequency of the switch Sis 2 kHz and the desired output voltage Vo is set as 48 V .A. Fourier series analysisConsidering the rectified voltage is required to be decomposed into harmonic components at specific frequencies, theFourier series analysis is employed. Fourier series splits aperiodic function into an infinite sum of sines and cosineswith different magnitudes and frequencies [13]. If a periodicwaveform is f (t), then the Fouries series can be written: f (t) Fo (an cos(nωt) bn sin(nωt))(5)n 1where Fo is the average or fundamental value of f (t), ndenotes the order of harmonics, an and bn are the coefficientand are represented as: 1 2πan f (t) cos(nωt)d(ωt) n 1, 2, 3, .(6a)π 0 1 2πf (t) sin(nωt)d(ωt) n 1, 2, 3, .(6b)bn π 0In single-phase converter, assuming the voltage source magnitude is Vs and angular frequency is ω, the rectified voltagecan be presented as: vs (t) V̂s sin(ωt) .(9b)B. System without PFC controlio/1-dvoV̂2(7)vo*PId2u-1vc PWMtriangularvoFig. 6: Diagram block of output voltage control. u representsinput of the block.The output voltage is compared with a reference signal, anderror goes into a PI controller to generate duty ratio. A PWMgenerator is used to convert duty ratio to PWM signal thatapplied to IGBT switch. Since the output is a dc voltage Vo ,which is related to dc component of the rectified voltage VDC ,then the duty ratio d is calculated as:d 1 VDC 0.55.Vo(10)According to equation (5), IL consists of a dc componentand a series harmonic components, then the dc component canbe calculated as:Vo 1IoIL,DC 15.24 A.(11)1 dR 1 dIf this circuit is powered by the other harmonic componentsof voltage, only the inductor L is considered. Then the secondharmonic component of inductor current is given as equation(12).V̂2V̂2Iˆ2 19.1 A. XL2ωL(12)The boost circuit with voltage control is implemented inMatlab/SimPowerSystems and simulation results are displayedin Figs. 7 and 8. From Fig. 7, it can be observed that theoutput voltage follows the reference signal as 48 V , while the
duty ratio is 0.55, which is corresponded to the analysis fromequation (10). Fig. 8 shows the waveform of inductor currentand its FFT analysis. The inductor current mainly containstwo components: dc component is about 15.2 A and 120 Hzcomponent is around 19.3 A. The two components are close tothe analysis. Moreover, the power factor is calculated as 0.83by using the measurement tools in Matlab/SimPowerSystems.Vo and V*o (V)4020oV*o000.511.522.533.5(13a)(13b)(13c)By comparing PDC and P , the power from dc component4is accounted as 4 1π2 4 2 81.43% of the total power, so 2 ( 3π )π2the rest of 18.57% is generated from the second harmoniccomponent.Based on the parameters of this model, the total power is2calculated as P 487 W 329.15W . Thus, the dc componentof current can be derived as:60V4V̂s IˆLπ2 21 4V̂s IˆLP2 2 3πP PDC P2 .PDC 40.6IDC 81.43% P2π V̂sd0.4 81.43% 329.15 12.4 A.2π 24 2(14)0.2And the current in second harmonic component is:000.511.522.533.54Time(s)Fig. 7: Boost circuit output voltage Vo and duty ratio d.30100Magnitude (A)2010IL (A)0503.483.53.520-50-10015101234Time(s)(a) Inductor current waveformL0100200300S400 VDCCFrequency (Hz)(b) FFT analysis of inductor currentFig. 8: Boost circuit inductor current waveform and its FFTanalysis without PFC control.C. System with PFC controlIn this model, the PFC control shown in Fig. 2 is employedin the converter. The input voltage and current are supposedto be synchronized to realize unity power factor. The analysisof PFC control is illustrated as follows.According to equation (9), when the input voltage andcurrent are regulated to be in same phase, both of them arecomposed of a dc and a second harmonic component. Eachcomponent could produce power, so the total power of thecircuit transferred is their sum. In the single-phase converter,the total power P , dc component power (PDC ) and secondharmonic component (P2 ) power can be calculated as:I2IDCI500(15)The boost circuit can be decomposed into two circuits basedon the harmonic components, one is powered by dc voltageand another by voltage harmonic. Fig. 9 shows the equivalentcircuit.20150π4Iˆ2 IDC 8.27 A.23π VVscos(ωt) S1 Vs1- L S2 Vs22V2cos(2ωt)-Fig. 9: The boost equivalent circuit.where Vˆs cos(ωt) is the input voltage of boost circuit,VDC and V̂2 are dc and second harmonic components of inputvoltage, IDC and I2 are the circuit currents, respectively. Theinductor L is not considered in dc system.As the figure shows, the output voltage can be treated as thesum of a dc voltage Vs1 and an ac voltage Vs2 with doublefrequency. Vs1 and Vs2 are calculated as:Vs1 VDCV̄s2 V2 j2ωLI21V̂22 (2ωLIˆ2 )2 θ 22where θ arctan( 2ωLIV2 ).(16)(17)
Based on equations (9), (15)-(17), the duty ratio is derivedas:0.611.50.80.6 (2ωLIˆ2 )2Vocos(2ωt θ)(18b)(18c)It can be seen that the duty ratio also contains a secondharmonic under the unity power factor condition.The simulation results of the converter with PFC controlare displayed in Fig. 10-12. From Fig. 10, it is clear thatoutput voltage is controlled by reference voltage, and the outerloop PI controller generates a constant value, which is thesame with duty ratio duty ratio. Inductor current reference isgeneratedby the outer loop output multiplies rectified voltage 24 2 sin(2ωt) . So the PFC controls output voltage byouter loop and regulates current phase by inner loop. Resultand FFT analysis of inductor current are shown in Fig. 11,where magnitude of dc component is 12.4 A and 120 Hzcomponent is 8.5 A. The duty ratio and its FFT analysis areshown in Fig. 12. The dc and 120 Hz components are 0.55and 0.32, respectively. These results are well corresponded tothe analysis from equations (14), (15) and (18).0.7Vo and V*o (V)50Outer PI controller outputVoV*o403020100.60.512312Magnitude340(a) Duty ratio waveformFig. 13 compares the input voltage and current waveformwith and without PFC control. The voltage and current almostare in synchronization under the PFC control, which ensuresunity power factor and high efficiency, while the power factorin the system without PFC control is only 0.83. The currentis discontinuous and has a phase shift with voltage if there isno the PFC control. Moreover, the higher peak value of thiscurrent will result in a higher pressure on transmission line.With PFC control1234Time(s)(b) Output of outer PI controllerFig. 10: Output voltage Vo and outer loop PI controller output.VsIL402004.014.024.03Without PFC control0400D. Comparison of boost circuit with and without PFC control0.20300(b) FFT analysis of duty ratioTime(s)4200Fig. 12: Duty ratio waveform with PFC control and its FFTanalysis.40.1100Frequency (Hz)Time(s)0.3Time(s)(a) Vo and Vo 0.20-0.500.4000.50.40 0.55 0.33 cos(2ωt 23.4o ).603.28 3.3 3.32Vs (V) and IL (A)VDC d (1 ) Vo1Vs (V) and IL (A)V̂22(18a)Duty ratio0.4Vs1 V̄s21 d 515ILFig. 13: Inductor current and rectified voltage with and withoutPFC.10Magnitude (A)503.5IL (A)203.5210001234Time(s)(a) Inductor current waveform10E. Model comparison500100200300400Frequency (Hz)(b) FFT analysis of inductor currentFig. 11: Inductor waveform with PFC control and its FFTanalysis.The three models shown in Figs. 3, 4 and 5 are comparedfor the inductor current, duty ratio and simulation time. Allmodels are implemented in the same step size as 20 μs. Thesimulation hardware is Windows Server with Intel Xeon CPUE5-2698 v3 2.3 Ghz and 32 GB RAM. As Figs. 14 and 15show, the inductor current and duty ratio in detailed modelhas a high-frequency harmonic due to its IGBT switch, but theaverage values are the same with other two models. Since bothaverage model and mathematical model neglect the switching
loss and capacitor voltage variation, their simulation resultsare ideal.Average modelMathematical modelDetail model2520IL (A)1510duty ratio of the boost circuit and is validated by simulationresults. Three approaches to model the system are evaluatedand compared. The mathematical model is derived from boostcircuit equations, average model is based on power relationand detailed model is built by using Matlab/SimPowerSystemblocks directly. By executing the same simulation time period,results of the three models show that the mathematical modelis the most efficient, average has the lowest simulation speed,and the detailed model shows higher harmonics.R g. 14: The comparison of inductor current IL .Average modelMathematical modelDetail 157.027.0257.03Time(s)Fig. 15: The comparison of duty ratio d.TABLE I gives a comparison of the execution time ofthe three models. As the table shows, for a fixed simulationtime, mathematical model has the fastest simulation speedsince it doesn’t contain any electronic elements, all results areproduced by differential and algebraic equations. Compared todetailed model, average model replaces the switch and diodeby a more complicate equivalent circuit, which needs longertime to process.TABLE I: Comparison of execution timeTime to besimulated2 sec8 sec30 secAveragemodel21 sec1 min 2 sec5 min 33 secDetailmodel17 sec57 sec4 min 22 secMathematicalmodel7 sec21 sec1 min 23 secIV. C ONCLUSIONThis paper analyzes the single-phase diode-based ac/dcconverter with boost PFC control. Results show that the powerfactor of the system with PFC control is greatly improved.Harmonic analysis is also implemented for line current and[1] O. Garcı́a, J. A. Cobos, R. Prieto, P. Alou, and J. Uceda, “Singlephase power factor correction: A survey,” IEEE Transactions on PowerElectronics, vol. 18, no. 3, pp. 749–755, 2003.[2] R. W. Erickson and D. Maksimovic, Fundamentals of power electronics.Springer Science & Business Media, 2007.[3] C. Zhou, R. B. Ridley, and F. C. Lee, “Design and analysis of a hystereticboost power factor correction circuit,” in 21st Annual IEEE Conferenceon Power Electronics Specialists. IEEE, 1990, pp. 800–807.[4] B. A. Mather and D. Maksimović, “A simple digital power-factorcorrection rectifier controller,” IEEE Transactions on Power Electronics,vol. 26, no. 1, pp. 9–19, Jan 2011.[5] L. Rossetto, G. Spiazzi, and P. Tenti, “Control techniques for powerfactor correction converters,” in PEMC, vol. 94, 1994, pp. 1310–1318.[6] G. Moschopoulos and P. Jain, “Single-phase single-stage power-factorcorrected converter topologies,” IEEE Transactions on Industrial Electronics, vol. 52, no. 1, pp. 23–35, Feb 2005.[7] Wanfeng Zhang, Guang Feng, Yan-Fei Liu, and Bin Wu, “A digitalpower factor correction (pfc) control strategy optimized for dsp,” IEEETransactions on Power Electronics, vol. 19, no. 6, pp. 1474–1485, Nov2004.[8] F. A. Huliehel, F. C. Lee, and B. H. Cho, “Small-signal modeling of thesingle-phase boost high power factor converter with constant frequencycontrol,” in PESC ’92 Record. 23rd Annual IEEE Power ElectronicsSpecialists Conference, June 1992, pp. 475–482 vol.1.[9] Jong-Soo Kim, Gyu-Yeong Choe, Hye-Man Jung, Byoung-Kuk Lee,Young-Jin Cho, and Kyu-Bum Han, “Design and implementation ofa high-efficiency on- board battery charger for electric vehicles withfrequency control strategy,” in 2010 IEEE Vehicle Power and PropulsionConference, Sep. 2010, pp. 1–6.[10] P. Krein, Elements of Power Electronics, ser. Oxford Series inElectrical an. Oxford University Press, 2014. [Online]. Available:https://books.google.com/books?id o5jkoAEACAAJ[11] J. Rajagopalan, F. C. Lee, and P. Nora, “A general technique for derivation of average current mode control laws for single-phase power-factorcorrection circuits without input voltage sensing,” IEEE Transactions onPower Electronics, vol. 14, no. 4, pp. 663–672, July 1999.[12] N. Watson and J. Arrillaga, Power systems electromagnetic transientssimulation. Iet, 2003, vol. 39.[13] N. Mohan and T. M. Undeland, Power electronics: converters, applications, and design. John wiley & sons, 2007.
is developed. The analysis and simulation are presented in Section III. Finally, Section IV concludes this paper. II. SYSTEM MODELING Modeling of the single-phase ac/dc boost converter provides the accurate analysis of dynamic and static performance. The converter can be modeled in several ways, this section