Transcription
Clinical StudyC Höybye and others181:6GHD characteristic changes overtime629–638Change in baseline characteristics over20 years of adults with growth hormone (GH)deficiency on GH replacement therapyCharlotte Höybye1, Pia Burman2, Ulla Feldt-Rasmussen3, Judith Hey-Hadavi4, Ferah Aydin5,Cecilia Camacho-Hubner4 and Anders F Mattsson5Patient Area Endocrinology and Nephrology, Inflammation and Infection Theme, Karolinska University Hospital andDepartment of Molecular Medicine and Surgery, Karolinska Institute, Stockholm, Sweden, 2Department ofEndocrinology, Skåne University Hospital, University of Lund, Lund, Sweden, 3Department of Medical Endocrinologyand Metabolism, Rigshospitalet, Copenhagen University Hospital, Copenhagen, Denmark, 4Endocrine Care, PfizerInc., New York, New York, USA, and 5Endocrine Care, Pfizer Health AB, Sollentuna, Sweden1Correspondenceshould be addressedto C HöybyeEmailcharlotte.hoybye@sll.seEuropean Journal of EndocrinologyAbstractObjective: Clinical observations over time of adults with growth hormone (GH) deficiency (GHD) have indicated a shiftin patient characteristics at diagnosis. The objective of this study was to compare baseline characteristics of patientsdiagnosed with adult-onset GHD naive to GH replacement during three study periods (1994–1999 (P1), 2000–2004 (P2),and 2005–2012 (P3)) using the KIMS (Pfizer’s International Metabolic) database.Methods: Data were retrieved for a total of 6069 patients with adult-onset GHD from six countries (Belgium, Germany,Netherlands, Spain, Sweden, and UK): P1 (n 1705), P2 (n 2397), and P3 (n 1967).Results: The proportions of patients with pituitary/hypothalamic tumors and patients with multiple pituitary hormonedeficiencies decreased per entry year period, while the proportions with hypertension and diabetes increased. The lagtime from diagnosis of pituitary disease to start of GH treatment decreased by 2.9 years over the entry year periods.IGF-1 increased by 0.1 standard deviation score per entry year period. Maximum GH following various stimulationtests, BMI, and waist circumference increased. The use of radiotherapy, glucocorticoid replacement doses, and theproportion of women 50 years on estrogen replacement therapy decreased. The effects of 1 year of GH replacementwere similar over the entry year periods despite changes in the patients’ baseline characteristics. An expected increasein fasting blood glucose was seen after 1 year of GH treatment.Conclusions: The degree of confirmed GHD became less pronounced and more patients with co-morbidities anddiabetes were considered for GH replacement therapy, possibly reflecting increased knowledge and confidence in GHtherapy gained with time.European Journal ofEndocrinology(2019) 181, 629–638IntroductionTreatment with growth hormone (GH) started in the late1950s when enough cadaveric GH was purified to treatpatients with GH deficiency (GHD). During the earlydecades of treatment, only children received GH and thegoal was primarily to promote longitudinal growth. Thenumber of patients diagnosed with GHD was relatively 10.1530/EJE-19-0576 2019 European Society of EndocrinologyPrinted in Great Britainsupplies were scarce, and treatment expensive. Monitoringof efficacy was clinical and limited to measurement ofheight and body proportions. Moreover, conclusions onpotential side effects, such as diabetes, cardiovasculardiseases, and cancer, were from the clinical picture ofGH excess (acromegaly). Of note, the initial studies usedPublished by Bioscientifica Ltd.Downloaded from Bioscientifica.com at 08/15/2022 10:08:36AMvia free access
European Journal of EndocrinologyClinical StudyC Höybye and othersbody weight-adjusted GH doses and some adults obtainedsupraphysiological GH levels with elevated insulin-likegrowth factor 1 (IGF-1) concentrations (1). The treatmenteffects of GH replacement therapy may therefore have beenoverestimated in initial pivotal studies. In the late 1980s,when recombinant human GH (rhGH) became available,interest in the profound metabolic effects of GH intensifiedand the beneficial effects of rhGH treatment in adultswith GHD were demonstrated (2, 3, 4). Since then, manystudies have been published, most of them reporting on afew years of GH treatment but some on longer treatmentduration (5, 6, 7, 8, 9, 10, 11, 12, 13, 14, 15). Typicalmanifestations of GHD in adulthood are well-definedand include an abnormal body composition, fatigue,decreased physical activity, an adverse cardiovascular riskprofile, and reduced quality of life (QoL) (5, 6). In addition,adults with pituitary insufficiency have demonstrated ashorter lifespan compared to healthy controls (7, 8, 9, 10,11, 12, 13, 14, 15, 16). Previously, the excess mortalitywas considered to be caused by cardiovascular disease (7,8) but, in recent decades, other causes such as adrenalcrises during infections and secondary brain tumorsfollowing radiotherapy have been revealed to explainmost premature deaths (16). Since 1990, GH replacementtherapy has been prescribed to adults with GHD accordingto specific diagnostic criteria and several clinical trialshave documented that GH improves body composition,cardiovascular risk factors and QoL (9, 10, 11, 12, 13, 14,15, 16, 17, 18, 19, 20).In the clinical setting, it appears that the phenotypeof patients treated for GHD as adults has shifted overtime. The primary aim of this study was to explore thisclinical observation by systematically comparing baselinecharacteristics of patients with adult-onset GHD naïveto GH replacement in whom GH treatment was initiatedbetween 1994 and 2012. The secondary aim was odescribe the effects of GH replacement after 1 year duringthis period.Patients and methodsData were retrieved from 1994 to 2012 using KIMS (Pfizer’sInternational Metabolic Database). KIMS was launched in1994 and closed for the input of further data in 2012. Thedatabase contains prospectively collected observationaldata from almost 16 000 adult patients with GHD from 31countries. Data for the current study were retrieved fromsix countries (Belgium, Germany, Netherlands, Spain,Sweden, and UK), which enrolled the highest numbersGHD characteristic changes overtime181:6630of patients with adult-onset GHD naive to GH treatmentand had patients well represented over time. Data werederived from a total of 6069 patients over three definedtime periods: 1994–1999 (P1) (n 1705), 2000–2004 (P2)(n 2397), and 2005–2012 (P3) (n 1967).Information regarding medical history, gender, ageat diagnosis, age at GHD diagnosis and at start of GHtreatment, GH dose, anthropometry, cardiovascular riskfactors, and QoL was collected. The diagnosis of GHDwas at the treating physician’s discretion based on GHstimulation tests, clinical manifestations, and medicalhistory. For the purpose of this study, severe GHDwas defined as peak GH 3 µg/L after insulin-inducedhypoglycemia or a glucagon-stimulation test, peak GH 0.4 µg/L after arginine-stimulation test, body mass index(BMI)-adjusted cut-offs after growth hormone-releasinghormone (GHRH)-arginine test, IGF-1 standard deviationscore (SDS) 2, and three or more additional pituitarydeficiencies.The following variables were assessed at baselineand after 1 year of GH treatment: IGF-1, BMI, waistcircumference, body fat, lean body mass, blood pressure,blood lipids, glucose, hemoglobin A1c (HbA1c), andQoL. Serum IGF-1 concentrations were measured at acentral facility by radioimmunoassay after acid/ethanolprecipitation of IGF-binding proteins (Nichols InstituteDiagnostics, San Juan Capistrano, CA, USA) from 1994to 2002 and by chemiluminescence immunoassays from2003 to 2004 (Nichols Advantage System) and from 2005to 2012 (Immulite 2500, DPC Siemens). For each assay,age- and gender-specific reference ranges were used todetermine IGF-1 SDS. Reference ranges and consistency ofIGF-1 SDS values between assays were validated internally.Body composition was evaluated by dual-energy X-rayabsorptiometry (DXA) and bioelectric impedance analysis.Total body fat and lean body mass were determined fromthe DXA measurements, and body fat and fat-free masswere calculated from the bio-impedance measurements.Hypertension was defined as blood pressure 130/80mmHg, treatment with antihypertensive medication, orhypertension reported in medical history. Serum totalcholesterol, high-density lipoprotein (HDL) cholesterol,and triglyceride concentrations were measured centrally.Serum low-density lipoprotein (LDL) cholesterolconcentrations were calculated using Friedewald’sformula (21). A total cholesterol concentration 5.20mmol/L ( 201 mg/dL) or treatment with cholesterollowering medication was considered as evidence ofabnormal levels. Fasting blood glucose and HbA1c wereanalyzed locally. HbA1c levels 6.5% or treatment withhttps://eje.bioscientifica.comDownloaded from Bioscientifica.com at 08/15/2022 10:08:36AMvia free access
European Journal of EndocrinologyClinical StudyC Höybye and othersantidiabetic medication was consistent with a diagnosis ofdiabetes (22). QoL was assessed using the QoL assessmentof GHD in adults (QoL-AGHDA) questionnaire (23, 24).Higher numerical scores, to a maximum of 25, denotepoorer QoL.GH dosing was at the discretion of treating physiciansand reported to the KIMS database. GH dose was analyzedas the starting dose (i.e., dose prescribed at the entry visitinto KIMS) and the dose reported at the visit after 1 yearof treatment. Concomitant medication for treatmentof diabetes, hypercholesterolemia, hypertension, andpituitary deficiency replacement was summarizedas yes or no. Glucocorticoid doses were expressed ashydrocortisone equivalent dose (mg/day) (25) andthyroxine dose as μg/day.Means, standard deviations (SDs), and proportions(percentages) were calculated depending on the typeof variable. Trend tests for dichotomous variables wereperformed with the χ2 test and Cochran-Armitage testover entry year periods. Linear regression models wereapplied with adjustment for age and gender. Adjustmentwas additionally performed by baseline value for analysesof numerical delta variables. ‘P trend’ in the text stands forin analyses of means the P value under ‘no change’ in thelinear yearly trend, and in analyses of proportions under‘no change’ in the trend over the time periods. OverallTable 1181:6GHD characteristic changes overtime631mean or proportion stands for the mean or proportiontaken over all entry years. Statistical significance was set atP 0.05. The level for confidence intervals (CIs) was 95%.Analyses were performed with SAS 9.4 procedures PROCFREQ, PROC GLM, PROC GENMOD, and PROC SGPLOT(SAS Institute Inc., Cary, NC, USA).ResultsThe total cohort consisted of 2995 (49%) male and 3074(51%) female patients and the gender ratio was stableover the entry year periods (Table 1). The proportion ofpatients with pituitary surgery alone increased from 52 to63% over the entry year periods (P-trend 0.001) (Table 1),while the use of radiotherapy markedly decreased (Fig. 1and Table 1). The most frequent pituitary tumors overall entry year periods were non-functioning pituitaryadenoma (n 2046) followed by prolactinoma (n 607)and corticotropinoma (n 472). However, many patients(n 2376) had other etiologies causing GHD. Among these,the most frequent were postpartum necrosis (n 225),empty sella (n 178), and traumatic brain injury (n 154).The proportion of patients with tumors in the pituitaryand hypothalamic area decreased over time from 79 to67% (P-trend 0.0001) (Fig. 1 and Table 1). Likewise, theBaseline characteristics given as percentage of patients with adult-onset GHD deficiency enrolled in KIMS databaseaccording to entry year period (n 6069).CharacteristicGender (women)Pituitary/hypothalamic tumorsSurgery alone in PHT patientsRadiotherapy in PHT patientsPeak GH 3 µg/L after ITTConfirmed severe GHDMultiple hormone deficienciesThyroxine treatment in TSH-deficientpatientsEstrogen treatment in women 50 yearsEstrogen treatment in women 50 yearswith FSH/LH deficiencyDiabetes mellitusAntidiabetic medication in diabetic patientsTotal cholesterol 5.2 mmol/L or lipidlowering medication (abnormal)Lipid-lowering medication in all patientsLipid-lowering medication in patients withabnormal valuesCoronary heart diseaseStrokePercentageP3 (2005–2012) (n 1967)P value trendP1 (1994–1999) (n 1705)P2 (2000–2004) (n 46387860.33 0.0001 0.0001 0.0001 0.0001 0.0001 0.0001 0.0001414826361117 0.0001 0.00018.136779.8457112.05367 0.00010.0002 0.00017.21410.92812.035 0.0001 0.00015.93.84.91.73.21.50.0001 0.0001ADH, antidiuretic hormone; FSH, follicle-stimulating hormone; GH, growth hormone; GHD, growth hormone deficiency; LH, luteinizing hormone; ITT,insulin tolerance test; PHT, pituitary/hypothalamic tumor: TSH, thyroid-stimulating hormone.https://eje.bioscientifica.comDownloaded from Bioscientifica.com at 08/15/2022 10:08:36AMvia free access
European Journal of EndocrinologyClinical StudyC Höybye and othersGHD characteristic changes overtime181:6632Figure 1Six selected dichotomous baseline characteristics by entry year. DF, luteinizing hormone/follicle-stimulating hormone deficient;GHD, growth hormone deficiency; PH, pituitary hypothalamic; RT, radiotherapy. Abnormal lipids total cholesterol 5.2 mmol/Lor on lipid-lowering medication.proportion of patients with multiple pituitary hormonaldeficiencies decreased from 93 to 87% (P-trend 0001)and further analyses showed reduced rates of all otherpituitary deficiencies (Table 1).Mean age at diagnosis of the pituitary disease andmean age at diagnosis of GHD gradually increasedfrom 40.4 years in P1 to 43.9 years in P3 (3.84 monthsper entry year); P-trend 0.0001) and from 46.2 yearsin P1 to 48.0 years in P3 (P-trend 0.001), respectively(Table 2). In contrast, the lag time from diagnosis ofpituitary disease and start in KIMS decreased by 2.9 yearsover the entry year periods (i.e., 3.3 months per entryyear; P-trend 0.0001) (Table 2). For the entire cohort,the lag time from diagnosis of pituitary disease to GHDdiagnosis decreased 1.8 years over the entry year periods(i.e., 2.2 months per entry year; P-trend 0.0001). Thetime from diagnosis of GHD to start in KIMS decreased by1.1 years over the entry year periods (i.e., 1.1 months perentry year; P-trend 0.0001). Overall, GHD was diagnosedwith one or more stimulation tests in approximately 93%of the patients: insulin-stimulation test in 55%, argininestimulation test in 13%, and glucagon-stimulation test in10%, while other tests (e.g., clonidine-stimulation test,24-h GH profile, insulin/arginine-stimulation test) wereused in the remaining patients. The use of an argininestimulation test decreased over the entry year periods,whereas there were no changes in the other diagnostictest methods and number of tests used over time (datanot shown). The mean maximum GH level after insulinstimulation test increased from 0.75 µg/L in P1 to 1.26 µg/Lin P3 (P-trend 0.0001) (Table 2). The mean maximum GHlevel also increased after the arginine-stimulation test, butthere was no change after the glucagon-stimulation test.Of note, the proportion of patients with maximum GH 3 µg/L after insulin-stimulation testing increased from3.0% in P1 to 11.4% in P3 (P-trend 0.0001; Table 1) andthe proportions of patients with confirmed severe GHDdecreased from 70% in P1 to 63% in P3 (P-trend 0.0001)https://eje.bioscientifica.comDownloaded from Bioscientifica.com at 08/15/2022 10:08:36AMvia free access
Clinical StudyTable 2C Höybye and othersGHD characteristic changes overtime633181:6Analysis of selected background characteristics in patients with adult-onset GHD deficiency by time period and changeestimate by individual entry year (n 6069).Entry year period, mean (s.d.)CharacteristicEuropean Journal of EndocrinologyAge at diagnosis of pituitary disease (years)*Age at GHD diagnosis (years)*Time from pituitary disease to KIMS start(years)†Time from pituitary disease diagnosis toGHD diagnosis (years)†Time from GHD diagnosis to KIMS start(years)†Age at KIMS start (years)*Maximum GH peak (μg/L)‡After insulin-stimulation test##After arginine-stimulation test##After glucagon-stimulation test###Thyroxine dose (μg/day)†Hydrocortisone equivalent dose (mg/day)†Linear trends (1995–2012)P1 (1994–1999)(n 1705)P2 (2000–2004)(n 2397)P3 (2005–2012)(n 1967)Change/entry year (95% CI)P value trend40.4 (14.1)46.2 (13.5)8.3 (8.2)42.2 (14.2)47.4 (13.4)7.0 (8.0)43.9 (13.8)48.0 (13.0)5.4 (7.2)0.32 (0.23–0.40)0.14 (0.055–0.22) 0.28 ( 0.33 to 0.23) 0.00010.001 0.00016.0 (8.0)5.4 (7.6)4.2 (6.8) 0.18 ( 0.22 to 0.13) 0.00012.3 (3.9)1.7 (3.4)1.2 (2.9) 0.09 ( 0.12 to 0.07) 0.000148.5 (12.9)49.1 (13.0)49.2 (12.9)0.04 ( 0.04 to 0.12)0.340.75 (0.99)0.81 (1.89)0.67 (0.68)114 (40)24.1 (9.9)0.88 (1.18)0.97 (1.50)0.67 (0.95)107 (40)22.1 (9.7)1.26 (1.87)1.41 (2.47)0.74 (0.90)95 (36)19.3 (10.0)0.04 (0.028–0.053)0.05 (0.014–0.080)0.014 ( 0.008 to 0.033) 1.8 ( 2.1 to 1.5) 0.45 ( 0.53 to 0.37) 0.00010.0050.22 0.0001 0.0001*Adjusted for gender (50%). †Adjusted for age at KIMS start and gender. ‡Patients with values 20 μg/L were excluded. #P1 (n 863), P2 (n 1244), and P3(n 960). ##P1 (n 295), P2 (n 290), and P3 (n 162). ###P1 (n 116), P2 (n 284), and P3 (n 173).GH, growth hormone; GHD, growth hormone deficiency; SD, standard deviation.(Fig. 1 and Table 1). At baseline, the proportion of patientswith thyroxine treatment decreased from 92% in P1 to86% in P3 (P-trend 0.0001) (Table 1). Baseline thyroxinedose decreased from 114 µg/day in P1 to 95 µg/day inP3 (P-trend 0.0001) (Table 2). The mean thyroxine dosedecreased on average by 1.8 µg/day per entry year (P-trend 0.0001). The mean baseline glucocorticoid replacementdose (in hydrocortisone equivalents) decreased over theperiods from 24.1 mg/day in P1 to 19.3 mg/day PD, i.e.,a mean decrease of 0.45 mg/day per entry year (P-trend 0.0001) (Table 2). Estrogen treatment decreased markedlyin women 50 years of age from 41% in P1 to 11% in P3(P-trend 0.0001) (Fig. 1 and Table 1).Mean waist circumference increased from 97.4 cm inP1 to 100.1 cm in P3 (P-trend 0.0001) and mean BMIincreased from 28.8 kg/m2 in P1 to 29.6 kg/m2 in P3 (0.07per entry year; P-trend 0.0001) (Table 3). In line withobservations for BMI and waist circumference, body fatvalues increased by entry year (0.16 kg per year; P-trend 0.0037) as measured by bioelectric impedance analysis.Measurements of body fat with DXA showed similarresults despite smaller number of observations (Table 3).Mean baseline IGF-1 SDS increased over theobservation period (P1 1.97, P2 1.37, and P3 0.94).The linear increase in baseline values was 0.1 SDS perentry year (P-trend 0.0001) (Table 3). The proportion ofpatients with abnormal cholesterol decreased from 77% inP1 to 67% in P3 (P-trend 0.0001). Mean total cholesteroldecreased from 6.08 mmol/L in P1 to 5.46 mmol/L inP3 (P-trend 0.0001) (Table 3). HDL cholesterol did notchange in a clinically meaningful manner over the entryyear periods (P-trend 0.03), while mean LDL cholesteroldecreased from 3.8 mmol/L in P1 to 3.2 mmol/L in P3(P-trend 0.0001) along with an increased percentage ofpatients treated with lipid-lowering medication from 7.2%in P1 to 12.0% in P3 (P-trend 0.0001) (Fig. 1 and Table 1).Fasting blood glucose increased from 4.95 mmol/L in P1to 5.23 mmol/L in P3, i.e., a 0.03 mmol/L change per entryyear (P-trend 0.0001) and HbA1c increased from 5.16%in P1 to 5.52% in P3, i.e. a 0.04% change per entry year(P-trend 0.0001) (Table 3). The number of patients withdiabetes mellitus increased over the observation period(P1 8.1%, P2 9.8, and P3 12.0%; P-trend 0.0001)as did those receiving antidiabetic treatment (P1 36%,P2 45%, and P3 53%; P-trend 0.0002) (Table 1).Blood pressure was clinically unchanged over theentry year periods (Table 3). The number of patientsdiagnosed with hypertension increased (P1 34%,P2 38%, and P3 39%; P-trend 0.0026), as did thenumbers on antihypertensive drugs (P1 32%, P2 43%,and P3 39%; P-trend 0.03) (Table 1). The number ofpatients smoking decreased (P1 20%, P2 17%, andP3 13%; P-trend 0.0001). The proportion of patientswith a history of cancer was similar over the entry yearperiods (data not shown). The prevalence of patientswith coronary heart disease or stroke decreased overthe entry year periods (Table 1). Baseline QoL-AGHDAscore worsened from 10.8 in P1 to 13.1 in P3 (P-trendhttps://eje.bioscientifica.comDownloaded from Bioscientifica.com at 08/15/2022 10:08:36AMvia free access
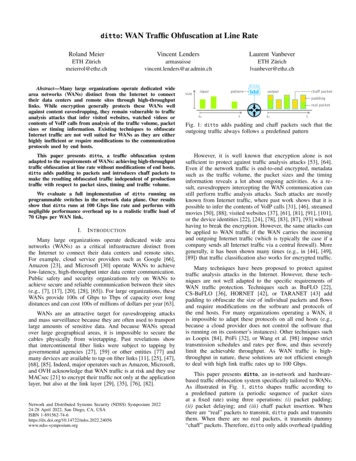
Clinical StudyTable 3C Höybye and othersGHD characteristic changes overtime181:6634Mean analyses of baseline (BL) and first treatment-year changes in selected endpoints in 6069 adults with growthhormone (GH) deficiency (GHD).European Journal of EndocrinologyEntry year period*, mean (S.E.M.)Linear trend analysis over entry years(1995–2012)P1 (1994–1999)(n 1705)P2 (2000–2004)(n 2397)P3 (2005–2012)(n 1967)BL BL BL BL BL BL 1.97 (0.04)2.14 (0.04)0.18 (0.005)0.18 (0.005)28.8 (0.14) 0.02 (0.05)97.4 (0.36) 1.9 (0.19)0.10 (0.42)6.08 (0.04) 0.29 (0.03)3.83 (0.03) 1.37 (0.04)1.87 (0.04)0.20 (0.004)0.13 (0.004)29.2 (0.12) 0.06 (0.04)98.5 (0.32) 1.4 (0.17) 0.4 (0.37)5.71 (0.04) 0.33 (0.03)3.50 (0.03) 0.94 (0.05)1.73 (0.05)0.19 (0.005)0.11 (0.005)29.6 (0.13)0.12 (0.05)100.1 (0.35) 0.2 (0.20) 0.2 (0.45)5.46 (0.04) 0.29 (0.04)3.23 (0.04) 0.0001 0.00010.11 0.00010.00010.005 0.0001 0.00010.96 0.00010.84 0.0001 BL 0.26 (0.03)4.95 (0.04) 0.31 (0.03)5.08 (0.04) 0.21 (0.03)5.23 (0.05)0.21 0.00010.11 (0.09–0.12)1.93 (1.89–1.98)0.0008 (0.0002–0.002)0.14 (0.13–0.15)0.07 (0.03–0.11)0.002 ( 0.05 to 0.05)0.25 (0.16–0.34) 1.20 ( 1.40 to 0.98)0.01 ( 0.45 to 0.48 0.05 ( 0.06 to 0.04) 0.30 ( 0.34 to 0.26) 0.056 ( 0.064 to 0.047) 0.27 ( 0.30 to 0.23)0.03 (0.02–0.04) BL BL BL 0.22 (0.04)5.16 (0.03)0.04 (0.02)10.8 (0.20) 4.5 (0.18)34.6 (0.72)9.0 (0.82)0.26 (0.04)5.49 (0.02)0.17 (0.02)12.9 (0.18) 4.5 (0.17)32.7 (0.65)10.7 (0.76)0.23 (0.05)5.52 (0.03)0.11 (0.02)13.1 (0.20) 3.8 (0.21)31.6 (0.77)8.1 (0.99)0.98 0.00010.01 0.00010.0010.00050.260.24 (0.18–0.29)0.036 (0.029–0.046)0.11 (0.08–0.13)0.22 (0.18–0.27) 4.3 ( 4.5 to 4.0) 0.33 ( 0.53 to 0.15)9.5 (8.5–10.4)EndpointAnalysisIGF-1 SDSBL: 1.48GH doseBL: 0.19 mg/dayBMIBL: 29.2 kg/m2WaistBL: 98.4 cmBL: 129 mmHgCholesterolBL: 5.76 mmol/LLDL-cholesterolBL: 3.54 mmol/LFasting bloodglucoseBL: 5.06 mmol/LHbA1cBL: 5.38%QoL-AGHDA scoreBL: 12.4 yes-itemsPhysical activityBL: 32.8P value changeper entry year BL† or ‡ values (95% CI) : First treatment-year delta analysis in which the entry year periods are compared assuming the same baseline value and analyses are also controlledfor age and gender.*Baseline analysis adjusted for age to 50 years and gender to 50% males; †BL: change/entry year (95% CI); ‡ : overall mean (95% CI).BL, baseline; CI, confidence interval; LDL, low-density lipoprotein; QoL-AGHDA, quality of life-assessment of growth hormone deficiency in adults; SDS,standard deviation score. 0.0001) (Table 3), i.e. mean linear increase of 0.2score items per entry year. GH dose at baseline wasunchanged over the over the entry year periods (P-trend0.11) (Table 3).The mean GH dose during the first year of treatmentdecreased from 0.18 mg/day in P1 to 0.11 mg/day inP3 (P-trend 0.00019) (Table 3); thus, the highest doseswere administered in P1. The overall mean change inIGF-1 SDS from baseline to 1 year after GH treatmentwas 1.93 SDS, with the largest change in P1 and lowestin P3 (P-trend 0.0001) (Fig. 2). BMI was unchanged, butmean waist circumference was 1.20 cm less after 1 yearof GH treatment, with greater change in earlier periods(P-trend 0.0001) (Table 3). The overall mean decrease inbody fat during the first year of GH treatment was 1.07 kgas assessed by bioelectric impedance analysis (95% CI 1.40 to 0.73; P 0.05) (Table 3). The change was similarduring three entry year periods (P-trend 0.12). However,the cross-sectional body fat values both at baseline andat 1 year of GH treatment were higher during later entryyear periods (Table 3). Overall, there was a statisticallysignificant increase of 1.05 kg in free lean mass duringthe first year of GH treatment as assessed by bioelectricimpedance analysis (95% CI 0.79–1.32; P 0.05) (Table3). The change was similar during three entry year periods(P-trend 0.88). The results for DXA measurementswere comparable to bioelectric impedance analysismeasurements (Table 3). Blood pressure remained stableover the first year of GH treatment across the entry yearperiods (Table 3). With respect to the overall change inlipids over the first year of the entry year periods (Table3), mean total cholesterol decreased by 0.30 mmol/L,mean LDL cholesterol decreased in parallel with totalcholesterol, no change was seen for HDL cholesterol, andmean triglycerides decreased by 0.12 mmol/L. During thefirst year of GH treatment, overall mean fasting glucoseconcentration increased by 0.24 mmol/L and HbA1c by0.11%, with similar changes across the entry year periods(Fig. 2 and Table 3). Mean decrease in QoL-AGHDA scoresafter 1 year of GH replacement was higher in P1 and P2https://eje.bioscientifica.comDownloaded from Bioscientifica.com at 08/15/2022 10:08:36AMvia free access
European Journal of EndocrinologyClinical StudyC Höybye and others181:6GHD characteristic changes overtime635Figure 2Means for six selected numerical end-point variables by baseline and first year visit over entry years. Circumf, circumference; F,fasting; GH, growth hormone; IGF-1, insulin-like growth factor 1; QoL-AGHDA, quality of life assessment of growth hormonedeficiency in adults. A full colour version of this figure is available at https://doi.org/10.1530/EJE-19-0576.compared to P3, with an overall mean decrease of 4.3score-items across the entry year periods (Table 3).DiscussionIn this study, we examined baseline characteristics of6069 patients with adult-onset GHD enrolled in KIMSfrom 1994 to 2012. We found that over time the degreeof confirmed GHD became less pronounced and patientswith diabetes mellitus were more frequently consideredfor GH replacement. Hydrocortisone and thyroxine dosesdecreased over time. The proportion of women 50years of age receiving treatment with estrogen decreased.Baseline BMI, body fat, fasting blood glucose, and HbA1cincreased; QoL became poorer; and the lipid profilebecame more favorable. The patients enrolled duringthe initial years were treated with the highest GH dosesafter one year, but the changes in body composition andmetabolic variables were similar over the entire studyperiod.Over the years, the etiology of GHD has changed,with fewer patients having pituitary adenomas. Theproportion of patients who underwent pituitary surgeryfor pituitary adenomas increased, whereas fewer weretreated with radiotherapy. Hypopituitarism is a wellknown adverse effect of radiotherapy (5) and, withfewer patients receiving this treatment, GHD and otherpituitary hormone deficiencies would be expected todecrease. Improvement of surgical techniques should havecontributed to this effect. On the other hand, more patientswith other underlying diseases causing hypopituitarismwere enrolled. This might reflect an accumulation ofexperience and confidence in GH treatment as well as aconsequence of a greater accessibility to GH, resulting inan increased possibility to treat patients.https://eje.bioscientifica.comDownloaded from Bioscientifica.com at 08/15/2022 10:08:36AMvia free access
European Journal of EndocrinologyClinical StudyC Höybye and othersThe finding that patients with GHD were diagnosedand treated with GH at an earlier point in time likelycontributed to a less profound GHD phenotype. Firstly,the maximal GH response to stimulation tests, althoughstill consistent with guidelines (3, 5), increased over theyears, as did IGF-1 SDS. Furthermore, the lag time from thediagnosis of GHD to initiation of GH treatment decreased.Based on these findings, less pronounced consequencesof GHD would be anticipated. Surprisingly, QoL-AGHDAscores increased, indicating worsening of QoL across theentry year periods. This possibly reflects a patient selectionbias, that is, the change in the underlying etiology of GHD:for example, the increase in the proportion of patientswith traumatic brain injury may affect QoL. Alternatively,patients with poor QoL were more likely to receive GHtreatment.Hydrocortisone doses decreased over the entry yearperiods, which is in accordance with guidelines (26). Lessexpected was the decrease in thyroxine doses that wasobserved. This finding is seemingly in disagreement witha previous study which reported an under-treatment ofcentral hypothyroidism based on measurements of serumfree thyroxine (27). However, as the present study indicatesmilder pituitary insufficiency and, thereby, milder centralhypothyroidism, the required thyroxine dose wouldbe lower. The marked decrease in estrogen use amongstwomen 50 years of age is probably a consequence ofmore recent standard of care, mainly brought about by theWomen’s Health Initiative Study in which an associationbetween estrogen replacement therapy after menopauseand cardiovascular risk was reported (28).The current study showed a decrease over the entryyear periods in GH doses after 1 year of treatment. Weinterpret this as a consequence of the patients becomingless GH deficient over time as discussed previously.In line with previous studies, we found that duringthe study period baseline values of BMI, fasting plasmaglucose, and HbA1c as well as the proportion of patientstreated with antidiabetic medication increased acrossthe entry year periods (29). The prevalence of diabetesmellitus has increased substantially in the backgroundpopulation in all countries from 4.7% in 1980 to 8.5%in 2014 (30, 31). Therefore, it seems likely that
tests, BMI, and waist circumference increased. The use of radiotherapy, glucocorticoid replacement doses, and the proportion of women 50 years on estrogen replacement therapy decreased. The effects of 1 year of GH replacement were similar over the entry year periods despite changes in the patients' baseline characteristics. An expected increase


![Change Management Process For [Project Name] - West Virginia](/img/32/change-20management-20process-2003-2022-202012.jpg)