Transcription
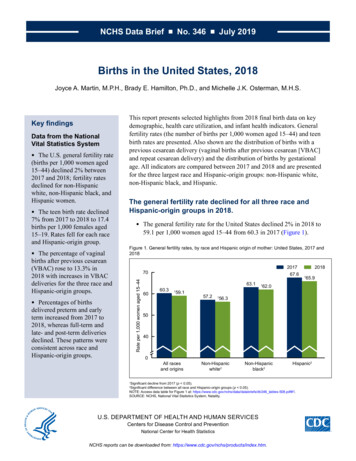
NCHS Data Brief No. 346 July 2019Births in the United States, 2018Joyce A. Martin, M.P.H., Brady E. Hamilton, Ph.D., and Michelle J.K. Osterman, M.H.S.Data from the NationalVital Statistics SystemThe U.S. general fertility rate(births per 1,000 women aged15–44) declined 2% between2017 and 2018; fertility ratesdeclined for non-Hispanicwhite, non-Hispanic black, andHispanic women. The teen birth rate declined7% from 2017 to 2018 to 17.4births per 1,000 females aged15–19. Rates fell for each raceand Hispanic-origin group. The percentage of vaginalbirths after previous cesarean(VBAC) rose to 13.3% in2018 with increases in VBACdeliveries for the three race andHispanic-origin groups. This report presents selected highlights from 2018 final birth data on keydemographic, health care utilization, and infant health indicators. Generalfertility rates (the number of births per 1,000 women aged 15–44) and teenbirth rates are presented. Also shown are the distribution of births with aprevious cesarean delivery (vaginal births after previous cesarean [VBAC]and repeat cesarean delivery) and the distribution of births by gestationalage. All indicators are compared between 2017 and 2018 and are presentedfor the three largest race and Hispanic-origin groups: non-Hispanic white,non-Hispanic black, and Hispanic.The general fertility rate declined for all three race andHispanic-origin groups in 2018. The general fertility rate for the United States declined 2% in 2018 to59.1 per 1,000 women aged 15–44 from 60.3 in 2017 (Figure 1).Figure 1. General fertility rates, by race and Hispanic origin of mother: United States, 2017 and2018201770Rate per 1,000 women aged 15–44Key findingsPercentages of birthsdelivered preterm and earlyterm increased from 2017 to2018, whereas full-term andlate- and post-term deliveriesdeclined. These patterns wereconsistent across race andHispanic-origin groups. 6067.660.363.1159.157.2112018165.962.056.350400All racesand c2Significant decline from 2017 (p 0.05).Significant difference between all race and Hispanic-origin groups (p 0.05).NOTE: Access data table for Figure 1 at: https://www.cdc.gov/nchs/data/databriefs/db346 tables-508.pdf#1.SOURCE: NCHS, National Vital Statistics System, Natality.12U.S. DEPARTMENT OF HEALTH AND HUMAN SERVICESCenters for Disease Control and PreventionNational Center for Health StatisticsNCHS reports can be downloaded from: https://www.cdc.gov/nchs/products/index.htm.
NCHS Data Brief No. 346 July 2019 Fertility rates declined for the three largest race and Hispanic-origin groups from 2017to 2018, down 2% for non-Hispanic white and non-Hispanic black women and 3% forHispanic women. In 2018, the fertility rate was highest for Hispanic women (65.9), followed by non-Hispanicblack (62.0) and non-Hispanic white (56.3) women.Teen birth rates declined for all three race and Hispanic-origin groups in2018. The birth rate for females aged 15–19 declined 7% from 18.8 births per 1,000 females in2017 to 17.4 in 2018 (Figure 2). Among race and Hispanic-origin groups, teen birth rates declined by 4% for non-Hispanicblack teenagers and 8% for non-Hispanic white and Hispanic teenagers from 2017 to 2018. In 2018, rates for the three groups were lowest for non-Hispanic white teenagers (12.1),followed by non-Hispanic black teenagers (26.3) and Hispanic teenagers (26.7).Figure 2. Birth rates for females aged 15–19, by race and Hispanic origin of mother: United States, 2017 and 2018201730Rate per 1,000 females aged 00All racesand cant decline from 2017 (p 0.05).Significant difference between all race and Hispanic-origin groups (p 0.05).NOTE: Access data table for Figure 2 at: https://www.cdc.gov/nchs/data/databriefs/db346 tables-508.pdf#2.SOURCE: NCHS, National Vital Statistics System, Natality.12 2 Hispanic2
NCHS Data Brief No. 346 July 2019The rate of vaginal births after previous cesarean delivery rose in 2018. The percentage of VBAC deliveries increased in 2018 to 13.3% of women with a previouscesarean delivery from 12.8% in 2017, whereas the repeat cesarean rate declined to 86.7%of women with a previous cesarean in 2018 from 87.2% in 2017 (Figure 3). The percentage of VBAC deliveries increased in 2018 for both non-Hispanic white (13.0%in 2017 to 13.5% in 2018) and Hispanic (12.0% to 12.7%) women. Consequently, thepercentages of repeat cesarean deliveries for both groups declined. For non-Hispanic black women, the increase in the VBAC percentage (12.8% in 2017 to13.0% in 2018) was not significant. Among the three largest race and Hispanic-origin groups, non-Hispanic white women hadthe highest VBAC percentage in 2018 (13.5%), followed by non-Hispanic black (13.0%)and Hispanic (12.7%) women.Figure 3. Percent distribution of births by method of delivery for births with a previous cesarean delivery, by race andHispanic origin of mother: United States, 2017 and 201810012.8113.313.0113.512.813.012.0112.7Vaginal birth afterprevious cesarean287.2386.787.0386.587.287.088.0387.3Repeat 6040200All races icSignificant increase from 2017 (p 0.05).Significant difference between all race and Hispanic-origin groups (p 0.05).Significant decline from 2017 (p 0.05).NOTES: Includes only births with a previous cesarean delivery. Repeat cesarean rate is the number of births to women having a cesarean delivery per 100 birthsto women with a previous cesarean delivery. Vaginal birth after cesarean delivery rate is the number of births to women having a vaginal delivery per 100 births towomen with a previous cesarean delivery. Access data table for Figure 3 at: https://www.cdc.gov/nchs/data/databriefs/db346 tables-508.pdf#3.SOURCE: NCHS, National Vital Statistics System, Natality.123 3
NCHS Data Brief No. 346 July 2019The distribution of births by gestational age shifted to earlier deliveriesfrom 2017 to 2018. The percentage of all births delivered at less than full term (less than 39 weeks) increasedfrom 2017 to 2018 with rises seen among both preterm (9.93% to 10.02%) and early-term(26.00% to 26.53%) births (Figure 4). Concurrently, the percentages of births delivered at full term and late and post termdeclined. Full-term births were down from 57.49% in 2017 to 57.24% in 2018; late- andpost-term births declined from 6.58 % to 6.20%. Both preterm and early-term birth rates rose for each of the race and Hispanic-origin groupsfrom 2017 to 2018, although the increase in preterm births to non-Hispanic white motherswas not significant. Infants delivered to non-Hispanic black mothers were more likely to be born preterm(14.13% compared with 9.09% for non-Hispanic white and 9.73% for Hispanic mothers in2018) and early term (29.64% compared with 24.68% and 28.05%, respectively).Figure 4. Percent distribution of births, by gestational age and race and Hispanic origin of mother: United States, 2017and 20181006.5816.207.5117.075.2414.895.6615.39Late and post 6459.1657.15127.58356.83 Full term2402002017All races andorigins24.68Non-Hispanicwhite13.93201728.05 Early reterm2HispanicSignificant decline from 2017 (p 0.05).Significant difference between all race and Hispanic-origin groups (p 0.05).Significant increase from 2017 (p 0.05).NOTES: Preterm is less than 37 weeks of gestation, early term is 37–38 weeks, full term is 39–40 weeks, and late and post term is 41 weeks or more. Access datatable for Figure 4 at: https://www.cdc.gov/nchs/data/databriefs/db346 tables-508.pdf#4.SOURCE: NCHS, National Vital Statistics System, Natality.123 4
NCHS Data Brief No. 346 July 2019SummaryBirth certificate data for 2018 show continued declines in childbearing in the United Statesoverall and among the three largest race and Hispanic-origin groups. The 2018 general fertilityrate fell to another all-time low for the United States and for each race and Hispanic-origin groupshown in this report (1,2). Teen childbearing also declined to record lows overall and for the threerace and Hispanic-origin groups (1–3). VBACs increased in 2018; VBACs have been on the risesince 2016, when national data for previous cesarean deliveries became available again in thenational birth certificate data (2). Preterm and early-term deliveries continued to rise in 2018 andhave been trending upward since 2014 (2).These 2018 data mark the third year for which national data for most items that were new to, orchanged with, the 2003 revision of the U.S. Standard Certificate of Live Birth, including VBACand repeat cesarean, have been available.DefinitionsGeneral fertility rate: Number of births per 1,000 women aged 15–44.Teen birth rate: Number of births per 1,000 females aged 15–19.Vaginal birth after cesarean delivery rate (VBAC): Number of births to women having a vaginaldelivery per 100 births to women with a previous cesarean delivery.Repeat cesarean rate: Number of births to women having a cesarean delivery per 100 births towomen with a previous cesarean delivery.Preterm birth rate: Births delivered prior to 37 completed weeks of gestation per 100 births.Gestational age is based on the obstetric estimate of gestation.Early-term birth rate: Births delivered at 37–38 completed weeks of gestation per 100 births.Full-term birth rate: Births delivered at 39–40 completed weeks of gestation per 100 births.Late- and post-term birth rate: Births delivered at 41 or more completed weeks of gestation per100 births. 5
NCHS Data Brief No. 346 July 2019Data source and methodsThis report uses data from the Natality Data File from the National Vital Statistics System. Thevital statistics natality file is based on information derived from birth certificates and includesinformation for all births occurring in the United States. This data brief accompanies the releaseof the 2018 natality public-use file (4). More detailed analysis of the topics presented in thisreport and many others such as births to unmarried women, prenatal care, tobacco use duringpregnancy, pregnancy risk factors, receipt of WIC food, maternal morbidity, and breastfeeding ispossible by using the annual natality files (4).The race and Hispanic-origin groups shown in this report follow the 1997 Office of Managementand Budget standards and differ from the bridged-race categories shown in reports prior to2016 (1).References to increases or declines in rates or percentages indicate that differences are statisticallysignificant at the 0.05 level based on a two-tailed z test. Computations exclude records for whichinformation is unknown.About the authorsJoyce A. Martin, Brady E. Hamilton, and Michelle J.K. Osterman are with the National Center forHealth Statistics, Division of Vital Statistics, Reproductive Statistics Branch. 6
NCHS Data Brief No. 346 July 2019References1. Martin JA, Hamilton BE, Osterman MJK, Driscoll AK, Mathews TJ. Births: Final data for2015. National Vital Statistics Reports; vol 66 no 1. Hyattsville, MD: National Center for HealthStatistics. 2017.2. Martin JA, Hamilton BE, Osterman MJK, Driscoll AK, Drake P. Births: Final data for 2017.National Vital Statistics Reports; vol 67 no 8. Hyattsville, MD: National Center for HealthStatistics. 2018. Available from: https://www.cdc.gov/nchs/data/nvsr/nvsr67/nvsr67 08-508.pdf.3. Ventura SJ, Hamilton BE, Mathews TJ. National and state patterns of teen births in the UnitedStates, 1940–2013. National Vital Statistics Reports; vol 63 no 4. Hyattsville, MD: NationalCenter for Health Statistics. 2014. Available from: https://www.cdc.gov/nchs/data/nvsr/nvsr63/nvsr63 04.pdf.4. National Center for Health Statistics. Vital statistics online data portal for natality public usefile. Available from: https://www.cdc.gov/nchs/data access/VitalStatsOnline.htm. 7
U.S. DEPARTMENT OFHEALTH & HUMAN SERVICESFIRST CLASS MAILPOSTAGE & FEES PAIDCDC/NCHSPERMIT NO. G-284Centers for Disease Control and PreventionNational Center for Health Statistics3311 Toledo Road, Room 4551, MS P08Hyattsville, MD 20782–2064OFFICIAL BUSINESSPENALTY FOR PRIVATE USE, 300For more NCHS Data Briefs, .htm.NCHS Data Brief No. 346 July 2019Keywords: fertility rates teen childbearing previous cesarean delivery gestational age National Vital Statistics SystemSuggested citationMartin JA, Hamilton BE, Osterman MJK.Births in the United States, 2018. NCHSData Brief, no 346. Hyattsville, MD:National Center for Health Statistics. 2019.Copyright informationAll material appearing in this report is inthe public domain and may be reproducedor copied without permission; citation as tosource, however, is appreciated.National Center for HealthStatisticsJennifer H. Madans, Ph.D., Acting DirectorAmy M. Branum, Ph.D., Acting AssociateDirector for ScienceDivision of Vital StatisticsSteven Schwartz, Ph.D., DirectorHanyu Ni, Ph.D., M.P.H., Associate Directorfor ScienceFor e-mail updates on NCHS publicationreleases, subscribe online at:https://www.cdc.gov/nchs/govdelivery.htm.For questions or general informationabout NCHS:Tel: 1–800–CDC–INFO (1–800–232–4636)TTY: 1–888–232–6348Internet: https://www.cdc.gov/nchsOnline request form: https://www.cdc.gov/infoISSN 1941–4927 Print ed.ISSN 1941–4935 Online ed.DHHS Publication No. 2019–1209CS308148
Joyce A. Martin, M.P.H., Brady E. Hamilton, Ph.D., and Michelle J.K. Osterman, M.H.S. . Hispanic women. The teen birth rate declined 7% from 2017 to 2018 to 17.4 births per 1,000 females aged 15-19. Rates fell for each race and Hispanic-origin group. . vital statistics natality file is based on information derived from birth certificates .