Transcription
Number 51 n April 12, 2012Fertility of Men and Women Aged 15–44 Years in theUnited States: National Survey of Family Growth,2006–2010by Gladys Martinez, Ph.D.; Kimberly Daniels, Ph.D.; and Anjani Chandra, Ph.D., Division of Vital StatisticsAbstractObjective—This report presents national estimates of the fertility of men andwomen aged 15–44 years in the United States in 2006–2010 based on the NationalSurvey of Family Growth (NSFG). Data are compared with similar measures for2002.Methods—Descriptive tables of numbers, percentages, and means are presentedand discussed. Data were collected through in-person interviews of a nationallyrepresentative sample of the household population aged 15–44 years in the UnitedStates between July 2006 and June 2010. The 2006–2010 NSFG sample iscomprised of 22,682 respondents including 10,403 men and 12,279 women. Theoverall response rate for the 2006–2010 NSFG was 77%, 75% for men and 78% forwomen.Results—Many of the fertility measures among men and women aged 15–44based on the 2006–2010 NSFG were generally similar to those reported based onthe 2002 NSFG. The mean age at first child’s birth for women was 23 and themean age at first child’s birth for men was 25. One-half of first births to womenwere in their 20s and two-thirds of first births were fathered by men who were intheir 20s. On average, women aged 15–44 have 1.3 children as of the time of theinterview. By age 40, 85% of women had had a birth, and 76% of men had fathereda child. In 2006–2010, 22% of first births to women occurred within cohabitingunions, up from 12% in 2002. These measures differed by Hispanic origin and raceand other demographic characteristics.Keywords: parity number of children born age at first birth marital statusat birth nonmarital birthsIntroductionThis report presents nationalestimates of different fertility measuresfor both men and women in the UnitedStates for the period 2006–2010.Fertility refers to the number of livebirths that occur to an individual. In2008, there were 4.2 million births inthe United States (1). The averagefertility of women in the United Stateswas about seven children at thebeginning of the 19th century, itdeclined slowly and by 1960 it was 3.7children per woman (2,3). Fertility inthe United States dropped to its lowestpoint in 1976 at an average of 1.7children per woman and has remainedrelatively stable at around 2.1 childrenper woman (1,4–7).While fertility in the United Stateshas remained stable since the 1970s,there is variation by subgroups includingage, race, ethnicity, education, andmeasures of socioeconomic status.Researchers have often examined theintermediate characteristics that help toexplain fertility such as fecundity (theability to have children), timing ofsexual intercourse, time spent in sexualrelationships, and use of contraception(8). Others have looked at timing offertility, the composition of those whohave children, the number of childrenborn, the union status at childbirth, etc(9–14).The National Survey of FamilyGrowth (NSFG) has collected data onfertility and the intermediate factors thatexplain fertility in the United Statessince 1973. The Centers for DiseaseControl and Prevention’s NationalCenter for Health Statistics (NCHS)conducts the NSFG. The NSFG isjointly planned and funded by NCHSand several other programs of the U.S.Department of Health and HumanServices (see Acknowledgments). Thisreport presents selected data on theU.S. DEPARTMENT OF HEALTH AND HUMAN SERVICESCenters for Disease Control and PreventionNational Center for Health Statistics
Page 2fertility experience of 15–44-year-oldmales and females in the United Statesusing the 2006–2010 NSFG, and alsopresents trends in these measures since2002.BackgroundIn the last two decades, fertilityresearch in the United States hasfocused on timing of childbearing (e.g.,adolescent childbearing), the context offertility (e.g., nonmarital childbearing),and on high fertility groups.Early childbearingThe United States’ teenage birthrate in 2010 was 34.3 births per 1,000females aged 15–19 (5,15). Althoughthis represents a 44% decline from thepeak rate in 1991, the United States’teenage birth rate continues to be higherthan that of other developed countries(16). Within the United States there arelarge variations in the teenage birth rateby various characteristics includingHispanic origin and race. Having a childat an early age (e.g., teenagers) isassociated with negative social,economic, and health consequences forthe young woman and her child(1,17–19). There is debate on how muchof the consequences of a teenage birthare the result of the mother’s earlierbackground characteristics rather thanthe birth itself (20,21). Nonetheless,teenage childbearing in the UnitedStates cost taxpayers at least 10.9billion in 2008 (22).Nonmarital childbearingOver the past several decades,nonmarital childbearing has increasedamong women in all ages and Hispanicorigin and race subgroups. In 1970, 11%of all live births were to unmarriedwomen compared with 41% of all livebirths in 2009 (5). At the same time,there has been an increase in theproportion of women living incohabiting unions and a greaterproportion of nonmarital births occur towomen living with a partner. One of theconcerns with the increase in nonmaritalchildbearing is that children bornoutside of a marital union experienceNational Health Statistics Reports n Number 51 n April 12, 2012more family transitions, less stability,and may have fewer resources (23,24).Another concern with nonmaritalchildbearing is that a large proportion ofbirths outside of marriage occur towomen who did not intend theconception. Among births between 1999and 2002, 77% of those to marriedwomen were intended at conception,while only 35% of those to nevermarried women were intended atconception (25). Because of thisobserved relationship, increases innonmarital childbearing raise publichealth concerns given the documentedadverse effects to babies born to womenwho did not intend to become pregnantand for the women themselves (26–29).Variations by race, ethnicity,and educationFertility levels are also known tovary across population subgroups suchas race and ethnicity and educationalattainment (5,25,30). Women with lowereducational attainment have earlier andhigher total fertility than those withmore education (30). A significantproportion of this difference can beexplained by higher levels of unintendedbirths among women with less education(13). In addition, women with lesseducation are less likely than others touse contraception (31). At least some ofthe association between early fertilityand educational attainment results fromsome young women leaving school earlywhen they become pregnant. Racial andethnic variation is seen in both thetiming of fertility and total fertility. Onaverage, the Hispanic and non-Hispanicblack populations have earlier andhigher fertility than other racial andethnic groups (1,30). Considerableresearch attention has been focused onthe high fertility of immigrant groups;for example, the fertility of foreign-bornMexican women is, on average, higherthan those who are U.S. born (32).MethodsData collectionThe NSFG was established and firstconducted by NCHS in 1973. Sincethen, the NSFG has been conductedseven times by NCHS—in 1973, 1976,1982, 1988, 1995, 2002, and mostrecently, in 2006–2010. In 1973 and in1976, the survey interviewed womenaged 15–44 years who were currentlymarried or had been married; it wasthen considered too sensitive tointerview never-married women onfertility-related topics. In 1982, as thepercentage of births to unmarriedwomen continued to increase, the surveywas expanded to include women aged15–44 regardless of marital experience.Thus, the sample began to include allfemales aged 15–44 including nevermarried teenagers and women. In 2002,the NSFG began to interview malesaged 15–44, allowing analysis of anationally representative sample ofmales as well.The 2006–2010 NSFG was basedon 22,682 face-to-face interviews—12,279 with women and 10,403 withmen aged 15–44 years in the householdpopulation of the United States. Menand women living on military bases orin institutions were not included in thesurvey. The sample did include personstemporarily living away from thehousehold in a college dormitory,sorority, or fraternity (33). Theinterviews were administered in personby trained female interviewers primarilyin the respondents’ homes. The 2006–2010 sample is a nationallyrepresentative multistage areaprobability sample drawn from 110areas, or ‘‘Primary Sampling Units’’(PSUs) across the country. To protectthe respondent’s privacy, only oneperson was interviewed in each selectedhousehold. In 2006–2010, persons aged15–19 and black and Hispanic adultswere sampled at higher rates thanothers.All respondents were given writtenand oral information about the surveyand informed that participation wasvoluntary. Adult respondents aged 18–44years were asked to sign a consent form,but were not required to do so; a verysmall percentage of adult respondentsdeclined to sign the consent form. Forminors aged 15–17 years, signedconsent was required first from a parentor guardian, and then signed assent was
National Health Statistics Reports n Number 51 n April 12, 2012required from the minor: If either theparent or the minor declined to givewritten consent, the minor did notparticipate in the survey. The responserate for the 2006–2010 NSFG was 77%overall and 75% for men and 78% forwomen. The interviews lasted anaverage of about 80 minutes for femalesand 60 minutes for males. More detailedinformation about the methods andprocedures of the NSFG and its sampledesign, weighting, imputation, andvariance estimation has been published(33).Demographic variables usedin this reportThe fertility data presented in thisreport are shown with respect to severalkey demographic characteristics—including age, marital status, education,parental living arrangements inadolescence, and Hispanic origin andrace. Age of respondent, marital status,and educational attainment reflect statusat the time of the interview. Educationalattainment is shown only forrespondents aged 22–44 because largepercentages of those aged 15–21 are stillattending school. Fertility indicators arealso shown for proxy measures of therespondent’s socioeconomic status.These include the educational attainmentof the respondent’s mother and parentalliving arrangements at age 14.The definition of Hispanic originand race used in this report takes intoaccount the reporting of more than onerace, in accordance with the 1997guidelines from the Office ofManagement and Budget (34,35). Formost tables in this report, separateestimates are presented for single raceand non-Hispanic respondents who areblack, white, or Asian. Hispanicrespondents, regardless of their racialidentification, are shown separately, andwhere sample sizes permit, arecategorized by their nativity status. Forconvenience in writing, the term‘‘black’’ or ‘‘non-Hispanic black’’ willbe used instead of the full phrase,‘‘non-Hispanic black or AfricanAmerican, single race.’’ Similarly, theterm ‘‘white’’ or ‘‘non-Hispanic white’’will be used instead of the full phrase‘‘non-Hispanic white, single race.’’Further technical details and definitionof terms can be found in the technicalnotes and in earlier NSFG reports (25).Strengths and limitations ofthe dataThe strengths of the data in thisreport, based primarily on the 2006–2010 NSFG, include the following: The data are drawn from interviewswith large nationally representativesamples of men and women in thereproductive ages 15–44 years of age. The data from each survey wereprocessed and coded to make them ascomparable as possible, so that trendscould be measured reliably acrosscycles. The interviews in each cycle wereconducted in person by professional,trained, female interviewers.Interviewers were supplied withvisual aids, such as show-cards,life-history calendars, and ‘‘helpscreens’’ containing definitions ofterms and other guides. These wereused to help clarify terms andconcepts for the respondent, so thatmeanings were standardized acrossrespondents, thereby enhancing thequality of the data. The NSFG includes an array ofcharacteristics to measure differentaspects of male and female fertility.In addition, the NSFG collectedextensive data on intermediatecharacteristics that influence fertilitysuch as age at menarche, sexualactivity, contraceptive use, unionstatus, breastfeeding, and otherchildbearing experiences. The NSFGalso collects information on thecontext of fertility and therelationship with a partner at the timeof the birth. The response rates for the surveyhave been high—about 80% in 2002,and despite an increasinglychallenging climate for surveys,response rates remained high for2006–2010 at 77%.The data in this report also havesome limitations:Page 3 Like all survey data, these data aresubject to sources of nonsamplingerror. These include interviewer andrespondent factors such as possiblemisunderstanding of questions on thepart of the interviewer or respondentand bias due to giving sociallydesirable answers. The preparationand the conduct of the survey weredesigned specifically to minimizethese sources of error (33). Because the NSFG is a crosssectional survey, it is also subject torecall error. Questions rely onrespondents’ recall when reporting ontheir past experiences. Given thedetail asked of women, the NSFGuses a life history calendar to helpwomen remember specific dates bywriting down other key demographicmarkers (e.g., dates of high schoolgraduation, marriages anddissolutions, and children’s births) tohelp their recall. While no life historycalendar is used for the male survey,men are asked fewer dates thanwomen and are asked about childrenwithin the context of a relationshipsto help with recall. The NSFG is designed to providenational estimates by demographicsubgroups; it is not designed to yieldestimates for individual states. The data presented in this report arebivariate associations that may beexplained by controlling for otherfactors that our tables do not takeinto account. For example, therelationship between parental livingarrangement at age 14 and some ofthese fertility measures may beexplained by differential economicresources between single parenthouseholds and two parenthouseholds rather than the householdstructure itself.Statistical analysisAll estimates in this report wereweighted to reflect the approximately 62million men and 62 million women aged15–44 in the household population ofthe United States. Statistics for thisreport were produced using SASsoftware, Version 9.2 (http://www.sas.com). For most tables we used PROC
National Health Statistics Reports n Number 51 n April 12, 2012Page 4SURVEYFREQ to produce weightedcross tabulations that took into accountthe complex sampling design of theNSFG in calculating estimates ofstandard errors. Each table in this reportincludes standard errors as a measure ofthe precision of each point estimate. Inaddition, PROC LIFETEST was usedfor Table 8 to calculate probabilities of afirst birth at selected ages from 18 to 40years using life table methodology. Dataare presented for ages 18, 20, 25, 30,35, and 40 years. Probabilities arecalculated based on retrospectivereporting of the age at the first birth.Significance of differences amongsubgroups was determined by standardtwo-tailed t-tests using point estimatesand their standard errors. Noadjustments were made for multiplecomparisons. The difference betweenany two estimates is mentioned in thetext only if it is statistically significant.However, if a comparison is not made,it may or may not be significant.Otherwise, terms such as ‘‘similar’’ or‘‘no significant differences’’ are used toindicate that the estimates beingcompared were not significantlydifferent.In the description of the resultsbelow, when the percentage being citedis below 10%, the text will cite thepercentage to one decimal point. Tomake reading easier and to remind thereader that the results are based onsamples and subject to sampling error,percentages above 10 will generally beshown rounded to the nearest wholepercentage. Readers should pay closeattention to the sampling errors forsmall groups. In this report, percentagesare not shown if the sampledenominator is less than 100 cases, orthe numerator is less than 5 cases. Whena percentage or other statistic is notshown for this reason, the table containsan asterisk (*) signifying that the‘‘statistic does not meet standards ofreliability or precision.’’ For moststatistics presented in this report, thenumerators and denominators are muchlarger. This report is intended to presentselected statistics on trends anddifferences in selected measures of thefertility of men and women in theUnited States through 2006–2010. Theresults presented in this report aredescriptive and do not attempt todemonstrate cause-and-effectrelationships.ResultsNumber of children born andchildlessnessThe parenthood experience of U.S.men and women aged 15–44 in the lastdecade is very similar. There was nochange between 2002 and 2006–2010 inthe percentage of men and women thathad a biological child (Table 1). By‘‘had a biological child’’ we mean thatthe woman gave birth to a biologicalchild or that the man fathered abiological child, regardless if the childlives with them now. In 2006–2010 asin 2002, women (56%) in this age rangewere more likely than men (45%) tohave had a child. Higher educational attainment wasassociated with lower percentages ofwomen with a biological child. Forexample, 53% of women with abachelor’s degree or higher had abiological child compared with 88%with less than a high school diploma. Hispanic women are more likely tohave had a biological child (65%)than non-Hispanic white women(52%), but there were no differencesbetween Hispanic and non-Hispanicblack (62%) women. Meanwhile, ahigher percentage of Hispanic menhad a biological child (54%)compared with both white (41%) andblack (49%) men. Looking at nativity, higherpercentages of foreign-born Hispanicmen and women had a childcompared with those born in theUnited States. For foreign-bornHispanic women, 78% had abiological child compared with 51%of U.S.-born Hispanic women. Thepercentage of U.S.-born Hispanicwomen with a biological child issimilar to that of white women.While the majority of women havehad a child, a large percentage ofwomen at any point are childless. TheNSFG data can be used to characterizechildless women as temporarilychildless, voluntarily childless, ornonvoluntarily childless (Table 2). Mostchildless women aged 15–44 years are‘temporarily childless,’ meaning that thatthey expect to have one or morechildren in the future. Voluntarilychildless women are those who expectto have no children in their lifetimes,and are either fecund (physically able tohave a birth) or are surgically sterile forcontraceptive reasons. Nonvoluntarilychildless women are those who expectto have no children in their lifetimes,but have impaired fecundity or aresurgically sterile for reasons other thancontraception. Among the 61.8 million women aged15–44 years in 2006–2010, 43% werechildless; of those who were childless34% were temporarily childless, 2.3%nonvoluntarily childless, and 6.0%voluntarily childless. The percentagevoluntarily childless is similar toprevious rounds of the NSFG: 6.2%in 2002, 6.6% in 1995, 6.2% in 1988,and 4.9% in 1982 (9). Table 2 also describes thecharacteristics of women withchildren and childless women. Forexample, women with children weremore likely to be older and currentlymarried than childless women overall.Childless women were more likely tobe younger, never married, with somecollege or higher education, andwhite compared with women withchildren. Among the childless women,voluntarily childless women weremore likely to be older, currentlymarried or currently cohabiting, andwhite compared with temporarilychildless women. Nonvoluntarilychildless women were more likely tobe older and currently marriedcompared with voluntarily childlesswomen. Hispanic women accounted for ahigher percentage of mothers (20%)and those temporarily childless (15%)than those voluntarily (8.8%) ornonvoluntarily (9.0%) childless.Black women accounted for a higherpercentage of mothers (15%) than thechildless (12%).
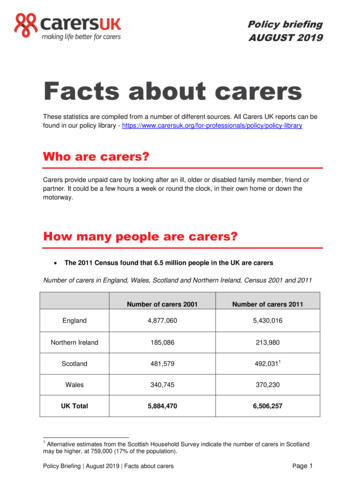
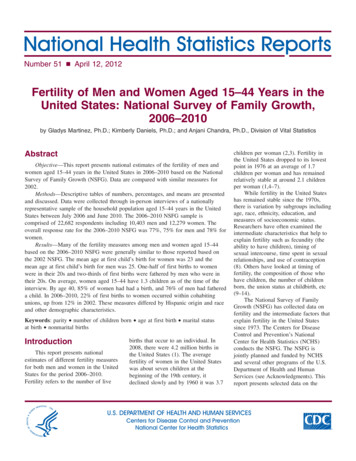
National Health Statistics Reports n Number 51 n April 12, 2012Page 5MenWomen43Average2.521.71.81.31.51.011.11.00No high schooldiploma or GEDHigh schooldiploma or GEDSome collegeBachelor's degreeor higherNOTE: GED is General Educational Development high school equivalency diploma.SOURCES: CDC/NCHS, National Survey of Family Growth, 2006–2010. Tables 3 and 4 in this report.Figure 1. Average number of children ever born or fathered for women and men aged22–44 years, by education: United States, 2006–2010The number of children born towomen aged 15–44 overall varieswidely by selected characteristics(Table 3). The mean or average number ofchildren born to women aged 15–44is unchanged between 2002 and2006–2010 at 1.3 births per woman.By age 40–44, the mean number ofchildren born to women was 2.1,which is consistent with the meannumber of children born to women inthe United States based on vitalstatistics (1). Women who were currently marriedor formerly married had the highestmean number of children born, 1.9and 2.0, respectively. Table 1 shows that men and womenwith lower levels of education weremore likely to have had a child. Theyalso had higher average numbers ofchildren born (Tables 3, 4, andFigure 1). Additionally, nearly one infour women with less than a highschool diploma had four or morechildren (24%), more than twice thepercentage for any other educationgroup. Women with household incomes lessthan 150% of the poverty level at thetime of interview were more likely tohave four or more children than thosewith higher incomes. The mean number of children bornwas higher for foreign-born Hispanicwomen (2.1) compared with U.S. born Hispanic women (1.2). Themean number of children born forU.S.-born Hispanic women wassimilar to that of white women.Variations in the distribution andmean (average) number of biologicalchildren fathered by men aged 15–44are presented in Table 4 andcomplement the data for women inTable 3. The mean number of childrenfathered by men in 2006–2010 (.9children) was similar to 2002 (1.0). Currently married men had thehighest mean number of childrenfathered (1.7 children), followed byformerly married men (1.5 children). Education was not only associatedwith the likelihood of having had achild, but also with the number ofchildren fathered. Men with abachelor’s degree or higher had alower mean number of childrenfathered (1.0) compared with menwith less than a high school diploma(1.7) or to those with a high schooldiploma (1.3). There was nodifference in the mean number ofchildren fathered between men withsome college education and thosewith a bachelor’s degree or higher. Men with the lowest level ofeducation were more likely to havefour or more children (10%). Only3.1% of men with a bachelor’s degreeor higher had four or more children.The differences in the percentage ofmen with four or more childrenamong other educational groups werenot significant. As was true for women, foreign-bornHispanic men had a higher meannumber of children born thanU.S.-born Hispanic men.Fertility estimates for the UnitedStates are also available from CDC’sNCHS’ National Vital Statistics System(NVSS). NSFG data approximate thenumber of births recorded in theNVSS—especially for women (see‘‘Technical Notes’’ table). Data on malefertility is less precise from the NVSSbecause mothers are the primaryreporter of data for the birth registrationsystem. Estimates of male fertility fromthe NSFG come from male’s reportingof their children.Births expectedVariations in the mean number ofchildren born, additional births expected,and the total births expected for menand women are presented in Table 5.There were no changes between2002 and 2006–2010 in the meannumber of children born, additionalbirths expected, and total births expectedfor men or women. As expected, women who werenoncontraceptively sterile or hadimpaired fecundity expected fewerbirths. While men’s sterility status(36) cannot be defined in acomparable manner, nonsurgicallysterile men expected a lower meannumber of total births (1.2) comparedwith men in the other sterility statuscategories shown (2.2–2.4). For men and women, those with lessthan a high school diploma expecteda higher number of total birthscompared with those with othereducation levels. There were nodifferences in total births expectedamong men and women across theother education levels.Table 5 and Figure 2 show thatforeign-born Hispanic women expectedmore births than U.S.-born Hispanicwomen. The mean number of birthsexpected for foreign-born Hispanicwomen was 2.9 and for U.S.-born
National Health Statistics Reports n Number 51 n April 12, 2012Page 64Average3Average number of additionalchildren expectedAverage number of children ornHispanicBlackAsianSOURCES: CDC/NCHS, National Survey of Family Growth, 2006–2010. Table 5 in this report.Figure 2. Average number of children born, additional children expected, and total birthsexpected for women aged 15–44 years, by Hispanic origin and race: United States,2006–2010Hispanic women it was 2.6. The samerelationship holds true for men.Looking at all women aged 15–44years in 2006–2010, 8.3% of womenexpected to have no children in theirlifetimes, similar to the 8.9% in 2002(Table 6). Women aged 22–44 with less than ahigh school diploma were less likelyto expect no children than womenwith higher levels of education. Forexample, 5% of women with lessthan a high school education expectedno children compared with 10% ofcollege graduates. Patterns are similar by poverty status.About 5% of low income womenexpected to remain childlesscompared with 12% of higher incomewomen. Overall, fewer Hispanic (4.3%) andblack women (7.2%) expected toremain childless than did whitewomen (9.8%). A higher percentageof U.S.-born Hispanic womenexpected to remain childless (5.6%)than foreign-born Hispanic women(3.0%). The most commonly reported numberof children expected among womenin 2006–2010 was two children(41%). That is, about two out ofevery five women aged 15–44 in theUnited States expected to have a totalof two children. About one out ofevery four women expected to have atotal of three children. Hispanic women were more likely(31%) than white (23%), black(25%), or Asian (21%) women toexpect three births. Foreign-bornHispanic women were more likely(34%) than U.S.-born Hispanicwomen (27%) to expect three births. Women who did not graduate fromhigh school were more likely toexpect four or more births. While31% of women who did not graduatefrom high school expected four ormore births, only 9.2% of those witha college degree or higher expectedfour or more births.Age at first birthAge at first birth for men andwomen aged 15–44 has been fairlystable since 2002 (Table 7). In 2006–2010 the mean age at first birth was 23for women and 25 for men, similar tothe mean age at first birth in 2002. More than one-half of first birthsoccur to women in their twenties andnearly one-third occur to womenyounger than age 20. For men, abouttwo-thirds of first births occur tothose in their twenties, and one out offive first births occur to those aged30 years and over. The percentage of women who in2006–2010 reported their first birthoccurred at age 30 or over is similarto 2002. Currently married womenhad higher percentages (19%) whosefirst birth was at age 30 or over thanwomen who were not currentlymarried (3.6%–7.6%). Collegeeducated women were also morelikely to have a first birth at age 30or over (36%) than women withlower levels of education (3.5%–10.7%). For both men and women aged 22–44years, the higher the level ofeducation, the lower the percentagewho had a first birth before age 20.For example, 58% of women whohad less than a high school educationhad a first birth before age 20compared with 4% of women with abachelor’s degree or higher(Figure 3). The mean age at first birth washigher for white women (24.1) thanfor Hispanic and black women (21.2and 20.9, respectively). Within eachHispanic origin and race group,married men and women had a highermean age at first birth than unmarriedmen and women.The text table shows the number ofchildren born to women aged 15–44years by their age at first birth for 1995and 2006–2010. Given trends over thelast decades toward later childbearing,particularly among women with highereducation, parity of older first-timemothers would ideally be examinedwithin education and income groups.However, first births beyond age 35years were too rare to break down byeducation and income, particularly for1995. Among all women whose firstbirth occurred at aged 35–44 years,there was a significant increase in thepercentage that had at least twochildren, from 26% in 1995 to nearly40% in 2006–2010. Given the age rangeof the NSFG (aged 15–44 years), the‘‘children ever born’’ measure istruncated for women who may notcomplete their fertility until beyond age44 years. According to vital statisticsdata, about 7,500 women gave birth atage 45 years and over in 2008comprising 0.2% of all births (1).Another way to look at childbearingby age uses life table methodology to
National Health Statistics Reports n Number 51 n April 12, 2012100487Page 7compared with 11% of those with thelowest income.Although most men and women hada birth by age 40 (76% of men and 85%of women), there are differences bypoverty level and Hispanic origin andrace in the percentage with a birth byage h intervals58203520240Less thanhigh schoolHigh schoolSome college20–24under 204Bachelor
mean age at first child’s birth for men was 25. One-half of first births to women were in their 20s and two-thirds of first births were fathered by men who fertility,were in their 20s. On average, women aged 15–44 have 1.3 children as of the time of the interview. By age 40, 85% of women had had a bir