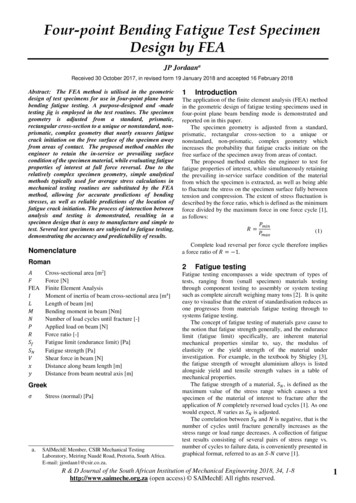
Transcription
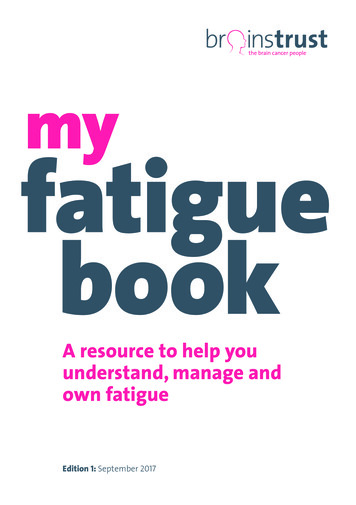
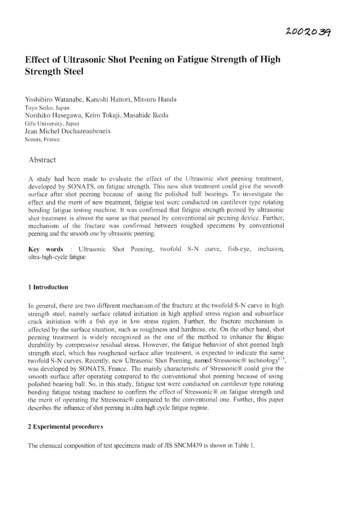
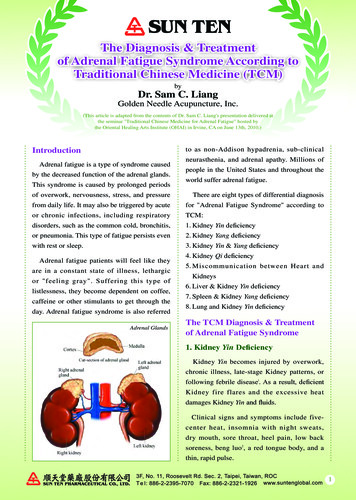
Name ///sr-nova/Dclabs wip/Metallurgy/5224 243-264.pdf/Chap 14/2/6/2008 9:57AM Plate # 0 2008 ASM International. All Rights Reserved.Elements of Metallurgy and Engineering Alloys (#05224G)pg 243www.asminternational.orgCHAPTER 14FatigueFATIGUE FAILURES OCCUR due to theapplication of fluctuating stresses that are muchlower than the stress required to cause failureduring a single application of stress. It has beenestimated that fatigue contributes to approximately 90% of all mechanical service failures.Fatigue is a problem that can affect any part orcomponent that moves. Automobiles on roads,aircraft wings and fuselages, ships at sea, nuclear reactors, jet engines, and land-based turbines are all subject to fatigue failures. Fatiguewas initially recognized as a problem in the early1800s when investigators in Europe observedthat bridge and railroad components werecracking when subjected to repeated loading. Asthe century progressed and the use of metalsexpanded with the increasing use of machines,more and more failures of components subjectedto repeated loads were recorded. Today, structural fatigue has assumed an even greaterimportance as a result of the ever-increasing useof high-strength materials and the desire forhigher performance from these materials.of the data in the literature is for fully reversedbending with no mean stress applied on top of it.Another common stress cycle is the repeatedstress cycle, in which there is a mean stress (sm)applied on top of the maximum and minimum14.1 Stress CyclesThere are three basic factors necessary tocause fatigue: (1) a maximum tensile stress ofsufficiently high value, (2) a large enough variation or fluctuation in the applied stress, and (3)a sufficiently large number of cycles of theapplied stress. There are many types of fluctuating stresses. Several of the more commontypes encountered are shown in Fig. 14.1. Afully reversed stress cycle, shown in the topgraph of Fig. 14.1, where the maximum andminimum stresses are equal, is commonly usedin testing. This is the type of stress produced, forexample, by the R.R. Moore rotating-beamfatigue machine shown in Fig. 14.2, which issimilar to what a shaft may encounter duringservice. Since this was the original type ofmachine used to generate fatigue data, quite a bitFig. 14.1Typical loading cycles
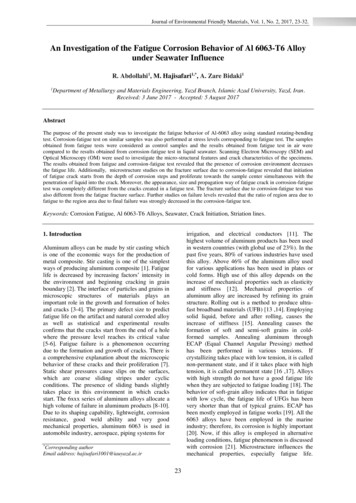
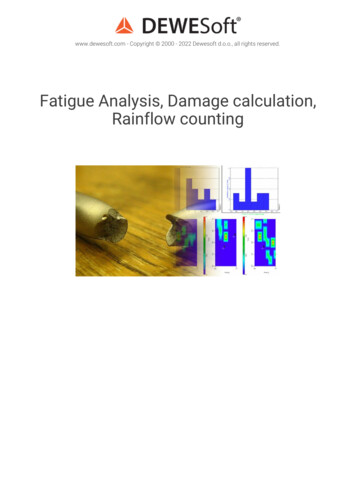
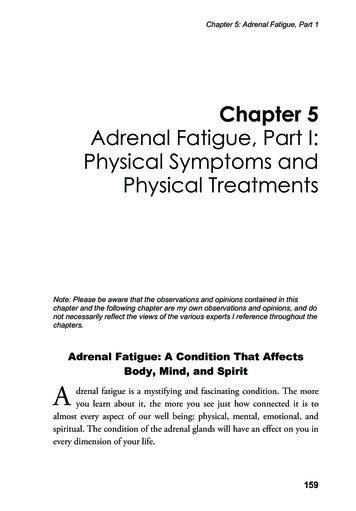
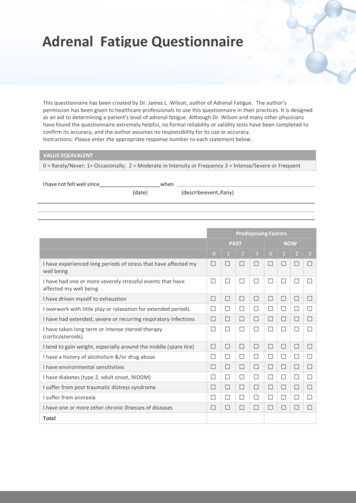
Name ///sr-nova/Dclabs wip/Metallurgy/5224 243-264.pdf/Chap 14/2/6/2008 9:57AM Plate # 0 2008 ASM International. All Rights Reserved.Elements of Metallurgy and Engineering Alloys (#05224G)pg 244www.asminternational.org244 / Elements of Metallurgy and Engineering Alloysstresses. The middle graph in Fig. 14.1 shows thecondition where both stresses (cyclic and applied) are tensile (greater than zero), but it is alsopossible to test with both stresses in compression. In addition, the maximum and minimumstresses in the cycle do not necessarily have to beequal in value. The last type of loading cycle isthe random or irregular stress cycle, in which thepart is subjected to random loads during service,as shown in the bottom graph of Fig. 14.1.Although a majority of the fatigue data in theliterature is for fully reversed bending, there arealso axial test machines (Fig. 14.3) that arecapable of tension and compression loading inboth the high- and low-cycle fatigue ranges.These modern test frames are closed-loopservohydraulically controlled and can be programmed with almost any desired fatigue spectrum.A fluctuating stress is made up of two components: a mean or steady stress, sm, and analternating or variable stress, sa. The stressrange, sr, is the difference between the maximum and minimum stress in a cycle:sr smax 7smin(Eq 14.1)The alternating stress is one-half the stressrange:sa sr smax 7smin 22(Eq 14.2)The mean stress is the algebraic average of themaximum and minimum stress in the cycle:sm smax smin2Fig. 14.2(Eq 14.3)Two ratios frequently used in presentingfatigue data are:Stress ratioAmplitude ratioR sminsmaxA (Eq 14.4)sa17R sm 1 R(Eq 14.5)14.2 High-Cycle FatigueHigh-cycle fatigue involves a large number ofcycles (N4105 cycles) and an elasticallyapplied stress. High-cycle fatigue tests areusually carried out for 107 cycles and sometimes5 · 108 cycles for nonferrous metals. Althoughthe applied stress is low enough to be elastic,plastic deformation can take place at the cracktip. High-cycle fatigue data are usually presented as a plot of stress, S, versus the number ofcycles to failure, N. A log scale is used for thenumber of cycles. The value of stress, S, can bethe maximum stress, smax, the minimum stress,smin, or the stress amplitude, sa. The S-N relationship is usually determined for a specifiedvalue of the mean stress, sm, or one of the tworatios, R or A.The fatigue life is the number of cycles tofailure at a specified stress level, while the fatigue strength (also referred to as the endurancelimit) is the stress below which failure does notoccur. As the applied stress level is decreased,the number of cycles to failure increases.Normally, the fatigue strength increases as thestatic tensile strength increases. For example,Schematic of R.R. Moore reversed-bending fatigue machine. Source: Ref 1
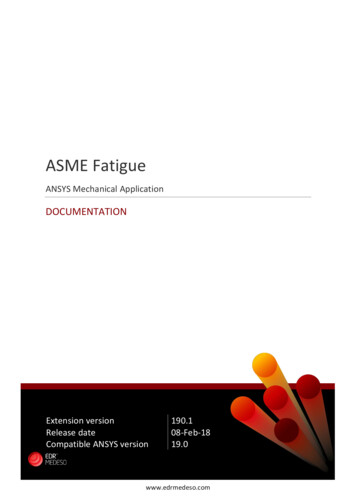
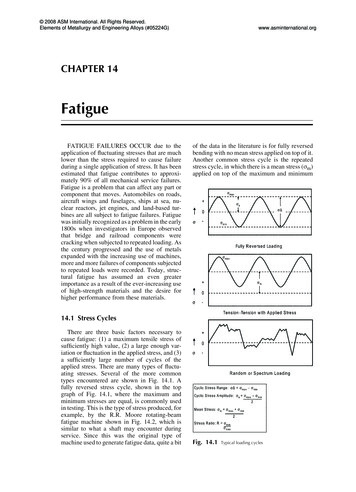
Name ///sr-nova/Dclabs wip/Metallurgy/5224 243-264.pdf/Chap 14/ 2008 ASM International. All Rights Reserved.Elements of Metallurgy and Engineering Alloys (#05224G)2/6/2008 9:57AM Plate # 0pg 245www.asminternational.orgChapter 14: Fatigue / 245high-strength steels heat treated to over1400 MPa (200 ksi) yield strengths have muchhigher fatigue strengths than aluminum alloyswith 480 MPa (70 ksi) yield strengths. A comparison of the S-N curves for steel and aluminumis shown in Fig. 14.4. Note that steel not only hasa higher fatigue strength than aluminum, but italso has an endurance limit. Below a certainstress level, the steel alloy will never fail dueto cyclic loading alone. On the other hand,aluminum does not have a true endurance limit.It will always fail if tested to a sufficient numberof cycles. Therefore, the fatigue strength ofaluminum is usually reported as the stress level itcan survive at a large total number of cycles,usually 5 · 108 cycles. It should be noted thatthere is a considerable amount of scatter infatigue test results. It is therefore important totest a sufficient number of specimens to obtainstatistically meaningful results.For a large number of steels, there is a directcorrelation between tensile strength and fatiguestrength; higher-tensile-strength steels havehigher endurance limits. The endurance limit isnormally in the range of 0.35 to 0.60 of thetensile strength. This relationship holds upto a hardness of approximately 40 HRC( 1200 MPa, or 180 ksi tensile strength), andthen the scatter becomes too great to be reliable(Fig. 14.5). This does not necessarily mean it iswise to use as high a strength steel as possibleto maximize fatigue life because, as the tensilestrength increases, the fracture toughness decreases and the environmental sensitivityincreases. The endurance limit of high-strengthsteels is extremely sensitive to surfacecondition, residual-stress state, and the presenceof inclusions that act as stress concentrations.Fatigue cracking can occur quite early in theservice life of the component by the formation ofa small crack, generally at some point on theexternal surface. The crack then propagatesslowly through the material in a directionroughly perpendicular to the main tensile axis(Fig. 14.6). Ultimately, the cross-sectional areaof the member is reduced to the point that it canno longer carry the load, and the member fails intension. The fracture surface of a fatigued highstrength part is shown in Fig. 14.7. The portionof the fracture surface due to fatigue crackgrowth and the portion finally cracked due tooverload are clearly evident.As previously mentioned, much of the fatiguedata in the literature has been determined forcompletely reversed bending with sm 0. However, the effects of mean stress are important,Alignment fixtureLoad cellHeating coilAssemblyTop gripHeat shieldSpecimenExtensometerBottom gripFig. 14.3Modern fatigue test frame
Name ///sr-nova/Dclabs wip/Metallurgy/5224 243-264.pdf/Chap 14/2/6/2008 9:57AM Plate # 0 2008 ASM International. All Rights Reserved.Elements of Metallurgy and Engineering Alloys (#05224G)pg 246www.asminternational.org246 / Elements of Metallurgy and Engineering Alloysand an increase in mean stress will always causea reduction in the fatigue life (Fig. 14.8). Anumber of mathematical models have beendeveloped that allow the effects of mean stresson stress amplitude to be predicted from fullyreversed-bending data. Goodman developed alinear model, while Gerber used a parabolicmodel (Fig. 14.9). Test data for ductile metalsEnduranceLimit1045 Steel60400300No EnduranceLimit200402024-T6 Al205001000103104105106107108Stress Amplitude (MPa)Stress Amplitude (ksi)800109 1010Number of CyclesFig. 14.4Comparison of steel and aluminum fatigue behavior. Source: Ref 2usually fall closer to the Gerber parabolic curve;however, because of the scatter in fatigue dataand the fact that notched data fall closer to theGoodman line, the more conservative Goodmanrelationship is often used in practice. If thecomponent design is based on yield rather thanultimate strength, as most are, then the evenmore conservative Soderberg relationship canbe used. Mathematically, the three relationshipscan be expressed by: x smsa se 17su(Eq 14.6)where x 1 for the Goodman line, x 2 for theGerber curve, su sy for the Soderberg curve,and se is the fatigue limit for completelyreversed bending.14.3 Low-Cycle FatigueDuring cyclic loading within the elasticregime, stress and strain are directly relatedthrough the elastic modulus. However, for cyclic140130900All test results fromone laboratoryAll specimens 0 to 2micro-in. finish1201107001009060080Quenched and tempered 8640405343409262705006020Fig. 14.5253035504045Rockwell C hardnessEndurance limit versus hardness for steels. Source: Ref 355606570400Fatigue limit, (MPa)Fatigue limit, (ksi)800
Name ///sr-nova/Dclabs wip/Metallurgy/5224 243-264.pdf/Chap 14/2/6/2008 9:57AM Plate # 0 2008 ASM International. All Rights Reserved.Elements of Metallurgy and Engineering Alloys (#05224G)pg 247www.asminternational.orgChapter 14: Fatigue / 247loading that produces plastic strains, the responses are more complex and form a hysteresisloop (Fig. 14.10). From point O up to point A,the component is in tension. On unloading,the strain response of the specimen followsthe curve from A to D. At D, the componentis under no stress. As the component is subjectedto compressive stress, the strain responsefollows the curve from D to B. Releasing thecompressive stress from B and reapplyingtensile stress, the component stress-strain condition returns to point A along the curve defined by B, C, and A. Points A and B represent thecyclic stress and strain limits. The total strain,NucleationDe, consists of both elastic and plastic components:De Dee Depwhere Dee is the elastic strain and Dee Ds/E,and Dep is the plastic strain and Dep is the widthof the loop at its center, that is, the distance CDin Fig. 14.10. The area of the hysteresis loop isequal to the work done or the energy loss percycle.In cyclic strain-controlled fatigue, the strainamplitude is held constant during cycling.Since plastic deformation is not completelyCrack GrowthFig. 14.6Typical propagation of a fatigue crack. Source: Ref 4Fig. 14.7Fatigue crack growth in a high-strength steel part(Eq 14.7)Final Failure
Name ///sr-nova/Dclabs wip/Metallurgy/5224 243-264.pdf/Chap 14/2/6/2008 9:57AM Plate # 0 2008 ASM International. All Rights Reserved.Elements of Metallurgy and Engineering Alloys (#05224G)pg 248www.asminternational.orgreversible, the stress-strain response duringcycling can change, largely depending on theinitial condition of the metal. The metalcan either undergo cyclic strain hardening,cyclic strain softening, or remain stable. Cyclicstrain hardening and softening are illustratedschematically in Fig. 14.11. In both cases, thehysteresis loops change with successivecycles. Cyclic hardening leads to increasingpeak strain with increasing cycles, while cyclicsoftening results in decreasing strain levelswith increasing cycles. In general, strong metalstend to cyclically soften, and low-strengthmetals tend to cyclically harden. However,the hysteresis loop tends to stabilize after afew hundred cycles, when the materialattains a stable condition for the imposed strainlevel.σm 0 MPa (0 ksi)Increasing Mean StressStress Amplitude (σa)248 / Elements of Metallurgy and Engineering Alloysσm 240 MPa (35 ksi)σm 480 (70 ksi)Cycles to Failure (Nf )Fig. 14.8Effect of mean stress on fatigue lifeσσσσ(σm)σσσσFig. 14.9σComparison of Goodman, Gerber, and Soderberg models for relating mean stress to stress amplitude
Name ///sr-nova/Dclabs wip/Metallurgy/5224 243-264.pdf/Chap 14/2/6/2008 9:57AM Plate # 0 2008 ASM International. All Rights Reserved.Elements of Metallurgy and Engineering Alloys (#05224G)pg 249www.asminternational.orgChapter 14: Fatigue / 249Typically, metals harden if su sy 1:4 andsoften if su sy 1:2.The reason for hardening or softening isrelated to the dislocation microstructure of themetal. When the metal is highly work hardenedand the dislocation density is high, cyclic strainallows the rearrangement of dislocations intomore stable networks, thereby reducing thestress at which plastic deformation occurs.Conversely, when the initial dislocation densityis low, the cyclic strain increases the dislocationdensity, increasing the amount of elastic strainand stress on the material.Low-cycle fatigue test data are often presented as a plot of the plastic strain range, Dep,versus cycles to failure, N. When plotted on loglog coordinates, a straight line is obtained that isdescribed by the Coffin-Manson relation:Dep e0f (2N)c2(Eq 14.8)where Dep 2 is the plastic strain amplitude, ande0f is the fatigue ductility coefficient defined bythe strain intercept at 2N 1. For many metals,e0f is approximately equal to the true fracturestrain, ef. 2N is the number of strain reversals tofailure, where one cycle is two reversals, and c isthe fatigue ductility exponent, which usuallyvaries between 0.5 and 0.7. A smaller valueof c results in longer fatigue lives.The Basquin equation, which describes thehigh-cycle, low-strain regime where the nominalstrains are elastic, is:sa DeeE s0f (2N)b2(Eq 14.9)where sa is the alternating stress amplitude,Dee 2 is the elastic strain amplitude, E is themodulus of elasticity, and s0f is the fatiguestrength coefficient, defined as the stress intercept at 2N 1. s0f is approximately equal to thetrue fracture stress, sf . 2N is the number of loadreversals to failure, and b is the fatigue strengthexponent, which varies for most metals between 0.05 and 0.12. A smaller b results in a longerfatigue life.Combining Basquin’s equation and theCoffin-Manson equation gives an equationStressAσa σ/2 σ/2EOCDStrain σ/2EB εe σ/E εp εFig. 14.10Stress-strain hysteresis loop for cyclic loading σ
Name ///sr-nova/Dclabs wip/Metallurgy/5224 243-264.pdf/Chap 14/2/6/2008 9:57AM Plate # 0 2008 ASM International. All Rights Reserved.Elements of Metallurgy and Engineering Alloys (#05224G)pg 250www.asminternational.org250 / Elements of Metallurgy and Engineering Alloysthat can be used to estimate the entire range offatigue lives:De s0f (2N)b e0f (2N)cE2De Dee Dep 222The fatigue strain-life curve tends toward theplastic curve at large strain amplitudes andFig. 14.11(Eq 14.10)Cyclic hardening and cyclic softening(Eq 14.11)
Name ///sr-nova/Dclabs wip/Metallurgy/5224 243-264.pdf/Chap 14/2/6/2008 9:57AM Plate # 0 2008 ASM International. All Rights Reserved.Elements of Metallurgy and Engineering Alloys (#05224G)pg 251www.asminternational.orgChapter 14: Fatigue / 251toward the elastic curve at small strain amplitudes (Fig. 14.12). For high-cycle strainconditions, ductile metals have the longest lives,while at low-cycle strain conditions, strongmetals have the longest lives.14.4 Cumulative DamageFatigue tests are often conducted under simple conditions, such as constant amplitude andconstant frequency. However, in real structures,the loading conditions are rarely simple. Manystructures are subjected to a range of fluctuatingloads, mean stress levels, and variable frequencies. Thus, it is important to be able topredict the life of a component subjected tovariable amplitude loading using data generatedin constant amplitude laboratory tests. Cumulative damage theories consider the fatigue process to be one of damage accumulation until thelife of the component is exhausted. Consider thefatigue life diagram in Fig. 14.13. At a constantstress, s1, the life is 200 cycles, while at s2, thelife is 400 cycles. According to cumulativedamage theory, fatigue life is gradually exhausted. That is, at points A and C, 100% of the lifeis available, while at points B and D, the respective lives are completely exhausted. If fatigue damage accumulates in a linear manner,each cycle contributes the same amount ofdamage at a given stress level. For example, ats1, on cycling the metal from A to E, one-fourthof the fatigue life is consumed (50 of 200cycles). If the stress level is reduced to s2, thepercentage of life exhausted at s2 is equivalentto the percentage of life exhausted at s1. That is,if one-fourth of the fatigue life is consumed ats1, the component still will have lost one-fourthFig. 14.12of its life even if the stress is reduced to s2.For example, at point E, 50 cycles of 200 areconsumed. If, when the component reaches thenumber of cycles defined by point E, the stress isreduced to s2, the component will be in thecondition defined by point F, with 100 of its 400cycles consumed. The same kind of change canbe described for a low-to-high stress traverse.Cumulative damage during fatigue is oftendetermined using the Palmgren-Miner rule,which assumes that the total life of a part can beestimated by adding up the percentage of lifeconsumed by each stress level:j kXnjn1n2n k 1 or 1N1 N2NkNj 1 j(Eq 14.12)where n1, n2 nk represent the number ofcycles at a specific stress level, and N1,N2 Nk represent the fatigue life incycles at the same stress level.This rule should be used with caution. It is alinear relationship that does not consider theeffects of understressing or overstressing.Understressing, in which relatively low stresslevels are initially applied, can result in longerfatigue lives at a higher stress level, due tolocalized strain hardening. On the other hand,overstressing, in which high stresses are initiallyapplied, can result in shorter fatigue lives at alow stress level, due to damage induced by thehigher stress levels.Fig. 14.13Fatigue life in terms of total strainCumulative damage during high-to-low loadingsequence. Source: Ref 5
Name ///sr-nova/Dclabs wip/Metallurgy/5224 243-264.pdf/Chap 14/2/6/2008 9:57AM Plate # 0 2008 ASM International. All Rights Reserved.Elements of Metallurgy and Engineering Alloys (#05224G)pg 252www.asminternational.org252 / Elements of Metallurgy and Engineering Alloys14.5 Fatigue Crack Nucleationand GrowthFatigue cracks almost always initiate at freesurfaces, usually external surfaces but alsointernal surfaces if the metal contains defectssuch as voids and cracked second-phase particles. Common external surface defects includegeometric notches and surface roughness.Fatigue crack nucleation and growth occursin the following stages.Stage I. Crack initiation usually starts ata notch or other surface discontinuity. Even inthe absence of a surface defect, crack initiationwill eventually occur due to the formation ofpersistent slip bands (PSBs), so called becausetraces of the bands persist even when the surfacedamage is polished away. Slip bands are a resultof the systematic buildup of fine slip movementson the order of only 1 nm. However, the plasticstrain within the PSB can be as much as 100times greater than that in the surroundingmaterial. The back-and-forth movement of theslip bands leads to the formation of intrusionsand extrusions at the surface, eventually leadingto the formation of a crack (Fig. 14.14). Theinitial crack propagates parallel to the slip bands.The crack propagation rate during stage I is verylow, on the order of 1 nm per cycle, and producesa practically featureless fracture surface. Thecrack initially follows the slip bands atapproximately 45 to the principal stress direction. When the crack length becomes sufficientfor the stress field at the tip to become dominant,the overall crack plane changes and becomesperpendicular to the principal stress, and thecrack enters stage II.Stage II crack growth occurs when the stage Icrack changes direction and propagates in aFig. 14.14direction normal to the applied stress. Crackgrowth proceeds by a continual process of cracksharpening followed by blunting, as shown inthe Fig. 14.15 illustration. Crack propagationduring crack growth often produces a pattern offatigue striations (Fig. 14.16), with each striationrepresenting one cycle of fatigue. Althoughstriations are indicative of fatigue, fatigue failures can occur without the formation of striations. Striations are microstructural details thatare best examined with a scanning electronmicroscope and are not visible to the naked eye.Frequently, visible examination of a fatiguedsurface will reveal a series of concentric markings on the surface, referred to as beach marks(Fig. 14.6). These are present as a result of stresschanges during fatigue, for example, the startingand stopping of a rotating shaft. Each of thebeach marks can contain thousands or even tensof thousands of fatigue cycles.Stage III. Ultimate failure occurs when thefatigue crack becomes long enough that theremaining cross section can no longer supportthe applied load.14.6 Fatigue Crack PropagationLinear elastic fracture mechanics assumesthat all structures contain flaws. Cracks growfrom an initial size, ao, to a critical size, ac, corresponding to failure as a function of the numberof load cycles (Fig. 14.17). The crack growthrate, da/dn, can be determined from the slope ofthe curve. Initially, the crack growth rate is slowbut increases with increasing crack length. Ofcourse, the crack growth rate is also higher forhigher applied stresses. If one can characterizethe crack growth, it is then possible to estimateDevelopment of extrusions and intrusions during fatigue. Source: Ref 4
Name ///sr-nova/Dclabs wip/Metallurgy/5224 243-264.pdf/Chap 14/2/6/2008 9:57AM Plate # 0 2008 ASM International. All Rights Reserved.Elements of Metallurgy and Engineering Alloys (#05224G)pg 253www.asminternational.orgChapter 14: Fatigue / 253Striation1Fig. 14.1542536Fatigue crack propagation. Source: Ref 6inspection intervals. An idealized da/dn versusDK curve is shown in Fig. 14.18. In region I,DKth is the fatigue crack growth threshold,which is at the lower end of the DK range, wherecrack growth rates approach zero. In region II,the crack growth rate is stable and essentiallylinear and can be modeled by power law equations, such as the Paris equation:Striation2 µmFig. 14.16SEM image showing fatigue striationsthe service life or inspection intervals requiredunder specific loading conditions and serviceenvironment. In the fracture mechanics approach to fatigue crack growth, the crack growthrate, or the amount of crack extension per loading cycle, is correlated with the stress-intensityparameter, K. This approach makes it possible toestimate the useful safe lifetime and to establishda dn C(DK)m(Eq 14.13)where: a is the flaw or crack size in inches; n isthe number of cycles; C and m are constantparameters and are related to material variables,environment, temperature, and fatigue stressconditions; and DK DKmax DKmin is thestress-intensity parameter range. The constantsC and m are material parameters that must bedetermined experimentally. Typically, m is inthe range of 2 to 4 for metals and 4 to 100 forceramics and polymers.During stage II growth in the linear crackgrowth region, the Paris law can be used todetermine the number of cycles to failure. DKcan be expressed in terms of Ds:DK DKmax 7DKmin ffiffiffiffi· pa7Ysmin pa YDs pa(Eq 14.14)
Name ///sr-nova/Dclabs wip/Metallurgy/5224 243-264.pdf/Chap 14/2/6/2008 9:57AM Plate # 0 2008 ASM International. All Rights Reserved.Elements of Metallurgy and Engineering Alloys (#05224G)pg 254www.asminternational.org254 / Elements of Metallurgy and Engineering Alloyswhere Y depends on the specific specimen geometry. Thus, the Paris law becomes:pffiffiffiffiffiffida C(YDs pa)mdn(Eq 14.15)One of the goals of fatigue analysis is to beable to predict the fatigue life of structures. Thefatigue life, n, can be solved for by rearrangingEq 14.13:dn daC(DK)m(Eq 14.16)which may then be integrated to give:nf nðfaðcdn 0daC(DK)m(Eq 14.17)aoSubstitution of the expression for DK (Eq 14.14)gives:aðcnf aodapffiffiffiffiffiffi C(YDs pa)m Cpaðc1m 2 (Ds)maodaY m a m 2(Eq 14.18)It is assumed that Ds (or smax smin) isconstant and that Y depends on the crack lengthand therefore cannot be removed from withinthe integral. For cases where Y depends on cracklength, these integrations will generally beperformed using numerical techniques. Duringstage II crack growth, some metals are sensitiveto the load ratio, R, as shown in Fig. 14.19 for7075-T651 aluminum plate. Since the Parisequation does not account for the load ratio,there are other expressions that do account forthe sensitivity of crack growth rate to the loadratio. One of the most utilized is the one developed by Foreman and his associates:daC(DK)m dn (17R)Kc 7DK(Eq 14.19)In these expressions, it is necessary to determine the initial crack length, ao, and the finalor critical crack length, ac. Crack lengths canbe detected using a number of nondestructivetesting techniques. If no cracks are detected, itmust be assumed that a crack exists below theresolution of the detection system being used. Asubcritical crack will eventually grow to a lengthat which the metal immediately fails, that is:K max ?K c(Eq 14.20)orpffiffiffiffiffiffiffiffiYsmax paf ! Kc(Eq 14.21)Solving for ac gives:ac Kc2pY 2 s2max(Eq 14.22)Fatigue LifeacCrack Length aacdaaodnaoInspectionRetirementnfNumber of CyclesFig. 14.17Crack length as a function of cycles. Source:Ref 5Fig. 14.18Crack propagation curve for fatigue loading
Name ///sr-nova/Dclabs wip/Metallurgy/5224 243-264.pdf/Chap 14/2/6/2008 9:57AM Plate # 0 2008 ASM International. All Rights Reserved.Elements of Metallurgy and Engineering Alloys (#05224G)pg 255www.asminternational.orgChapter 14: Fatigue / 255Note that even if a component contains adetectable crack, it can remain in service,provided that it is periodically inspected. Thisphilosophy forms the basis for what is known asthe damage-tolerance design approach.Finally, in region III, the crack growth rateaccelerates, since the fracture toughness of thematerial is approached, and there is a local tensile overload failure.14.7 Crack ClosureDuring fatigue cycling, the crack growth ratecan slow due to crack closure. For example, if thestructure is subjected to a series of high-tensileoverloads that are followed by loads at lowertensile stress levels, the crack may temporarilystop propagating, leading to a decrease in thecrack growth rate, da/dn, and consequently havea longer fatigue life than would normally beexpected. Crack closure mechanisms effectivelyreduce the DK during fatigue cycling, thusretarding the crack growth. Since DK is equal toKmax Kmin and the actual DK is reduced because crack closure is hindered, DK is effectivelysmaller, and crack growth rate is then reduced.Four mechanisms that can cause crack closureare shown in Fig. 14.20. Plasticity-inducedclosure results from compressive residual stresses developing in the plastic wake. Roughnessinduced closure is due to crack meandering, inwhich the crack deviates from mode I displacements and is subject to mode II shear displacements. These displacements cause amismatch between the upper and lower crackfaces, which results in contact between the crackfaces during cycling. Oxide debris-inducedclosure results from corrosion products becoming wedged in the crack interface. Finally, fluidCenter cracked panels, L-T Direction7075-T651, 0.6 cm (0.25 in.) Thickness10–23 10–2R σmin/σmax10–33 10–3R 0.510–43 10–410–53 10–5R –0.510–6110 (12) K, ksi· in. (MPa m)Fig. 14.19Stress ratio effects on an aluminum alloy3 10–6100 (120)da/dN (cm/cycle)da/dN (in./cycle)R 0.1
Name ///sr-nova/Dclabs wip/Metallurgy/5224 243-264.pdf/Chap 14/2/6/2008 9:57AM Plate # 0 2008 ASM International. All Rights Reserved.Elements of Metallurgy and Engineering Alloys (#05224G)pg 256www.asminternational.org256 / Elements of Metallurgy and Engineering Alloyspressure can act as a wedge, preventing totalcrack closure.14.8 Geometrical Stress ConcentrationsIn most structures, fatigue cracking usuallyinitiates at a stress concentration. The stressconcentration may by inherent in the design,such as a fillet, hole, thread, or other geometricalfeature, or the stress concentration can resultfrom a manufacturing process, such as a roughsurface finish or residual tensile stresses introduced by heat treatment.The effect of geometrical stress concentrations on fatigue is often studied by testing notched specimens. When a notch is present in aspecimen under uniaxial loading, three effectsare present: (1) there is an increase or concentration of stress at the root of the notch, (2)there is a stress gradient from the notch towardthe center of the specimen, and (3) a triaxial stateof stress exists. The dramatic reduction infatigue life of normalized 4340 steel sheet containing different types of stress concentrations isshown in Fig. 14.21.The effect of notches on fatigue stre
number of cycles. The value of stress, S, can be the maximum stress, smax, the minimum stress, smin, or the stress amplitude, sa.TheS-N rela-tionship is usually determined for a specified value of the mean stress, sm, or one of the two ratios, R or A. The fatigue life is the number of cycles to failure at a specified stress level, while the fati-