Transcription
October 2019ResearchInstituteGlobal wealth report 2019Color gradient or Image placeholderThought leadership from Credit Suisse and the world's foremost experts
EditorialTen years ago, the Credit Suisse ResearchInstitute launched the first Global wealth reportproviding the most comprehensive and up-todate survey of household wealth. Since then theGlobal wealth report has become the standardreference point to monitor wealth growth acrosscountries and the extent to which wealth inequalitiesare widening or narrowing.For the past decade, global wealth creation hascentered around China and the United States.This year, the United States extended its unbroken spell of wealth gains, which began afterthe global financial crisis in 2008. The UnitedStates also accounts for 40% of dollar millionaires worldwide and for 40% of those in the top1% of global wealth distribution. Wealth in Chinastarted the century from a lower base, but grewat a much faster pace during the early years. Itwas one of the few countries to avoid the impactof the global financial crisis. China’s progresshas enabled it to replace Europe as the principalsource of global wealth growth and to replaceJapan as the country with the second-largestnumber of millionaires. More tellingly, Chinaovertook the United States this year to becomethe country with most people in the top 10% ofglobal wealth distribution.The rest of the world has not stood still. Otheremerging markets – India in particular – havemade a steady contribution, which we expectto continue over the next five years. However,overall worldwide growth was modest in the 12months up to mid-2019. Aggregate global wealthrose by USD 9.1 trillion to USD 360.6 trillion,representing a growth rate of 2.6%. Wealth peradult grew by just 1.2% to USD 70,850 per adultin mid-2019. The number of new millionaireswas also relatively modest, up 1.1 million to 46.8million. The United States added 675,000 newcomers, more than half of the global total. Japanand China each contributed more than 150,000,but Australia lost 124,000 millionaires following afall in average wealth.2To mark its tenth anniversary, this year’s reportexamines in more detail the underlying factorsfor the evolution of wealth levels and wealth distribution. The growth records of countries can bequite different depending on whether wealth ismeasured in US dollars or domestic currencies,or in nominal or inflation-adjusted units. In thelonger term, the most successful countries arethose that succeed in raising wealth as a multipleof Gross Domestic Product (GDP) by addressinginstitutional and financial-sector deficiencies.This can result in a virtuous cycle in whichhigher wealth stimulates GDP growth, which inturn raises aggregate wealth. China, India andVietnam provide examples of this virtuous cyclein action.Second, the report looks at the evolution ofwealth inequality. The bottom half of wealthholders collectively accounted for less than 1%of total global wealth in mid-2019, while therichest 10% own 82% of global wealth andthe top 1% alone own 45%. Global inequalityfell during the first part of this century when anarrowing of gaps between countries was reinforced by declining inequality within countries.While advances by emerging markets continued to narrow the gaps between countries,inequality within countries grew as economiesrecovered after the global financial crisis. As aresult, the top 1% of wealth holders increasedtheir share of world wealth. This trend appearsto have abated in 2016 and global inequality isnow likely to edge downward in the immediatefuture.Given some of this year’s intriguing findings, wehope you will find the Global wealth report 2019a valuable source of information and wish youinteresting reading.Urs RohnerChairman of the Board of DirectorsCredit Suisse Group AG
02Editorial05Global wealth 2019: The year in review17The evolution of wealth levels25The evolution of wealth distribution37Wealth outlook43Wealth of nations44454647484950515253545556575859United States – Growth amid worriesChina – Stalled growthIndia – Still growingRussia – Changing fortunesGermany – Holding patternUnited Kingdom – On the brink?Switzerland – View from the topSingapore – Renewed growthJapan – Keeping calmSouth Korea – Carrying onIndonesia – Renewed growthSouth Africa – Little movementBrazil – South American giantChile – Latin American wealth leaderCanada – Paused growthAustralia – Still resilient60About the authors61General disclaimer / important informationCover photo: GettyImages, Achim ThomaeFor more information, contact:Richard KersleyHead Global Thematic Research, Global MarketsCredit Suisse ette Hechler-Fayd’herbeChief Investment Officer International Wealth Managementand Global Head of Economics & ResearchCredit Suisse redit Suisse Research t-suisse.com/researchinstituteGlobal wealth report 20193
4
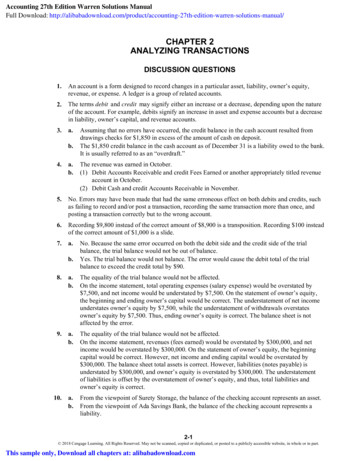
Global wealth 2019:The year in reviewAnthony Shorrocks, James Davies and Rodrigo LluberasNow in its tenth edition, the Credit Suisse Global wealth report is the mostcomprehensive and up-to-date source of information on global householdwealth. Global wealth grew during the past year, but at a very modest pace.Although wealth per adult reached a new record high of USD 70,850, this isonly 1.2% above the level of mid-2018, before allowing for inflation. Whilemore than half of all adults worldwide have a net worth below USD 10,000,nearly 1% of adults are millionaires who collectively own 44% of globalwealth. However, the trend toward increasing inequality has eased, and theshare of the top 1% of wealth holders is below the recent peak in 2016.Figure 1: Annual contribution (%) to growth of wealthper adult by component, 2000–1920151050-5-10-1501 02 03 04 05 06 07 08 09 10 11 12 13 14 15 16 17 18 19Financial wealthNon-financial wealthSource: James Davies, Rodrigo Lluberas and Anthony Shorrocks,Global wealth databook 2019DebtNet worthProspects for global wealth growthThe wealth growth spurt in 2017 evoked memories of the “golden age” for wealth during theearly years of the century, when annual growthaveraged 10%. However, it was not sustained(Figure 1). Total global wealth reached USD351.5 trillion at end-2017, but then dipped toUSD 345.4 trillion at end-2018 before recoveringto USD 360.6 trillion in mid-2019. The 2.6%increase in total global wealth since end-2017is reduced to 0.6% for global wealth per adult,which rose from USD 70,460 to USD 70,850over the same period. But this low growth ispartly attributable to US dollar appreciation: using5-year average exchange rates, total wealth hasgrown by 5.9% since end-2017, and wealth peradult by 3.8%.Based on the evidence since the financialcrisis, secular global wealth growth appears tobe closely aligned with global Gross DomesticProduct (GDP) growth. Asset price inflationand/or USD depreciation can temporarily flatterthe wealth growth figures, but cannot alter thelonger-term trends. From this perspective, thegolden age at the start of the century was probably due to a favorable combination of factors,Global wealth report 20195
Table 1: Change in household wealth 2018–19 by regionTotalwealthChange in totalwealthWealthChangeper adult in wealthper adultChange in financialassetsChange in nonfinancial assetsChange in 18-192018-192018-192018-19USD bnUSD bn%USD%USD bn%USD bn%USD ,6146255.214,5693.3371.47086.912011.5Latin America9,9064634.922,5023.21934.03405.7705.0North ,8984.0Source: James Davies, Rodrigo Lluberas and Anthony Shorrocks, Global wealth databook 2019most especially the rapid transformation of Chinafrom an emerging nation in transition to a fullyfledged market economy. There is no reason toexpect that comparable conditions will occur inthe near future. Indeed, as interest rates recover,lower house-price rises and lower equity-priceinflation will likely depress wealth growth in manycountries.An overview of the past yearMore details of wealth growth during the 12months to mid-2019 are provided in Table 1.Aggregate global wealth rose by USD 9.1trillion to USD 360.6 trillion, representing agrowth rate of 2.6%. This is an improvementon the decline experienced during 2014–15,but below the average growth recorded sincethe financial crisis in 2008. Nevertheless, itexceeded population growth, so that averagewealth grew by 1.2% to USD 70,850 per adult,an all-time high yet again.Financial assets suffered most during thefinancial crisis, and recovered better in the earlypost-crisis years. This year, their value rose inevery region, contributing 39% of the increasein gross wealth worldwide, and 71% of therise in North America. However, non-financialassets have provided the main stimulus to overallgrowth in recent years. Over the 12 months to6mid-2019, they grew faster than financial assetsin every region. Non-financial wealth accountedfor the bulk of new wealth in China, Europeand Latin America, and almost all new wealthin Africa and India. Household debt rose evenfaster, at 4.0% overall. Our estimates indicatethat household debt increased in all regions, andat a double-digit rate in China and India.Total wealth rose in all regions last year. NorthAmerica added USD 4.1 trillion to its stockof household wealth, of which USD 3.9 trillion came from the United States. China andEurope contributed another USD 3.0 trillion, andAsia-Pacific (excluding China and India) a furtherUSD 825 billion. Despite the economic troublesin Argentina and Venezuela, wealth in LatinAmerica rose by USD 463 billion, with Brazilaccounting for USD 312 billion. In percentageterms, India (5.2%) and Latin America (4.9%)grew at the fastest rate, with Africa, China andNorth America recording gains of 3%–4%.US dollar appreciation is one reason for theserelatively modest increases. Using smoothedexchange rates, total global wealth rose by USD11.8 trillion, rather than USD 9.1 trillion. Newwealth in China is assessed as USD 3.5 trillioninstead of USD 1.9 trillion, and the gain inEurope becomes USD 2.7 trillion rather thanUSD 1.1 trillion. However, smoothed exchangerates result in a net loss in other regions.
Winners and losers among countriesComparing total wealth gains and losses acrossthe most important countries, the United States(USD 3.8 trillion) again leads the way by aconsiderable margin, continuing an astonishingspell that has seen wealth per adult increaseeach year since 2008 (however, even the UnitedStates is not immune to temporary blips: wealthper adult fell by 2% during the latter half of2018, then recovered during the first half of2019). China (USD 1.9 trillion) is in second placeagain, followed by Japan (USD 930 billion), India(USD 625 billion), and Brazil (USD 312 billion).The main losses occurred in Australia (down USD443 billion), Turkey (down USD 257 billion) andPakistan (down USD 141 billion).Viewed in terms of wealth per adult, Switzerlandtops the winners (up USD 17,790) followed bythe United States (USD 11,980), Japan (USD9,180) and the Netherlands (USD 9,160): seeFigure 2. The main loser was Australia (downUSD 28,670), with other significant losses inNorway (down USD 7,520), Turkey (down USD5,230) and Belgium (down USD 4,330).Figure 2: Change in wealth per adult 2018–19,biggest gains and lossesSwitzerlandUnited StatesJapanNetherlandsNew ayNon-financial assetshave provided themain stimulus tooverall growth inrecent DFigure 3: Change in market capitalization, house pricesand USD exchange rate (%), ssiaUnited KingdomUnited States-15-10-5House prices05Market capitalization101520USD exchange rateSource Figures 2 and 3: James Davies, Rodrigo Lluberas and Anthony Shorrocks,Global wealth databook 2019Asset prices and exchange ratesMuch of the year-on-year variation in wealthlevels is due to changes in asset prices andexchange rates. Exchange-rate fluctuations arefrequently the source of the biggest gains andlosses. However, exchange rates have beenrelatively stable over the past 12 months. Amongthe countries reported in Figure 3 (G7 countries plus China, India and Russia), the largestchanges affected China and the United Kingdom– both depreciating about 3.5% versus the USdollar. Currency falls were modest elsewhere inthe world, except for Turkey (–21%), Pakistan(–24%) and Argentina (–32%). Currency appreciation was even rarer, with Thailand ( 8%) andEgypt ( 7%) recording the biggest gains.Equity prices showed greater regional fluctuations. Market capitalization rose in NorthAmerica, but declined in much of Europe by anaverage of about 10%. Markets rose significantlyin Russia ( 15%), and by an even greater extentin Kuwait ( 25%), Brazil ( 35%) and Romania( 36%). In Pakistan, market capitalizationdropped by 42%, compounding the impact ofexchange rate losses.Global wealth report 20197
House-price movements are a proxy forchanges in household non-financial assets, andhave been relatively subdued in recent years.House price declines did not happen in theten countries listed in Figure 3, and were alsorare elsewhere in the world, Australia (–6%)being the only recorded instance of a drop ofmore than 2%. India ( 6%) and China ( 9%)were among the nations experiencing a robusthousing market, joined at the top by Colombia,Portugal, Hungary and the Philippines in the10%–13% range, and Argentina, where houseprices rose 45% in domestic currency (but only11% in USD).Wealth per adult across countriesThe world wealth map (Figure 4) capturesthe huge differences in average wealth acrosscountries and regions. Nations with wealth peradult above USD 100,000 are located in NorthAmerica, Western Europe, and among thericher Asia-Pacific and Middle Eastern countries. Switzerland (USD 564,650) again topsthe ranking according to wealth per adult, butour revised estimates now place Hong KongSAR, (USD 489,260) second, followed by theUnited States (USD 432,370) and Australia(USD 386,060). New Zealand, Singapore,Canada, Denmark, the United Kingdom and theNetherlands occupy the remaining slots in thetop ten, with wealth per adult ranging from USD279,000 to 304,000. Iceland and Luxembourgprobably rank above this last group, but data forthese two countries is less reliable.The ranking by median wealth per adult favorsplaces with lower levels of wealth inequality andproduces a slightly different table. Australia (USD181,360) overtakes Hong Kong SAR (USD146,890) to gain second place, but remains belowSwitzerland (USD 227,890). New Zealand,Canada, and the United Kingdom retain similarpositions in the top ten, but lower-than-averageinequality raises Belgium (USD 117,090) to fourthplace, Japan (USD 110,410) to sixth, Ireland(USD 104,840) to eighth, and France (USD101,940) to ninth. In contrast, Singapore slips toeleventh, while the United States, Denmark andthe Netherlands all drop ten places or more.The “intermediate wealth” group in Figure 4covers countries with mean wealth in the range ofUSD 25,000–100,000. The core members areChina and Russia. But the group also includesmany recent entrants to the European Union(EU), together with important emerging-marketeconomies in Latin America and the Middle East.One step below, the “frontier wealth” range fromUSD 5,000–25,000 per adult encompassesmany heavily populated countries including India,Brazil, Indonesia, Iran, the Philippines, and Turkey.The segment also contains most of Latin America,many countries bordering the Mediterranean, andtransition nations outside the EU. The remainingFigure 4: World wealth map 2019Wealth levels (USD)Below USD 5,000USD 5,000 to 25,000USD 25,000 to 100,000Over USD 100,000No dataSource: James Davies, Rodrigo Lluberas and Anthony Shorrocks, Global wealth databook 20198
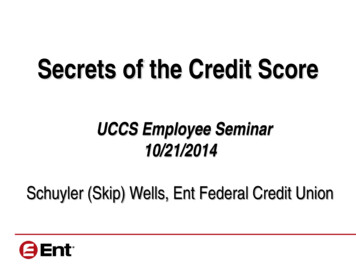
Distribution of wealth across individualsFigure 5: The global wealth pyramid 201947 m (0.9%)USD 158.3 trn(43.9%) USD 1 millionUSD 100,000to 1 millionUSD 10,000to 100,000499 m(9.8%)USD 140.2 trn(38.9%)1,661 m(32.6%)USD 55.7 trn(15.5%) USD 10,0002,883 m(56.6%)Wealth rangeUSD 6.3 trn(1.8%)Total wealth(% of world)Number of adults (percent of world adults)Source: James Davies, Rodrigo Lluberas and Anthony Shorrocks,Global wealth databook 2019members of this category include South Africaand other leading sub-Saharan nations, alongwith several fast-developing Asian countrieslike Cambodia, Laos, Thailand and Vietnam.This leaves the final group of countries withwealth below USD 5,000, which are heavilyconcentrated in central Africa and central andsouth Asia.Regional distribution of wealthThe World Wealth Map (Figure 4) illustratesthe geographical imbalance in the distributionof household wealth. North America andEurope together account for 57% of totalhousehold wealth, but contain only 17% ofthe world adult population. The two regionshad similar total wealth at one time, butNorth America now accounts for 32% ofglobal wealth compared to 25% for Europe.Elsewhere, the share of wealth is below thepopulation share. The discrepancy is modest inChina and in the Asia-Pacific region (excludingChina and India), where the population shareis 20%–30% higher than the wealth share.But the population share is more than threetimes the wealth share in Latin America, fivetimes the wealth share in India, and over tentimes the wealth share in Africa.Variation in average wealth across countriesaccounts for much of the observed inequalityin global wealth, but there is also considerabledisparity within nations. To determine how globalwealth is distributed across individual adults, wecombine our estimates of the level of householdwealth across countries with information on thepattern of wealth distribution within countries.The wealth pyramid in Figure 5 captures thewealth differences between adults. The largebase of low-wealth holders underpins highertiers occupied by progressively fewer adults. Weestimate that 2.9 billion individuals – 57% of alladults in the world – have wealth below USD10,000 in 2019. The next segment, coveringthose with wealth in the range USD 10,000–100,000, has seen the biggest rise in numbersthis century, trebling in size from 514 million in2000 to 1.7 billion in mid-2019. This reflectsthe growing prosperity of emerging economies,especially China, and the expansion of the middleclass in the developing world. The average wealthof this group is USD 33,530, a little less than halfthe level of average wealth worldwide, but considerably above the average wealth of the countriesin which most of the members reside. Total assetsamounting to USD 55.7 trillion provide this segment with considerable economic leverage.This reflects thegrowing prosperity ofemerging economies,especially ChinaThe upper-middle segment, with wealth rangingfrom USD 100,000 to USD 1 million, has alsoexpanded significantly this century, from 212million to 499 million. They currently own netassets totaling USD 140.2 trillion or 39% ofglobal wealth, which is four times their share ofthe adult population. The wealth middle classin developed nations typically belongs to thisgroup. Above them, the top tier of high net worth(HNW) individuals (i.e. USD millionaires) remainsrelatively small in size – 0.9% of all adults in2019 – but increasingly dominant in terms oftotal wealth ownership and their share of globalwealth. The aggregate wealth of HNW adultshas grown nearly four-fold from USD 39.6 trillionGlobal wealth report 20199
in 2000 to USD 158.3 trillion in 2019, and theshare of global wealth has risen from 34% to44% over the same period.Figure 6: Regional composition of global wealth distributionin 2019100%Membership of the layers of the wealth pyramidis quite distinctive in terms of residence andpersonal characteristics. The base tier has themost even distribution across regions and countries, but also the widest spread of personalcircumstances. In developed countries, about30% of adults fall within this category, and forthe majority of these individuals, membership iseither transient – due to business losses or unemployment, for example – or a life-cycle phaseassociated with youth or old age. In contrast, inmany lower-income countries, more than 80%of the adult population fall within this wealthrange, so life membership of the base tier isoften the norm.NorthAmericaLatin 20%Asia-Pacific10%0%1020304050607080Global wealth databook 2019The main feature of the two middle pyramidsegments is the dominance of China, whichaccounts for 38% of the total membership,compared to 9% from India, 7% from LatinAmerica, and just 3% from Africa. Regionalrepresentation is skewed further still amongmillionaires, where 43% of all members residein North America, 28% in Europe, and 16% inAsia-Pacific (excluding China and India). Thus,in marked contrast to the base of the wealthpyramid (which is characterized by a wide varietyof people from all countries and all stages ofthe life-cycle), HNW individuals are heavilyconcentrated in particular regions and countries,and tend to share similar lifestyles – participatingin the same global markets for luxury goods,for example, even when they reside in differentcontinents. The wealth portfolios of these individuals are also likely to be more similar, witha focus on financial assets and, in particular,equities, bonds and other securities traded ininternational markets.109599100PercentileSource: James Davies, Rodrigo Lluberas and Anthony Shorrocks,The aggregatewealth of HNWadults has grownnearly four-fold90Global wealth distributionThe regional pattern of wealth distribution canbe explored further by assigning adults to theircorresponding global wealth positions. Ourcalculations indicate, for example, that a personneeds net assets of just USD 7,087 to beamong the wealthiest half of world citizens inmid-2019. However, USD 109,430 is requiredto be a member of the top 10% of globalwealth holders, and USD 936,430 to belong tothe top 1%. Determining global wealth percentiles in this way enables the regional membership of each global decile (i.e. 10% slice) to beportrayed, as in Figure 6.Figure 6 illustrates well the features notedabove: the concentration of African and Indiancitizens in the base segment of the wealthpyramid, the dominance of China in the middletiers, and the substantial over-representation ofNorth America and Europe in the top percentile. Also evident is the significant number ofNorth American and European residents in thebottom global wealth decile, a reflection of theease with which individuals – especially youngeradults – acquire debt in advanced economies,resulting in negative net wealth. Note too,that while the bulk of Indians are located inthe bottom half of the global distribution, highwealth inequality and an immense populationmean that India also has a significant number ofcitizens in the top wealth echelons.
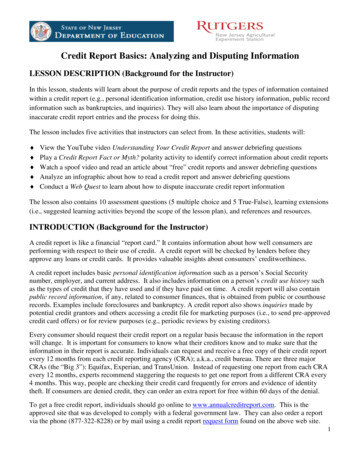
High net worth individuals by countryFigure 7: Number of dollar millionaires (% of world total)by country 2019India, 2Korea, 2Taiwan (Chinese Taipei), 1Hong Kong SAR, China, 1Switzerland, 2Netherlands, 2Spain, 2Australia, 3Canada, 3Italy, 3France, 4United States, 40Germany, 5United Kingdom, 5Japan, 6China, 10Rest of World, 11For any given country, the number of millionairesdepends on three factors: the size of the adultpopulation, average wealth and wealth inequality.The United States scores highly on all threecriteria and has by far the greatest number ofmillionaires: 18.6 million, or 40% of the worldtotal (Figure 7). For many years, Japan heldsecond place in the millionaire rankings by acomfortable margin. However, Japan is now inthird place with 6%, overtaken by China (10%).Next come the United Kingdom and Germanywith 5% each, followed by France (4%), thenItaly, Canada and Australia (3%). Spain, theNetherlands, Switzerland, India and Korea eachhost 2% of global millionaires, with Taiwan (ChineseTaipei) and Hong Kong SAR also accounting for atleast 1% of HNW citizens worldwide.Millionaire trendsOur estimates for mid-2019 show 46.8 millionmillionaires worldwide, up 1.1 million on mid2018 (Table 2). The United States added morethan half of this number – 675,000 new millionaires – to its sizable stock. This exceeded theextra newcomers in the next nine countries combined: Japan, China, Germany, the Netherlands,Brazil, India, Spain, Canada and Switzerland. Thedecline in average wealth in Australia resultedin 124,000 fewer millionaires, but losses wererelatively modest elsewhere, e.g. 27,000 in theUnited Kingdom and 24,000 in Turkey.Our estimates formid-2019 show 46.8million millionairesworldwideTable 2: Change in the number of millionaires by country, 2018–19Main gainsAdults (thousands) with wealthabove USD 1 mMain lossesAdults (thousands) with wealthabove USD 1 m20182019ChangeCountry20182019ChangeUnited ,8383,025187United 78983243Saudi Arabia163147-16Brazil21725942Hong Kong ldWorldSource Figure 7 and Table 2: James Davies, Rodrigo Lluberas and Anthony Shorrocks, Global wealth databook 2019Global wealth report 201911
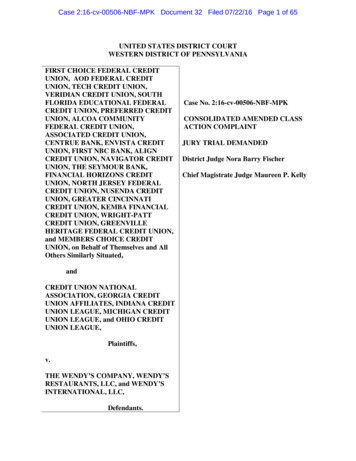
The apex of the pyramidFigure 8: The top of the pyramid, 2019The methodology we employ allows us to examine the distribution of wealth within the HNWgroup in more detail. Our calculations suggestthat the vast majority of the 46.8 million millionaires in mid-2019 have wealth between USD 1million and USD 5 million: 41.1 million or 88% ofthe HNW group (Figure 8). Another 3.7 millionadults (7.9%) are worth between USD 5 millionand 10 million, and almost exactly two millionadults now have wealth above USD 10 million.Of these, 1.8 million have assets in the USD10–50 million range, leaving 168,030 Ultra HighNet Worth (UHNW) individuals with net worthabove USD 50 million in mid-2019. USD 50 million168,0301,837,290USD 10 to 50 million3,682,140USD 5 to 10 million41,104,790USD 1 to 5 millionWealthrangeNumberof adultsUltra-high net worth individualsAmong the UHNW group in mid-2019, we estimate that 55,920 adults are worth at least USD100 million, and 4,830 have net assets above USD500 million. North America dominates the regionalbreakdown, with 84,050 members (50%), whileEurope has 33,550 (20%), and 22,660 (14%) livein Asia-Pacific countries, excluding China and India.Among individual countries, the United States leadsby a huge margin with 80,510 members, equivalent to 48% of the world total (Figure 9). Chinais a clear second with 18,130 UHNW individuals,followed by Germany (6,800), the United Kingdom(4,640), India (4,460) and France (3,700). Theremaining countries in the top ten list are Canada(3,530), Japan (3,350), Russia (3,120) and HongKong SAR (3,100).Source: James Davies, Rodrigo Lluberas and Anthony Shorrocks,Global wealth databook 2019Figure 9: Ultra-high net worth individuals in 2019, top 20 countries010,00020,00030,00040,000United StatesChinaGermanyUnited KingdomIndiaFranceCanadaJapanRussiaHong Kong SAR, ChinaKoreaItalyAustraliaBrazilTaiwan (Chinese Taipei)SpainSwitzerlandSwedenNetherlandsSaudi ArabiaUSD 50 m - 100 mUSD 100 m - 500 m USD 500 mSource: James Davies, Rodrigo Lluberas and Anthony Shorrocks, Global wealth databook 20191250,00060,00070,00080,00090,000
During the past year, the total number ofUHNW adults has risen by 6,870 (4%), withevery region except Africa recording a netincrease. The regions adding most memberswere North America (4,570), Latin America(870) and Europe (710). China (up 370) andIndia (up 54) had a relatively quiet year. The individual countries gaining the most members werethe United States (4,200) and – more surprisingly– Brazil (860) and Russia (400). Losses occurredin Korea (down 140), Turkey (down 230), Italy(down 270) and Australia (down 280).Wealth inequalityThe level and trend of wealth inequality is monitored closely as an indicator of broader socialtrends. There is no doubt that the level of wealthinequality is high, both within countries and forthe world as a whole. For example, the bottomhalf of adults account for less than 1% of totalglobal wealth in mid-2019, while the richestdecile (top 10% of adults) possesses 82% ofglobal wealth and the top percentile alone ownsnearly half (45%) of all household assets. Wealthinequality is lower within individual countries:typical values would be 35% for the share of thetop 1% and 65% for the share of the top 10%.But these levels are still much higher than thecorresponding figures for income inequality, orany other broad-based welfare indicator.The trend in wealth inequality is less clear. Ourestimates suggest that wealth inequality declinedwithin most countries during the early years of thecentury. For the world as a whole, the declineis more evident as the decline in inequalitywithin countries was reinforced by a drop in“between-country” inequality fueled by rapidrises in average wealth in emerging markets.The trend became mixed after the financial crisisas financial assets grew rapidly in response toquantitative easing and artificially low interestrates. These factors raised the share of the top1% of wealth holders, but inequality continuedto decline for those below the upper tail. Today,the share of the bottom 90% accounts for 18%of global wealth, compared to 11% in the year2000.Since 2016, non-financial assets have grownfaster t
Now in its tenth edition, the Credit Suisse Global wealth report is the most comprehensive and up-to-date source of information on global household wealth. Global wealth grew during the past year, but at a very modest pace. Although wealth per adult reached a new record high of USD 70,850, this is