Transcription
Release Notes for Cisco Aironet Site SurveyUtility 1.2ContentsThis document contains the following sections: Introduction, page 2 System Requirements, page 2 Overview, page 3 Installing the Site Survey Utility, page 4 Opening the Site Survey Utility, page 5 Selecting the Client Adapter, page 5 Using the Associated AP Status Tab, page 6 Using the AP Scan List Tab, page 10 Using the Proximity Beeper, page 20 Using Thresholds, page 22 Using AP Scanning, page 28 Viewing the Status Bar, page 34 Finding the Version of the Site Survey Utility, page 35 Accessing Online Help, page 35 Exiting the Site Survey Utility, page 36 Getting Bug Information on Cisco.com, page 36 Troubleshooting, page 36 Obtaining Documentation and Submitting a Service Request, page 36Corporate Headquarters:Cisco Systems, Inc., 170 West Tasman Drive, San Jose, CA 95134-1706 USACopyright 2005 Cisco Systems, Inc. All rights reserved.
IntroductionIntroductionCisco Aironet Site Survey Utility 1.2 is designed for use by people responsible for conducting a sitesurvey with the CB21AG client adapter. It is useful in determining the best placement of infrastructuredevices within a wireless network. The utility is a stand-alone application that runs from an executablefile.NoteCisco does not support the use of the site survey utility with 350 series client adapters. The utility mayfunction with the 350 adapters; however, it has not been tested for such use. Do not call the TechnicalAssistance Center (TAC) for assistance with this tool when using it with a 350 adapter. Note also thatoperation with a 350 adapter may be different than with a CB21AG adapter. The table below identifiesknown differences in functionality.350 Aironet ClientUtility (ACU) VersionDescription6.5 and laterNo apparent differences.6.4 to 6.0Signal Quality is always shown as “Beacons Received.”6.3 to 6.0The Display in percent check box is grayed out. Also, Signal Quality andOverall Link Quality do not appear on the Associated AP Status window.6.0RSSI values are shown as positive numbers. To work around this issue, mentallynegate the numbers. Also, information element (IE)-based information is notavailable.System RequirementsYou need the following in order to install and use Cisco Aironet Site Survey Utility 1.2: A Cisco Aironet CB21AG PC-Cardbus cardNote A computer running the Windows 2000 or XP operating systemNote As stated previously, the site survey utility may function with a 350 series client adapter;however, it has not been tested for such for use. Do not call TAC for assistance with this toolwhen using it with a 350 adapter.Cisco recommends a 300-MHz (or greater) processor.Service Pack 2 for Windows XPRelease Notes for Cisco Aironet Site Survey Utility 1.22OL-8497-01
OverviewOverviewThe site survey utility can assist you in conducting a site survey. The utility operates at the RF level andis used to determine the best placement and coverage (overlap) for your network’s infrastructure devices.During a site survey, the current status of the network is read from the client adapter, and the statusdisplay is updated four times per second so you can accurately gauge network performance. Thefeedback that you receive can help you to eliminate areas of low RF signal levels that can result in a lossof connection between the client adapter and its associated access point (or other infrastructure device).The site survey utility operates in a passive mode. That is, it does not initiate any RF network traffic; itsimply listens to the traffic that the client adapter hears and displays the results.GuidelinesKeep the following guidelines in mind when preparing to perform a site survey: Perform the site survey when the RF link is functioning with all other systems and noise sourcesoperational. Execute the site survey entirely from the mobile station.Additional InformationAlso consider the following operating and environmental conditions when performing a site survey:Note Data rates—Sensitivity and range are inversely proportional to data bit rates. Therefore, themaximum radio range is achieved at the lowest workable data rate, and a decrease in receiverthreshold sensitivity occurs as the radio data increases. Antenna type and placement—Proper antenna configuration is a critical factor in maximizingradio range. As a general rule, range increases in proportion to antenna height. Physical environment—Clear or open areas provide better radio range than closed or filled areas.Also, the less cluttered the work environment, the greater the range. Obstructions—A physical obstruction such as metal shelving or a steel pillar can hinder theperformance of wireless devices. Avoid placing these devices in a location where a metal barrier isbetween the sending and receiving antennas. Building materials—Radio penetration is greatly influenced by the building material used inconstruction. For example, drywall construction allows greater range than concrete blocks, andmetal or steel construction is a barrier to radio signals.Refer to the hardware installation guide for your infrastructure device for additional information onfactors affecting placement.Release Notes for Cisco Aironet Site Survey Utility 1.2OL-8497-013
Installing the Site Survey UtilityInstalling the Site Survey UtilityNoteFor the CB21AG, the site survey utility is included in the Install Wizard file.Follow these steps to install Cisco Aironet Site Survey Utility 1.2 on a computer running Windows 2000or XP.Step 1Use your computer’s web browser to access the following htmlStep 2Click Wireless.Step 3On the Download Software page, choose Client Adapters and Client Software Cisco AironetWireless LAN Client Adapters.Step 4Click Cisco Aironet 350 Mini-PCI Wireless LAN Client Adapter or Cisco Aironet 350 WirelessLAN Client Adapter.NoteCisco does not support the use of the site survey utility with 350 series client adapters. The utilitymay function with the 350 adapters; however, it has not been tested for such use. Do not call theTechnical Assistance Center (TAC) for assistance with this tool when using it with a 350 adapter.Step 5Click Aironet Site Survey Utility.Step 6Click Windows 2000 or Windows XP.Step 7Click 1.2.Step 8Click the executable file (*.exe) that appears on your screen.Step 9Click Download.Step 10Read the software download rules and click Agree.Step 11Save the file to your computer’s hard drive.Step 12Click Start Run.Step 13Browse to the file on your computer’s hard drive, select the file, and click Open.Step 14Click OK to open the file.Step 15When the InstallShield Wizard appears, click Next.Step 16When the Choose Destination Location window appears, click Next to install the site survey utility filesin the C:\Program Files\Cisco Systems\Aironet Site Survey Utility directory.NoteStep 17If you want to install the site survey utility in a different directory, click Browse, choose adifferent directory, click OK, and click Next.Click Next to add a program icon to the Cisco Systems program folder.NoteIf you want to specify a different program folder, choose a folder from the Existing Folders listor type a new folder name in the Program Folders field and click Next.Release Notes for Cisco Aironet Site Survey Utility 1.24OL-8497-01
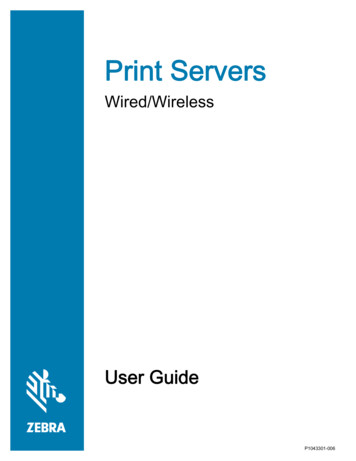
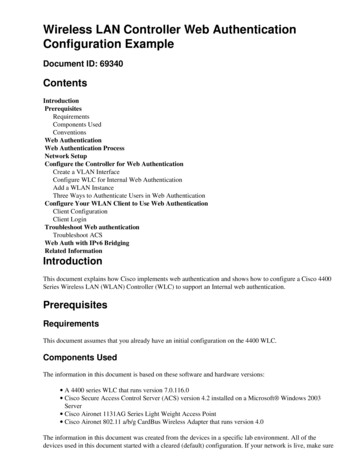
Opening the Site Survey UtilityStep 18When the Start Copying Files window appears, read the text in the Current Settings field. If theinformation is correct, click Next. Otherwise, click Back to modify your settings.The Setup Status window appears as the installation process begins.Step 19When the InstallShield Wizard Complete window appears, click Finish.Opening the Site Survey UtilityTo open the site survey utility, choose Start Programs Cisco Systems Aironet Site SurveyUtility.NoteIf you specified a different program folder during installation, you must access the site survey utilityfrom that folder.Selecting the Client AdapterWhen the site survey utility starts, it scans for client adapters. If only one adapter is detected, it isselected automatically. However, if the utility detects multiple adapters or no adapters, the SelectAdapter window appears (see Figure 1).NoteYou can manually open this window at any time to select a different client adapter. Simply choose SelectAdapter from the site survey utility’s Action drop-down menu.Figure 1Site Survey Utility - Select Adapter WindowRelease Notes for Cisco Aironet Site Survey Utility 1.2OL-8497-015
Using the Associated AP Status TabFollow these steps to select the desired client adapter.Step 1If you want to be able to choose client adapters that are installed but not physically present in yourcomputer, check the List installed devices even if not present in system check box.Step 2From the Select a Network Adapter list, select the client adapter that you want to use with the site surveyutility.NoteStep 3Click Refresh to update the list of available client adapters (for instance, after an adapter hasbeen ejected or inserted).Click OK to save your selection and exit the Select Adapter window. The top of the site survey utility’smain window (see Figure 2) shows the client adapter that is being used with the utility and its currentassociation status (Associated, Not Associated, Device Not Present, or Not a Wireless Adapter).Figure 2Site Survey Utility - Top of Main WindowUsing the Associated AP Status TabYou can perform these functions from the Associated AP Status tab: Specify display units View the access point’s statusFollow the instructions below to perform these functions.Specifying Display UnitsThe Display in percent check box at the bottom of the Associated AP Status tab enables you to specifyhow display units are shown. Unchecking this check box causes the signal strength and noise level to be shown in decibels withrespect to milliwatts (dBm) and the signal-to-noise ratio to be shown in decibels (db). This option,which is the default value, provides a more accurate representation of the data being presented thanthe percentage option. Checking this check box causes the signal strength, signal quality or beacons received, and overalllink quality to be shown as a percentage.Release Notes for Cisco Aironet Site Survey Utility 1.26OL-8497-01
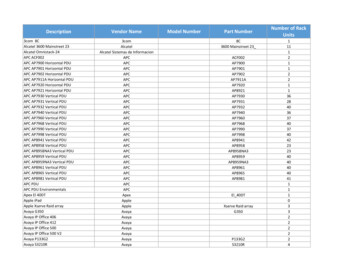
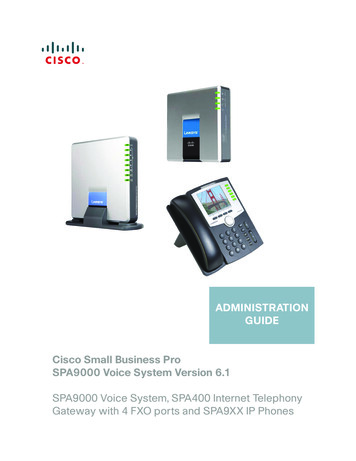
Using the Associated AP Status TabViewing the Access Point’s StatusThe Associated AP Status tab shows the status of the access point to which your client adapter isassociated. Figure 3 shows the tab with display units shown in dBm, and Figure 4 shows the tab withdisplay units shown as a percentage.Figure 3Site Survey Utility - Associated AP Status Tab (with Display Units in dBm)Figure 4Site Survey Utility - Associated AP Status Tab (with Display Units as a Percentage)Release Notes for Cisco Aironet Site Survey Utility 1.2OL-8497-017
Using the Associated AP Status TabTable 1 interprets the information that is displayed on the Associated AP Status tab.NoteThe trend graphs to the right of the smaller bar graphs provide a graphical representation of activity inthe past 10 to 60 seconds. The height of an individual trend graph is proportional to the width of itscorresponding bar graph. The time is displayed as a negative value to indicate that the data is older atthe left edge of the graph than at the right. Use the up and down arrows to select the desired number ofseconds from -10 through -60. The default value is -10.Table 1Site Survey Utility - Associated AP StatusAssociated AP Status ParameterDescriptionAccess PointThe access point to which your client adapter is associated. Thisfield may show the access point’s name, IP address, and MACaddress.ChannelNoteThis information is shown only if the access point wasconfigured with a name or IP address, Aironet Extensionsare enabled (on access points running Cisco IOS release12.2(4)JA or greater), and the access point transmits thisinformation.NoteThis field shows up to 15 characters for the access pointname although the name may be longer.NoteIf Aironet Extensions are disabled, the IP address of theassociated access point is shown as 0.0.0.0.NoteThis field displays the MAC address of the access point’sEthernet port (for access points that do not run Cisco IOSsoftware) or the MAC address of the access point’s radio(for access points that run Cisco IOS software). The MACaddress of the Ethernet port on access points that run CiscoIOS software is printed on a label on the back of the device.The channel and radio frequency (in MHz) that the access point iscurrently using for communications.Value:Signal StrengthDependent on radio band and regulatory domainThe signal strength of the most recently received packets. Thehigher the value and the wider the bar graph, the stronger thesignal.The trend graph to the right of the bar graph provides a visualinterpretation of the signal strength over time. Differences insignal strength are indicated by the following colors: green(strongest), yellow (middle of the range), and red (weakest).Range: –95 to –45 dBm or 0 to 100%NoteThe actual dBm reading could exceed the stated range.Release Notes for Cisco Aironet Site Survey Utility 1.28OL-8497-01
Using the Associated AP Status TabTable 1Site Survey Utility - Associated AP Status (continued)Associated AP Status ParameterDescriptionNoise LevelThe level of background radio frequency energy. The lower thevalue and the wider the bar graph, the less background noisepresent.The trend graph to the right of the bar graph provides a visualinterpretation of the level of background noise over time.Differences in background noise level are indicated by thefollowing colors: green (low noise), yellow (middle of the range),and red (high noise).Range: –45 to –95 dBmSignal QualityNoteThe actual reading could exceed the stated range.NoteThis parameter appears only if the Display in percentcheck box is unchecked.The signal quality of the most recently received packets. Thehigher the value and the wider the bar graph, the clearer the signal.The trend graph to the right of the bar graph provides a visualinterpretation of the signal quality over time. Differences in signalquality are indicated by the following colors: green (highestquality), yellow (average), and red (lowest quality).Range: 0 to 100%NoteBeacons ReceivedThis parameter appears only if the Display in percentcheck box is checked.The percentage of beacon packets received from the access pointversus those expected to have been sent. The higher the value andthe wider the bar graph, the clearer the signal.The trend graph to the right of the bar graph provides a visualinterpretation of the signal clarity over time. Differences in signalclarity are indicated by the following colors: green (highestquality), yellow (average), and red (lowest quality).Example: The access point sends out 10 beacons per second, soyou would expect the client adapter to receive 50beacon packets in 5 seconds. If it receives only 40packets, the percentage of beacons received would be80%.Range: 0 to 100%NoteThis parameter appears only if the Display in percentcheck box is checked and the client adapter does notprovide a signal quality value.Release Notes for Cisco Aironet Site Survey Utility 1.2OL-8497-019
Using the AP Scan List TabTable 1Site Survey Utility - Associated AP Status (continued)Associated AP Status ParameterDescriptionSignal-to-Noise RatioThe difference between the signal strength and the noise level. Thehigher the value and the wider the bar graph, the better the clientadapter’s ability to communicate with the access point.The trend graph to the right of the bar graph provides a visualinterpretation of the signal-to-noise ratio over time. Differences inthe client adapter’s ability to communicate are indicated by thefollowing colors: green (highest quality), yellow (average), andred (lowest quality).Range: Poor, Fair, Good, Excellent; 0 to 50 dBNoteOverall Link QualityThis parameter appears only if the Display in percentcheck box is unchecked.A combination of signal strength and signal quality. The higher thevalue and the wider the bar graph, the better the client adapter’sability to communicate with the access point.The trend graph to the right of the bar graph provides a visualinterpretation of the overall link quality over time. Differences inquality are indicated by the following colors: green (highestquality), yellow (average), and red (lowest quality).Value:NoteLink SpeedPoor, Fair, Good, Excellent; 0 to 100%This parameter appears only if the Display in percentcheck box is checked.The site survey utility monitors transmitted network traffic, andthe link speed reflects the current transmit rate of data packets.The trend graph provides a visual interpretation of the packettransmit rate over time. Differences in link speed are indicated bythe following colors: green (fastest), yellow (middle of the range),and red (slowest).Value:1, 2, 5.5, 6, 9, 11, 12, 18, 24, 36, 48, or 54 Mbps,depending on radio bandUsing the AP Scan List TabYou can perform these functions from the AP Scan List tab: View the AP scan list, page 11 Pause the AP scan list, page 15 View AP details, page 15 Generate an AP scan log file, page 18 View an accumulation of access points, page 20Follow the instructions on the pages indicated to perform these functions.Release Notes for Cisco Aironet Site Survey Utility 1.210OL-8497-01
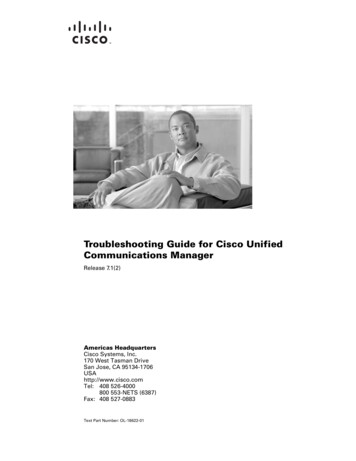
Using the AP Scan List TabViewing the AP Scan ListYour client adapter can detect nearby access points by the beacon signals that the access pointscontinually transmit. The AP scan list displays a continuously updated list of the access points detectedby your client adapter as well as the information contained in their beacons.To view the AP scan list, click the AP Scan List tab. The AP scan list appears (see Figure 5).Figure 5Site Survey Utility - AP Scan ListTo view the entire list of access points and all their information, perform one of the following:Note Click the resize tab in the lower right corner of the mainwindow and drag it until the window reaches the desired size. Use the vertical and horizontal scroll bars. Click the middle button in the top right corner of the window.Clicking Fit Columns resizes the columns on the AP scan list so that they are as wide as their widesttext. This feature enables you to view the text in each column without it being truncated. However, youcan also manually resize the columns by clicking on the edges of the column headers and dragging.Table 2 interprets the information that is displayed in the AP scan list.NoteThe AP Detailed Information window provides details for many of the parameters listed in Table 2. Seethe “Viewing AP Details” section on page 15 for additional information.Release Notes for Cisco Aironet Site Survey Utility 1.2OL-8497-0111
Using the AP Scan List TabNoteThe AP Scanning drop-down menu contains options that enable you to save and open the AP scan list.These two options are available only when the AP Scan List tab is selected. See the “Using AP Scanning”section on page 28 for more information.Table 2Site Survey Utility - AP Scan ListAP Scan List Parameter DescriptionCountThe number of rows, or access points, in the scan list.NoteNetwork NameThis parameter appears above the AP scan list and to the right.The network name, or service set identifier (SSID), indicates the name of anavailable wireless network. The icon to the left of the SSID providesinformation on link status.IconDescriptionAn available wireless network.The wireless network to which your client adapter is currentlyassociated.NoteMAC AddressThe SSID of a Cisco IOS access point appears in the list of availablenetworks only if a Guest Mode SSID is enabled or the Broadcast SSIDin Beacon option is selected. Refer to the software configurationguide for your access point for additional information.The access point’s MAC address.NoteThis field displays the MAC address of the access point’s Ethernetport (for access points that do not run Cisco IOS software) or theMAC address of the access point’s radio (for access points that runCisco IOS software). The MAC address of the Ethernet port on accesspoints that run Cisco IOS software is printed on a label on the back ofthe device.RSSIThe received signal strength indicator (RSSI) is a measure of signal strengthin decibels with respect to milliwatts (dBm).Time of DayThe date and time when the signal strength of each access point was at itsmaximum. They appear in this format: 2005-07-20 16:13:09.NoteThe time is based on a 24-hour clock.NoteThis field is visible only in Accumulate mode. See the “Viewing anAccumulation of Access Points” section on page 20 for informationon the Accumulate mode.Release Notes for Cisco Aironet Site Survey Utility 1.212OL-8497-01
Using the AP Scan List TabTable 2Site Survey Utility - AP Scan List (continued)AP Scan List Parameter DescriptionData EncryptionIndicates whether the data exchanged with this access point is encrypted.Value:TypeValueDescriptionSecureThe data exchanged with this access point is encrypted.OpenThe data exchanged with this access point is unencrypted.The IEEE 802.11 standard that describes the access point’s radio band.Value:Channel (Frequency)Secure or OpenA, B, or GThe channel and radio frequency (in MHz) that the access point is currentlyusing for communications.Value:Dependent on radio band and regulatory domainMax RateThe maximum rate at which the client adapter can transfer data with an accesspoint. The supported rates of both the client adapter and the access point areexamined, and the highest rate that they have in common is the one that isused.AP NameThe access point’s name. It is shown only if the access point was configuredwith a name, Aironet Extensions are enabled (on access points running CiscoIOS Release 12.2(4)JA or later), and the access point transmits thisinformation.NoteLoadThe access point’s channel utilization in terms of traffic and throughput.Value:NoteCCXThis field shows up to 15 characters although the name of the accesspoint may be longer.0 to 100%This parameter is shown only if the access point is using QoS BasisService Set (QBSS) or call admission control (CAC). If neither isused, this field is left blank. If both are used, the value comes from theQBSS.The version of Cisco Compatible Extensions (CCX) supported by the accesspoint. It is shown only if the access point transmits this information.Value:1, 2, 3, or 4Release Notes for Cisco Aironet Site Survey Utility 1.2OL-8497-0113
Using the AP Scan List TabTable 2Site Survey Utility - AP Scan List (continued)AP Scan List Parameter DescriptionOther InformationA list of miscellaneous values that may appear depending on the accesspoint’s current status and the information that it transmits.Values: See table below.ValueDescriptionAd-HocIndicates that the device is not an access point but anotherclient adapter operating in ad hoc mode.CACIndicates that the access point is using distributed calladmission control (CAC).CECIndicates that the access point is using Cisco extendedcapabilities (CEC).PowerIndicates that the access point can limit the transmitting powerof the client adapter. The power limit is shown in milliwatts(mW).QosIndicates that the access point is using quality of service(QoS). QoS on wireless LANs (WLAN) providesprioritization of traffic from the access point over the WLANbased on traffic s that the access point is using radio management.RM-Normal indicates normal status, RM-APScan indicatesAP radio scan, and RM-CliWlk indicates client walkabout.Any unrecognized value appears as RM-State?.SsidlIndicates that the access point is using the SSID List feature.The number of hidden SSIDs is shown as a number (forexample, Ssidl:2).WMMIndicates that the access point is using Wi-Fi Multimedia(WMM), a component of the IEEE 802.11e wireless LANstandard for quality of service (QoS).WPAIndicates that the access point is using Wi-Fi Protected Access(WPA), a standards-based security solution from the Wi-FiAlliance that provides data protection and access control forwireless LAN systems. It is compatible with the IEEE 802.11istandard but was implemented prior to the standard’sratification. WPA uses TKIP and MIC for data protection and802.1X for authenticated key management.WPA2Indicates that the access point is using Wi-Fi Protected Access2 (WPA2), the next generation of Wi-Fi security. It is theWi-Fi Alliance’s implementation of the ratified IEEE 802.11istandard. WPA2 uses AES-CCMP for data protection and802.1X for authenticated key management.Release Notes for Cisco Aironet Site Survey Utility 1.214OL-8497-01
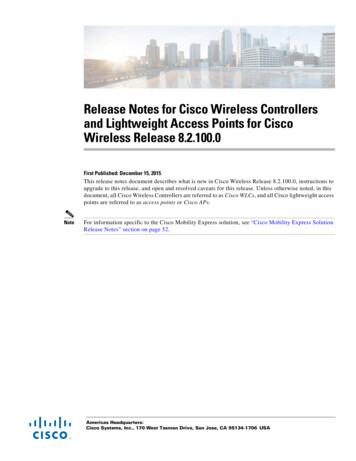
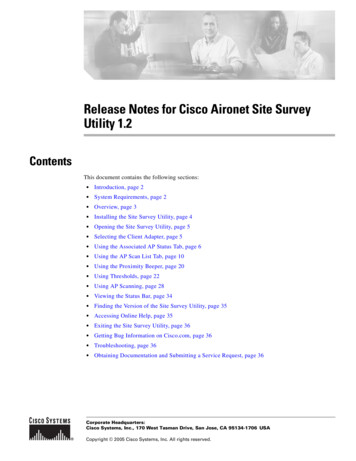
Using the AP Scan List TabPausing the AP Scan ListThe AP scan list is updated continually. To pause the current list, click Pause List Update above the APscan list.NoteAP scanning continues to occur in the background when the Pause List Update button is depressed. Forexample, the threshold based on the AP scan list count continues to function.NoteClicking this button again resumes the list update.Viewing AP DetailsTo view details for a particular access point in the AP scan list, select the desired network name in thescan list and click View AP Details. The AP Detailed Information window appears (see Figure 6).NoteYou can also open the AP Detailed Information window by double-clicking in the first column of thedesired row.Figure 6Site Survey Utility - AP Detailed Information WindowTable 3 interprets the information that is displayed in the AP Detailed Information window.NoteThe AP Detailed Information window contains text summaries of all the information elements presentin the access point’s beacon or probe response. As a result, the window may contain differentinformation than that described in Table 3.Release Notes for Cisco Aironet Site Survey Utility 1.2OL-8497-0115
Using the AP Scan List TabNoteIf you also want the AP Detailed Information window to display debugging information, including ahexadecimal debug-style dump of raw access point scan data, choose Options from the site surveyutility’s Action drop-down menu and check the Enable Expert Mode for AP Detailed Informationcheck box. The debug information appears at the bottom of the AP Detailed Information window underthe “Expert Mode (Debug Dump)” heading.Table 3Site Survey Utility - AP Detailed InformationDetailed InformationParameterDescriptionSSIDThe network name, or service set identifier (SSID), indicates the name of theaccess point’s wireless network.MAC AddressThe access point’s MAC address.NoteThis field displays the MAC address of the access point’s Ethernetport (for access points that do not run Cisco IOS software) or theMAC address of the access point’s radio (for access points that runCisco IOS software). The MAC address of the Ethernet port on accesspoints that run Cisco IOS software is printed on a label on the back ofthe device.RSSIThe received signal strength indicator (RSSI) is a measure of signal strengthin decibels with respect to milliwatts (dBm).Data EncryptionIndicates whether the data exchanged with this access point is encrypted.Value:Infrastructure ModeIndicates whether the device is an access point operating in infrastructuremode or another client adapter operating in ad hoc mode.Value:Network TypeDependent on radio band and regulatory domainThe amount of time between access point beacons in Kilomicroseconds(Kµsec).NoteATIMWindow1, 2, 5.5, 6, 9, 11, 12, 18, 24, 36, 48, or 54 MbpsThe channel and radio frequency that the access point is currently using forcommunications.Value:Beacon PeriodA, B, or GThe rates at which the access point is capable of transmitting and receivingdata packets.Value:Channel (Frequency)Infrastructure or Ad-HocThe IEEE 802.11 standard that describes the access point’s radio band.Value:Supported RatesSecure or OpenOne Kµsec equals 1,024 microseconds.Announcement traffic information message (ATIM) window. The brief timeperiod immediately following the transmission of each beacon in an ad hocnetwork. This value is expressed in Kilomicroseconds (Kµsec).NoteOne Kµsec equals 1,024 microseconds.NoteThis parameter’s value is 0 when the device is operating ininfrastructure mode.Release Notes for Cisco Aironet Site Survey Utility 1.216OL-8497-01
Using the AP Scan List TabTable 3Site Survey Utility - AP Detailed Information (continued)Detailed InformationParameterDescriptionDSConfigThe frequency of the selected channel.Range: 2,412,000 to 2,484,000 kHz (802.11b/g);5,000,000 to 6,000,000 kHz (802.11a)NameThe access point’s name. It is shown only if the access point was configuredwith a name, Aironet Extensions are enabled (on access points running CiscoIOS Release 12.2(4)JA or later), and the access point transmits thisinformation.NoteThis field shows up to 15 characters although the name of the accesspoint may be longer.Device TypeThe access point’s model number.Radio TypeThe type of radio used in the access point.HopsThe number of hops that the packets must take to get to the root. For example,if there is a repeater between your client adapter and the access point to whichit is associated, the number of hops is 1.LoadThe access point’s channel utilization in terms of traffic and throughput.NoteCWminThe minimum value used by the access point to calculate a contentionwindow (CW).NoteCWmaxThis parameter is shown only if the access point is using QoS BasisService Set (QBSS) or call admission control (CAC). If neither isused, this field is left blank. If both are used, the value comes from theQBSS.Contention occurs when two or more radios in the same area try totransmit at the same time. When this occurs, the radios wait for acertain amount of time before trying again. Because contention canoccur more than once, the radios use a series of progressively longerwait periods, or “windows,” each time they encounter contention fora given packet.The maximum value used by the access point to calculate a contentionwindow (CW).NoteContention occurs when two
Note Cisco does not support the use of the site survey utility with 350 series client adapters. The utility may function with the 350 adapters; however, it ha s not been tested for such use. Do not call the Technical Assistance Center (TAC) for assistance with this tool when using it with a 350 adapter. Step 5 Click AironetSite Survey Utility.