Transcription
Automated Testing ofTableau Dashboards
AbstractCompanies make business-critical decisions every day based on data from theirbusiness intelligence systems. It is therefore essential that Business Intelligence(BI) reports display correct data in an efficient way that is interactive and easy tounderstand for business users. BI reports are usually validated manually, but thereare other efficient ways of conducting testing which are more reliable and canreduce testing time. In this whitepaper, we explore alternatives to manual testing ofTableau dashboards and describe how software developers have been relying onautomated testing via Continuous Integration and techniques like Test-DrivenDevelopment to improve software stability and reduce maintenance costs. We willexplore how Kinesis CI supports these practices for Tableau.Why Test Dashboard Changes?Business intelligence dashboards constantly evolve as business and reportingneeds change. Such changes can potentially alter existing unrelated functionalityand cause unintended reporting errors, which is why testing dashboarddeployments is essential. In large organizations, it is not uncommon to have a highnumber of changes committed on any given day to a dashboard or a number ofdashboards. These changes can only be effectively validated with automatedtesting.We can also use automated testing to ensure that our reports display correct dataand, that our data refresh processes and manual modifications are executedcorrectly either by comparing the results with pre-set values or referencing data inthe underlying database. Performing such test tasks in an automated fashion on aContinuous Integration server can greatly reduce costs and speed up delivery.1
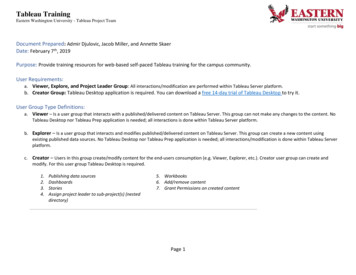
TimeBackgroundModern software development practices encourage making testing afundamental part of the project. If a software project does not have reasonabletest coverage it is considered as “legacy code”: any change to such a project is apotential risk and makes maintenance harder and more costly.There are a number of software test categories but some of the most commonlyused ones are: Unit Functional PerformanceEach software test category provides different values: in unit testing, it is possibleto write simple and quick tests and validate low-level logic, while functional testsare higher level, take longer to write but give more confidence in the overallcorrectness of the system. Performance tests can help identify slowdowns andbottlenecks introduced by changes. It is common to use a combination of severaltest types in a software project to get optimal results.Ideally, we should be able to use a similar approach and perform different kindsof tests on our Tableau dashboards to gain complete confidence in our changesbefore promoting the new version to our clients.Business Intelligence TestingDrawing parallels between BI dashboard and software testing can be helpful tounderstand important similarities, but there is a major difference with businessintelligence systems: software testing tools and frameworks are typicallydesigned for traditional programming languages and are not suitable for BIprojects. Testing Business Intelligence applications is different from testingtraditional transactional applications, as it requires a data-centric testingapproach and you need to work with third-party BI tools, resulting in limitedalternatives for applicable testing tools. In addition, the volume, variety, andcomplexity of the data make it difficult to create robust test cases, andspecialized skills are required to execute the data validation and verificationprocesses.Despite limited testing options with Tableau, we can still implement a full testsuite to validate the accuracy and performance of our dashboards.We can implement some of the following test types in our BI testing strategy: Regression to verify new changes don’t impact existing functionality.Functional to ensure that the delivered changes are in line with requirements.Cross - Environment to compare different Tableau environments (i.e. sitesor servers) to make sure changes can be safely deployed.Performance to make sure no performance regressions are introduced in ourchanges.2
Testing OptionsTesting Tableau DashboardsTesting is an integral and very important part of most areas of softwaredevelopment. However in BI, it is not yet widespread, despite the fact that BIdevelopers not only visualize data but they also make a lot of data transformations,implementing various business logic into the visualization layer, blending data frommultiple sources, etc. This simply results in a very high risk of potentially showingdata incorrectly.BI professionals who recognize the need for testing their BI projects can implementone of the following approaches, or a combination of them.1.2.3.Manual testing. Compile a list of test cases that need to be verified afterevery change. These can be maintained in a simple spreadsheet and updatedwith new test cases as dashboard development progresses. As this kind oftesting does not require any additional software products it is the simplest oneto implement. However, it is the slowest and most expensive one to maintain.Automated testing via Selenium. Since Tableau Server can be accessedwith a web browser, automation can be built with a headless browser usingSelenium WebDriver. This means we can automate manual test executions,but it does take a considerable investment to build out the initial automationframework. Adding and maintaining tests requires software development skillsdepending on how much abstraction our framework does. It is also notpossible with Selenium to test data or Tableau-specific functionalities.Automated testing with specialized Tableau testing tools, like Kinesis CI.Kinesis CI is a Tableau testing framework that uses headless browserautomation with an easy-to-use user interface to set-up and maintains testcases. Kinesis CI allows users to describe dashboard interactions and userjourneys in their test cases, and execute the tests using the UI or through thecommand-line interface. This is so that tests can be driven from continuousintegration servers like Jenkins.At present, manual testing is by far the most prevalent. BI analysts usuallyimplement and follow a manual testing process. To follow a manual testing routine,companies are reliant on QA resources, resulting in an increased headcount.Manual testing is also prone to human errors and thus not the most efficientprocess.Selenium tests are designed for web applications. However, they cannot deal withthe challenges of a data-centric testing approach, where data can be changing atfrequent intervals. Writing and maintaining test cases in Selenium is also a lengthyprocess, creating overhead and requiring skills data analysts and BI developers donot necessarily have.Specialized Tableau testing tools can efficiently deal with the challenges ofchanging data, and specific features are designed to provide interactivity for3Tableau users.
TimeTheAdvantageHow Kinesis CI can Help Your OrganizationKinesis CI is a testing tool designed for BI projects to cover testing requirements,including functional, regression, and performance testing, and to implement testdriven development for Tableau dashboards. Kinesis CI offers a versatile andflexible test framework for Tableau that can reduce the high costs of repetitivemanual testing by shortening your BI development cycle and increasing thereliability of your BI dashboards. Write tests for your Tableau reports: using Kinesis Designer, analysts canquickly put together a comprehensive test plan for their dashboards, includingfunctional, regression, cross-environment, and performance testing. Tests can beexecuted directly within the tool. Use source control for your tests: as the test cases are described in JSON fileformat, they can be easily kept in source control systems. Kinesis Designerintegrates with Git so users don’t need to leave the tool to clone or upload tests. Implement continuous integration: As reports evolve, new changes can breakexisting functionality. The Kinesis command-line interface tool can be easilyintegrated with your organization’s continuous integration server, and everydashboard change can trigger a re-run of the entire test suite against the latestdashboard version. This ensures that the changes do not cause problems beforethe dashboard is published to the live environment. Test Driven Development: find issues at the earliest possible phase whendeveloping new features. Continuous Delivery: automatically deploy changes after successful test runs toimprove productivity. Scheduled Test Runs: run the test suite on a regular basis to ensure the Tableauenvironment is always in a healthy state.Advantages of Kinesis Over In-house Test Automations:In order to be able to use the Kinesis CI tool, users do not need special skills otherthan working knowledge of Tableau. Users can quickly learn how to use KinesisDesigner and start implementing tests. In-house test automation solutions without asimplified user experience usually require training and continuous assistance fromthe software engineering group.Cost of ownership: implementing a custom automation solution for Tableau is nontrivial. Taking Selenium as an example to drive test automation, even a minimalsolution that can be used by non-technical users will likely require hundreds ofman-hours of development time and continuous maintenance to keep up withchanges introduced by new Tableau releases. In contrast, the total cost ofownership of a ready-made solution like Kinesis CI will be much less and ispractically maintenance-free.4
TimeTDDand AgileTest-Driven DevelopmentIn most areas of software development, adopting CI and other agile methodologieshave changed the way people test. Development teams are required to do moretesting, faster and more often. Testing is done earlier in the development lifecycleand the focus is on automated testing as developers try to move away from manualtesting.Test-Driven Development (TDD) as a concept is widely used in most areas ofsoftware development. Software developers using TDD start with writing testcases, based on what the software or piece of code is expected to do, then writethe code, so that the test passes. They then keep repeating these steps on aregular basis.This concept enables developers to find issues at the earliest possible phase whendeveloping new features, so they will know of any issues before merging thechanges into the existing codebase. A large number of studies prove that writingtests are crucial when developing software, and will result in a decrease inproduction issues and of course less headache with fixing bugs.In Business Intelligence, test-driven development can be implemented with KinesisCI, as this tool is designed for BI applications and is able to test dashboards withchanging data, complex calculation logic, and interactive fields. Kinesis CI is usingthe Tableau JS/REST APIs and further internal communication methods to interactwith the visualizations where web testing frameworks are not efficient. Moreover, itcomes with built-in data comparison tasks that are mandatory to validate thefigures shown on the dashboard.5
TimeTDDand AgileAgile BI DevelopmentAgile software development is an approach whereby software solutions evolvethrough continuous collaboration between teams. It is widespread in modernsoftware development as changes in requirements can be dealt with moreefficiently, and results in delivering solutions to end-users faster and moreaccurately.With Kinesis CI, users can evolve their BI projects into an agile process. Automatedtesting can be implemented at all stages of dashboard development and used byvarious teams, starting with BI developers or data analysts developing functionaltests when developing the dashboards themselves. These can be run whenever achange is committed to a dashboard to make sure existing functionality ispreserved. Regression tests can be run by QA analysts to keep track ofunexpected changes to dashboards. Finally, fully tested dashboards can bedeployed automatically to the production environment.6
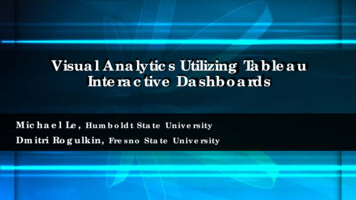
TiArchitectureSoftware ArchitectureTests are created in the User Interface, Kinesis Designer. Kinesis Designergenerates a JSON file that includes the test properties necessary for the CommandLine Interface to run the test cases.To set up test cases, i.e. creating snapshots from Tableau dashboards containingmetadata, Kinesis Designer is using a web driver.Tests are run by the Command Line Interface. Communication with Tableau isdone by using a combination of REST API, Javascript API, Tabcmd, and webinteractions.Architectural Diagram7
and mCITesting Timein KinesisTest TypesThere are four testing modules within Kinesis CI: functional, regression, crossenvironment, and performance testing. Functional Testing is designed to test different components of Tableaudashboards, such as filters, parameters, or the layout. Users can validate data bya number of criteria. Data can be tested against expected results, based on userdefined rules using flexible formulas. Equally, data displayed on Tableaudashboards can be tested directly against the content of the underlying datasource at the moment of running the test case. Users can simulate user journeysand test every step of these journeys in Kinesis CI. Functional testing is highlymodular and flexible. Regression Testing enables users to compare the actual status of a Tableaudashboard to a baseline of the same Tableau dashboard taken earlier fromTableau Server to verify unexpected changes. Any future test runs will becompared to this baseline. Cross-Environment Testing enables users to compare the same dashboard ontwo different Tableau environments at the same time. Performance Testing drives load to your Tableau server and assesses responsetimes based on SLA requirements. You can work with multiple concurrent usersand dashboards. Performance testing in Kinesis CI is based on the Apex score,which is commonly used for web applications.After every test run, a report which gives an overview of the test case and adetailed illustration for any failures is generated. This enables users to easilyidentify and fix issues before they get escalated or cause bigger problems down theline.8
TiFunctionalTestingFunctional TestingFunctional Testing in Kinesis CI is designed to simulate user journeys on Tableaudashboards. It offers options to test dashboard elements, such as filters andparameters, to simulate user clicks, and more importantly to test the underlyingdata.Functional testing is very flexible. Every functional test in Kinesis CI is made up of aseries of tasks that will be run by the Kinesis test runner one after the other. Youcan simulate user interactions and describe complete user journeys with Functionaltesting, such as setting and asserting filters and parameters, or user clicks.You can also test your underlying data based on user-defined rules against anexpected data set or query your underlying data source with an SQL command,and compare the content of your database to the data displayed on your Tableauserver in real-time. Functional testing offers you the opportunity to design andimplement a flexible and comprehensive test plan to ensure the functionality ofyour Tableau Dashboards is preserved at all times.Tasks in Functional TestingIn Kinesis CI at present, the following tasks are available within Functional Testing:1. Login to Tableau - Logs in to Tableau Server2. Open Viz - Opens a Tableau Visualization3. Publish to Tableau - Publishes a Tableau file to Tableau Server (twb, twbx, tds,tdsx)4. Refresh Extracts - Refreshes Data Extracts based on data source5. Load Data - Loads data from a CSV file into a database table6. Set Filter - Validates Tableau filters (separate List, Date, and Date range optionsavailable)7. Set Parameter - Validates Tableau parameters8. Assert Data Equals - DDownloads and compares the underlying data on aworksheet to an expected result defined by the user9. Assert Image Equals - Downloads and compares the layout in a picture formatto an expected result defined by the user10. Assert SQL Equals - Compares values from the underlying database,queried by an SQL command, to the data on the Tableau worksheet/ dashboard11. Assert Data Rules - Validates data displayed on Tableau Server to rulesdefined by the user9
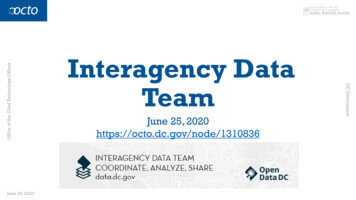
TiFunctionalTesting12. Assert Filter Equals - Verifies the existence of a filter and compares the valueof a filter to an expected result13. Assert Parameter Equals - Verifies the existence of a parameter andcompares the value of a parameter to an expected result14. Select Marks - Selects marks on your Tableau visualization to simulate clicks/user interactions15. Drive Browser - Run custom web driver commands based on individualrequirements, i.e. when using SAML SSO16. Switch Tab - Switches between worksheets within a Tableau workbook17. Run Command - Gives additional flexibility to run a command in the commandline interface.The above testing tasks can be combined in a sequence to describe test cases.Please see below an example for Functional testing.Validating underlying data with Assert SQL Equals task10
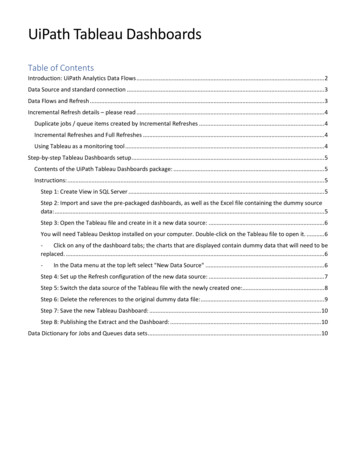
TiRegressionTestingRegression TestingIn regression testing, users can compare a Tableau dashboard to a baseline takenearlier to check for regression over time. Users take an initial baseline of thedashboard they wish to test. The baseline contains all metadata such asworksheets, data, layout, filters, and parameters available on the dashboard.Any future test runs will be compared to this baseline.When a regression test is run, Kinesis CI compares the actual content of yourTableau server to the baseline taken earlier.If the baseline and the actual dashboard are the same, the test passes. If there is adifference, the test fails. To update the Baseline, tests can be re-based. Following are-base, the baseline will be updated and any test runs will compare metadata tothe updated baseline.Flow diagram of Regression Testing11
TiRegressionTestingKinesis CI also gives flexibility for users to determine what to include in theirRegression test cases. For instance, if data is changing on a regular basis, userscan exclude data testing in regression, and focus on the structure of the workbooksand elements such as filters and parameters.Regression testing task properties12
TiCross-EnvironmentTestingCross-Environment TestingWith Cross-Environment testing, users can compare the same dashboard on twodifferent Tableau environments at the same time. These will be the Source andTarget Environments on Tableau.For instance, a dashboard on a dev server can be compared to the samedashboard already deployed on the prod server. Alternatively, when conducting aTableau Server upgrade you have the old and the new server running in parallel -this means you can automatically compare the dashboards on those servers toaccelerate pre-upgrade testing.When the test is run, Kinesis takes a snapshot of both the source and the targetenvironment and compares the two. If the two snapshots are the same, the testpasses, if they differ, the test fails.Flow diagram of Cross-Environment Testing13
TiCross-EnvironmentTestingSimilar to Regression testing, in Cross-Environment testing users can also selectwhat to include in the scope of the Cross-Environment test, i.e. worksheets, datacolumns, the actual data, the layout, as well as filter and parameter names, datatypes, and values.Cross-Environment testing task properties14
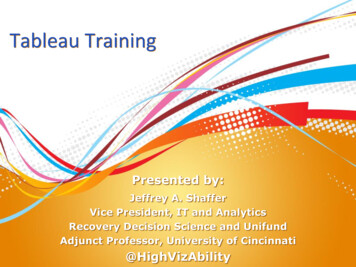
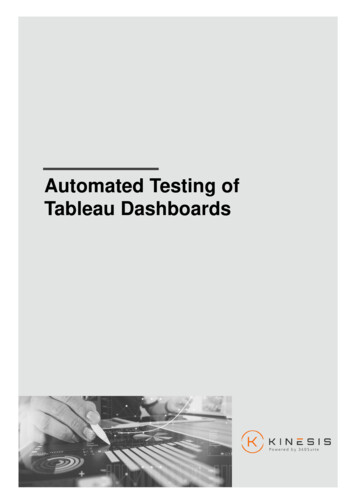
TiPerformanceTestingPerformance TestingPerformance testing in Kinesis CI drives load to your Tableau server and assessesresponse times based on SLA requirements. You can work with multiple concurrentusers and dashboards. Users can define SLA's (Service Level Agreements) withmultiple goals, such as Performance Goal, Availability Goal, or Apdex Score.Apex (Application Performance Index) score is commonly used for webapplications. Users can define a performance and an availability goal. Apdex is acombination of availability and performance metrics, where fast and error-freeresponses increase the score, and long responses and errors reduce the score. Itis similar to Service Level Agreements (SLAs) but more tolerant of rare occasionaldelays. Apdex ranges from 0 to 1, where 1 means all users are happy, and 0means all users are frustrated.In Performance testing, users can include up to 100 concurrent clients to test thePerformance of the Tableau Server and they can determine a pool of Tableauviews to include in the test case.Performance test run reports are illustrative and easy to understand, featuring anoverview of response times, availability score, and samples logs.Performance Test Report - Response Times15
TiCompatibilityFlexibility through Context VariablesTableau server connection details can be set up in context variables. Users canset-up multiple contexts, enabling them to run tests on multiple sites or servers,changing only the Active Context -- there is no need to refactor test cases.With changing context, continuous deployment of Tableau dashboards can also beimplemented.Importing Tableau Dashboards into Kinesis CIUsers can also import Tableau files, including twb and twbx workbooks and datasources into Kinesis. This way, dashboards can be kept together with therespective test cases, promoting test-driven development. Using this approach,users can constantly monitor their dashboards to make sure existing functionality ispreserved, even when new a functionality or features are added.Compatibility with Enterprise SolutionsKinesis CI is also compatible with Single Sign-On systems and other custom loginimplementations.16
Ti Test CasesRunningTest RunsThe tests are run by the command-line interface, and Tableau Server interactionsare executed by a web driver.Test runs can be executed from the UI one by one or automated in Windows TaskScheduler or Crontab. Users can also integrate Kinesis CI with a CI tool of yourchoice, such as Jenkins, Bamboo, or TeamCity.Version ControlKinesis CI projects use a Kinesis CI Project Standard Directory Layout that onlycontains text files (JSON files mostly), which enables easy collaboration betweendevelopers and version control.Sample Kinesis Project published to GitHub17
Ti Test CasesRunningContinuous IntegrationContinuous Integration (CI) is a development practice that requires developers tointegrate code into a shared repository several times a day. Each check-in is thenverified by an automated build, allowing teams to detect problems immediately andlocate them more easily.To run tests automatically on a Continuous Integration Server, i.e. Jenkins,TeamCity, etc., users need to install the Kinesis Command Line Interface to theserver where their CI server is running and integrate it with the CI tool of choice.Example Jenkins Pipeline with stages running Kinesis tests18
TiDeploymentDeploymentKinesis CI is shipped in bundle packages including the following two softwarecomponents: Kinesis Designer: User Interface for building and running test cases in an easyto-use environment. Command Line Interface (CLI): Used for running tests, enables automated testruns and continuous integration.The bundle packages contain self-executable files and no further installation isrequired. Kinesis Designer is installed locally at the BI developers’ computer andKinesis CLI may be deployed on a server to run tests automatically.Operating Systems Windows MacOS Linux (CLI Only)19
ConclusionTesting should be an integral part of our BI development process to deliver reliablereports in a cost-effective manner. Kinesis CI is a unique tool designed for Tableauthat provides a sophisticated and comprehensive test environment to cover all yourBI testing needs.
driven development for Tableau dashboards. Kinesis CI offers a versatile and flexible test framework for Tableau that can reduce the high costs of repetitive manual testing by shortening your BI development cycle and increasing the reliability of your BI dashboards. Write tests for your Tableau reports: using Kinesis Designer, analysts can