Transcription
ARTICLE IN PRESSJournal of Theoretical Biology 243 (2006) 575–586www.elsevier.com/locate/yjtbiA simplified model for mitochondrial ATP productionRichard Bertrama, , Morten Gram Pedersenb, Dan S. Lucianic, Arthur ShermandaDepartment of Mathematics and Programs in Neuroscience and Molecular Biophysics, Florida State University, Tallahassee, FL 32306, USAbDepartment of Mathematics, Technical University of Denmark, Kgs. Lyngby, DenmarkcDepartment of Cellular and Physiological Sciences, University of British Columbia, Vancouver, CanadadLaboratory of Biological Modeling, National Institutes of Health, Bethesda, MA, USAReceived 17 May 2006; received in revised form 4 July 2006; accepted 20 July 2006Available online 25 July 2006AbstractMost of the adenosine triphosphate (ATP) synthesized during glucose metabolism is produced in the mitochondria through oxidativephosphorylation. This is a complex reaction powered by the proton gradient across the mitochondrial inner membrane, which isgenerated by mitochondrial respiration. A detailed model of this reaction, which includes dynamic equations for the key mitochondrialvariables, was developed earlier by Magnus and Keizer. However, this model is extraordinarily complicated. We develop a simpler modelthat captures the behavior of the original model but is easier to use and to understand. We then use it to investigate the mitochondrialresponses to glycolytic and calcium input. We use the model to explain experimental observations of the opposite effects of raisingcytosolic Ca2þ in low and high glucose, and to predict the effects of a mutation in the mitochondrial enzyme nicotinamide nucleotidetranshydrogenase (Nnt) in pancreatic b-cells.r 2006 Elsevier Ltd. All rights reserved.Keywords: Metabolism; Calcium; Mathematical model1. IntroductionThe mitochondria are the primary location for theproduction of energy-carrying molecules in most cells.Metabolism begins in the cytoplasm with glycolysis, whereglucose is metabolized to the primary product pyruvate.The pyruvate enters the mitochondria through shuttles,where it is processed by the citric acid cycle. The coenzymesnicotinamide adenine dinucleotide ðNADþ Þ and flavinadenine dinucleotide (FAD) are reduced during the citricacid cycle, yielding NADH and FADH2 (some NADH isalso generated during glycolysis). These electron carriersare used by the electron transport chain (ETC), whichsupplies the energy to establish a proton gradient across theinner membrane of the mitochondria. The gradient is usedto power the last stage of metabolism, oxidative phosphorylation. Protons flowing down this gradient through theATP synthase complex provide the energy to phosphorylate adenosine diphosphate (ADP) to adenosine tripho Corresponding author. Tel.: 850 644 7195; fax: 850 644 4053.E-mail address: bertram@math.fsu.edu (R. Bertram).0022-5193/ - see front matter r 2006 Elsevier Ltd. All rights reserved.doi:10.1016/j.jtbi.2006.07.019sphate (ATP). This is the primary means through which theenergy molecule ATP is produced in most eukaryotic cells.In a series of papers in the late 1990s, Magnus andKeizer developed mathematical models of oxidativephosphorylation (Magnus and Keizer, 1997, 1998a,1998b). These models were developed in the context ofthe insulin-secreting pancreatic b-cell, and were coupled tomodels of the cell’s electrical activity and cytosolicCa2þ handling. The Magnus–Keizer (M–K) model includes most of the processes thought to be important formitochondrial oxidative phosphorylation, and indeed, thecompleteness of the M–K model is one of its strengths. Themodel was later used and modified by Cortassa et al., 2003to describe metabolism in cardiac cells. The Cortassamodel also makes some improvements to the M–K modeland includes a model, which we do not use here, forthe citric acid cycle developed by Dudycha and Jafri(Dudycha, 2000; Jafri et al., 2001).The M–K model was derived from first principles, and asa result it is very complex. Many of the properties of themodel, such as whether a flux term increases or decreaseswhen the value of a variable or parameter is changed, are
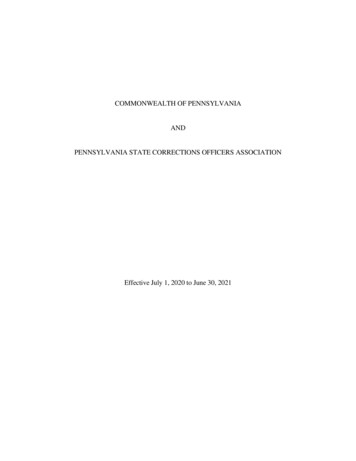
ARTICLE IN PRESS576R. Bertram et al. / Journal of Theoretical Biology 243 (2006) 575–586masked by this complexity. Our first goal is to develop asimplified model for oxidative phosphorylation that retainsthe key features of the M–K model, yet is more intuitive. Adescription of this simplified model, and comparison withthe M–K model as modified by Cortassa et al., is the focusof the first portion of the article.In the second portion, we use the simplified model tostudy the response of the mitochondrial variables to pulsesof calcium and a variable reflecting glycolytic flux, both ofwhich are inputs to mitochondrial metabolism. This yieldspredictions about whether the mitochondrial variablesincrease or decrease in response to the input. Measurements have been made of the levels of NAD(P)H, oxygen,and the mitochondrial inner membrane potential in, forexample, pancreatic b-cells. Besides the clinical significanceof these insulin-secreting cells, they are interesting sinceglucose metabolism is important not only for the survivalof the b-cell, but also for its electrical activity and patternedinsulin release.We next use the model to investigate a recent experimental result from mouse pancreatic islets that has beenhard to explain. It was found that elevations in theintracellular Ca2þ concentration increase the intracellularNADH concentration when the islet is maintained in a lowglucose bath. In higher glucose, a Ca2þ concentrationincrease results in a reduction in the NADH concentration(Luciani et al., 2006). Our model provides a plausiblemechanism for this.Finally, we consider the effects of a negative mutation inthe mitochondrial enzyme nicotinamide nucleotide transhydrogenase (Nnt). Such a mutation causes glucoseintolerance and impaired b-cell function in the widely usedC57BL/6J mouse strain (Toye et al., 2005). In the simplifiedmodel, simulation of the Nnt mutation is accomplished byincreasing the proton leak across the mitochondrial innermembrane. Increase of this single parameter results inchanges in the mitochondrial variables that would not beobvious without a mathematical model. This illustrates oneof the strengths of the simplified model: its relativesimplicity makes it possible to predict and understand theeffects of changes in one or more parameters or variables.This is particularly important when the mitochondrialmodel is just one component of a larger cellular model.2. Dynamic equationsWe begin by describing the dynamic equations for themitochondrial variables NADH m , ADPm , DC, and Cam .These equations are themselves simple. However, the fluxand reaction terms that make up the equations (Fig. 1) arequite complex in the M–K model, and it is those that wesimplify in the following section.The first stage of glucose metabolism in eukaryotic cellsis glycolysis, which takes place in the cytoplasm. Althoughthis produces some ATP and NADH, its primary output ispyruvate. The pyruvate is transported into the mitochondria where it is rapidly oxidized and decarboxylated by pFig. 1. Illustration of the fluxes and reactions used in the model. Thedifferent arrow types correspond to different types of fluxes or reactions.Arrows with line-type arrow heads represent the flux of Ca2þ . Arrows withopen arrow heads represent proton fluxes. Arrows with closed arrowheads represent nucleotide fluxes or phosphorylation events. Curvedarrows represent the production or oxidation of NADH. Finally, thedashed arrow represents input to the mitochondria from glycolysis.pyruvate dehydrogenase complex (PDH). The products ofPDH are a molecule of CO2, a molecule of NADH, andacetyl coenzyme A (acetyl CoA). The acetyl CoA enters thecitric acid cycle, where more NADH is produced byadditional dehydrogenases. As was done by Magnus andKeizer, we assume that the citric acid dehydrogenase ratesare proportional to the reaction rate of PDH, and let J PDHrepresent the reaction rate for the sum of the dehydrogenases. The NADH concentration is decreased by theaction of the ETC, during which NADH is converted toNADþ and oxygen is consumed:dNADH m¼ gðJ PDH J o Þ,dt(1)where NADH m is the mitochondrial NADH concentration,and J o is the oxygen consumption rate. Both J PDH andJ o have units of mM ms. The time t is measured in ms, andg ¼ 0:001 converts NADH m to units of mM.The mitochondrial ADP concentration increases due tothe action of the adenine nucleotide transporter, whichtransports ATP out of and ADP into the mitochondria.ADP concentration decreases due to the action of the ATPsynthase, which phosphorylates ADP to ATP. Thus,dADPm¼ gðJ ANT J F 1F 0 Þ,dt(2)where ADPm is the mitochondrial ADP concentration(with units of mM), J ANT is the nucleotide transport rate,and J F 1F 0 is the ATP synthase rate (both in mM ms).
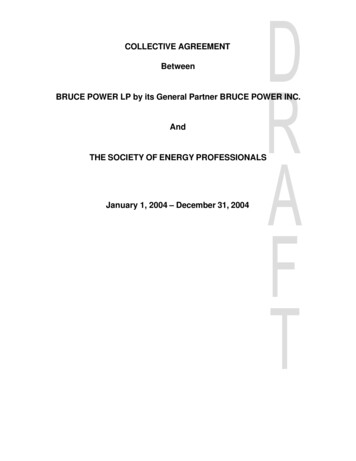
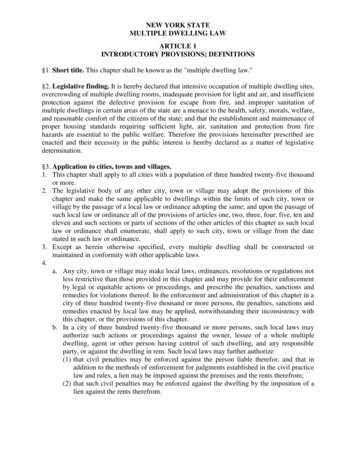
ARTICLE IN PRESSR. Bertram et al. / Journal of Theoretical Biology 243 (2006) 575–586577Table 1Parameter Values for the Simplified Modelp1 ¼ 400p4 ¼ 0:6 mMms 1p7 ¼ 5 mVp10 ¼ 177 mVp13 ¼ 10 mMp16 ¼ 35 mMms 1p19 ¼ 0:35 mMms 1p21 ¼ 0:01 mM 1 ms 1 mV 1p24 ¼ 0:016 mV 1C m ¼ 1:8 mM mV 1p2 ¼ 1p5 ¼ 0:1 mMp8 ¼ 7 mMms 1p11 ¼ 5 mVp14 ¼ 190 mVp17 ¼ 0:002 mMms 1 mV 1p20 ¼ 2NADm þ NADH m ¼ NADtot ,(3)ADPm þ ATPm ¼ Atot ,(4)kGPDH ¼ 5 10 4 mMms 1CacNADHmFBPwhere NADtot and Atot are the total concentrations (in mM,see Table 1).The inner membrane potential, DC, is influenced bymany fluxes and reactions:ð5Þwhere J H;res is the respiration-driven proton flux, J H;atp isthe proton flux through the ATP synthase, J H;leak is theproton leak across the mitochondrial inner membrane,J NaCa is the Ca2þ efflux through the electrogenicNaþ Ca2þ exchanger, and J uni is the Ca2þ influx throughthe Ca2þ uniporter. The mitochondrial capacitance is C m ,and DC has units of mV.Finally, the Ca2þ concentration in the mitochondria(Cam ) is increased by the Ca2þ uniporter and decreased bythe Na/Ca exchanger:dCam¼ f m ðJ uni J NaCa Þ,dt(6)where f m is the fraction of free Ca2þ .Rather than using pyruvate concentration as input toPDH, the glyceraldehyde 3-phosphate dehydrogenase(GPDH) activity is used in our description. This is aglycolytic enzyme downstream of the key allosteric enzymephosphofructokinase (PFK) in the glycolytic pathway.Thus, the GPDH reaction rate reflects the flux through theglycolytic pathway. We assume that the GPDH reaction isin rapid equilibrium. Tornheim (1979) then argued that itcan be described approximately by an algebraic function ofthe substrate fructose 1,6-bisphosphate ��ffiffiffiffiffiffiffiffiffiffiffiffiffiJ GPDH ¼ kGPDH ðFBPÞ ð1mMÞ,(7)where FBP hasmM ms 1 . Theanother input toCa2þ enters thep12 ¼ 120 mMms 1p15 ¼ 8:5 mVp18 ¼ 0:03 mMms 1FRT ¼ 0:037 mV 1p23 ¼ 0:001 mMms 1Atot ¼ 15 mMp22 ¼ 1:1 mM 1 ms 1NADtot ¼ 10 mMf m ¼ 0:01We assume that the mitochondrial concentrations ofadenine and pyridine nucleotides are conserved:dDC¼ ðJ H;res J H;atp J ANT J H;leakdt J NaCa 2J uni Þ C m ,p3 ¼ 0:01 mMp6 ¼ 177 mVp9 ¼ 0:1 mMunits of mM and J GPDH has units ofcytosolic Ca2þ concentration, Cac , ismitochondrial respiration, since cytosolicmitochondria through Ca2þ uniporters,ATPmCam ΨJoFig. 2. Input and output of mitochondrial respiration, and mitochondrialvariables present in the model. Oxygen consumption, J o , is also illustratedsince it is an observable quantity.and affects the mitochondrial dehydrogenases and theinner membrane potential.The end product of metabolism is ATP. Thus, the outputvariable for mitochondrial metabolism is the mitochondrialATP concentration. This is turn determines the cytosolicATP concentration, through the action of the adeninenucleotide translocator. Input, output, and mitochondrialvariables are illustrated in Fig. 2. Also illustrated is theoxygen flux, since this is a measurable quantity.3. Model simplificationIn this section we describe the flux and reaction ratesused in the dynamic equations from the previous section.We begin the descriptions of the terms with mathematicalexpressions from Cortassa et al. (2003), which arethemselves modifications of expressions from the M–Kmodel (Magnus and Keizer, 1998a, 1998b). The Cortassaexpressions are used since they have been somewhatimproved over those from the M–K model. We still,however, refer to these as ‘‘M–K expressions’’ or ‘‘M–Kfunctions’’ since the original formulation was by Magnusand Keizer.We begin with the pyruvate dehydrogenase (PDH)reaction rate, J PDH . (The hat superscript is used here todistinguish the M–K expression from our simplifiedexpression.) This reaction decarboxylates pyruvate, butsince we use GPDH as input to the mitochondria, we usethe GPDH reaction rate (Eq. 7) as input to PDH. PDH isalso known to be stimulated by mitochondrial Ca2þ . Wemodify the M–K expression for J PDH by adding an explicit
ARTICLE IN PRESSJ PDH ¼ ðV PDH F PDH J GPDH Þ g2 ,(8)where V PDH ¼ 77 mM s, g2 ¼ 0:1 is the mitochondria/cytosol volume ratio, and J GPDH is the GPDH reactionrate. (Cortassa et al. converted M–K parameter values toSI units. We use these parameter values, and convert frommM to mM.) Finally,1.(B)(9)JPDH (µM/ms)F PDH ¼1 þ u2 ½ð1 þ u1 ð1 þ Cam K PDHca Þ 2 Þ ðNADH m NADm þ K PDHnad Þ Here u1 ¼ 1:5, u2 ¼ 1:0, K PDHca ¼ 0:05 mM and K PDHnad ¼1. In the M–K model it was assumed that the reaction rateof citric acid dehydrogenases is proportional to that ofPDH (Magnus and Keizer, 1998a), and J PDH representsthe sum of these two.The simplified PDH reaction rate function that we use is p1CamJ PDH ¼J GPDH .p2 þ NADH m NADmp3 þ Cam(10)Values for the three parameters ðp1 ; p2 ; p3 Þ, as well as otherparameter values for the simplified model, are given inTable 1. The PDH reaction rate computed with thetwo models is shown in Fig. 3. The top panel showsthat J PDH increases linearly with J GPDH , andJ PDH computed with Eq. (10) (dashed curve) closelymatches that computed with Eq. (8) (solid curve). Thedependence on NADH is shown in Fig. 3(B), with the totalNAD concentration ðNADH m þ NADm Þ held constant at10 mM. The PDH rate decreases when NADH m isincreased (and NADm decreased) since NADþ is asubstrate for PDH. The dependence of J PDH on themitochondrial Ca2þ concentration is shown in Fig. 3(C).The dehydrogenase rate increases with Cam , but saturatesat relatively low values of Cam . This Ca2þ dependencebecomes important later, when we study the effects of inputpulses on the mitochondrial variables.Oxygen is consumed during the final stage of electrontransport, and this reflects conversion of NADH to NADþby the loss of electrons. The expression for O2 consumption(J o ) is quite complex in the M–K model, with dependencyon NADþ , NADH, and the proton motive force ðDmH Þ:0:5rres ðA B þ CÞ,J o ¼D(11)whereA ¼ K res ðra þ rc1 e6DCB FRT ��ffiffiNADH m NADm ,B ¼ ra e6gDmH FRT ,C ¼ rc2 K res e6gDmH ��ffiffiffiffiffiNADH m NADm ,(14)0.80.4000.51JGPDH (µM/s)(A)JPDH (µM/ms)dependence on the ratio of product NADH to substrateNADþ . The modified expression for the PDH reaction rate(in units of mM ms) isJPDH (µM/ms)R. Bertram et al. / Journal of Theoretical Biology 243 (2006) 575–5865781.520.60.50.40.30.00.51.01.5NADHm (mM)0.60.40.20.00.0(C)0.10.20.3Cam (µM)0.40.5Fig. 3. PDH reaction rate computed with Eq. (8) (solid curves) and thesimplified expression (Eq. (10), dashed curves). (A) J PDH increases linearlywith J GPDH . (NADH m ¼ 0:3 mM, Cam ¼ 0:2 mM.) (B) The reaction ratedecreases when NADH m is increased and NADm is decreased, maintainingNADH m þ NADm ¼ 10 mM (J GPDH ¼ 1:5 mM s, Cam ¼ 0:2 mM). (C) Thedehydrogenase saturates at higher values of Cam (NADH m ¼ 0:3 mM,J GPDH ¼ 1:5 mM ffiffiffi 6DC FRTNADH m NADm Þe �ffiffiþ ðr2 þ r3 K res NADH m NADm Þe6gDmH FRT .D ¼ ð1 þ r1 K resð15Þ18Here rres ¼ 0:6036 mM, K res ¼ 1:35 10 , ra ¼ 6:394 10 13 ms 1 , rc1 ¼ 2:656 10 22 ms 1 , rc2 ¼ 8:632 10 30ms 1 , DCB ¼ 50 mV, FRT ¼ F RT ¼ 0:037 mV 1 is Faraday’s constant divided by the gas constant and temperature, g ¼ 0:85, r1 ¼ 2:077 10 18 , r2 ¼ 1:728 10 9 , andr3 ¼ 1:059 10 26 . See Magnus and Keizer (1998a) orCortassa et al. (2003) for a description of parameters. Theproton motive force, DmH , includes both the membranepotential, DC, and a contribution due to the protonconcentration gradient, DpH:DpH,FRTwhere DpH ¼ 0:6.Our simplified expression for J o is p4 NADH m1Jo ¼.1 þ expððDC p6 Þ p7 Þp5 þ NADH mDmH ¼ DC þ(16)(17)Fig. 4 shows the O2 consumption rates calculated fromEqs. (11) and (17), with p4 –p7 adjusted to match the M–Kcurves. The consumption rate declines for large DC (Fig.4(A)), since it is more difficult to pump protons against alarge potential (metabolic control). The consumption rateincreases with the NADH concentration (Fig. 4(B)), sinceNADH is an electron donor.As oxygen is consumed by the ETC, protons are pumpedacross the inner mitochondrial membrane. Thus, therespiration-driven proton flux, J H;res , is linked to O2
ARTICLE IN PRESS0.20.0120140JO (µM/ms)160180 Ψ 00.00.5E ¼ ra K ffiffiffiNADH m NADm ,F ¼ ðra þ rb Þeð6gDmH FRT Þ(19)(20)and D is given by Eq. (15). The simplified expression forJ H;res is similar to that for J o , p8 NADH m1J H;res ¼.1 þ expððDC p10 Þ p11 Þp9 þ NADH m(21)Fig. 5 shows J H;res calculated from both Eqs. (18) and (21).As expected, the dependence of this flux term on DC andNADH m is similar to that of J o (Fig. 4).ADP is converted to ATP using the energy provided bythe flow of protons down their concentration gradientthrough the F1F0 ATP-synthase. This is the step at whichmost of the ATP is formed during glucose metabolism.Proton flux through the ATP-synthase in the M–K model is1.01.5NADHm (mM)40200120140(B)160180 Ψ (mV)(A)JH,atp (µM/ms)J H;res6r ðE F Þ,¼ resD180Fig. 5. Proton flux across the inner mitochondrial membrane due torespiration, calculated with the M–K expression (Eq. (18)) and thesimplified expression (Eq. (21)). (A) J H;res decreases with DC, reflectingmetabolic control ðNADH m ¼ 0:3 mMÞ. (B) Proton flux increases with anincrease in the concentration of the electron donor to the electrontransport chain. ðDC ¼ 160 mV.)JH,atp (µM/ms)consumption. Both NADH and FADH are electrondonors, but in the M–K model NADH is the primarydonor. We therefore omit the contribution to J H;res fromFADH. The M–K expression for the contribution toJ H;res from NADH is:160 Ψ (mV)(B)Fig. 4. Oxygen consumption rate, calculated with the M–K expression(Eq. (11), solid curves) and with the simplified expression (Eq. (17), dashedcurves). (A) J o declines with DC, reflecting metabolic controlðNADH m ¼ 0:3 mMÞ. (B) J o increases with NADH, the electron donorto the electron transport chain ðDC ¼ 160 mVÞ.579140(A)NADHm (mM)(B)JH.res (µM/ms)0.4JH.res (µM/ms)JO (µM/ms)R. Bertram et al. / Journal of Theoretical Biology 243 (2006) 575–58664200123ATPm (mM)45Fig. 6. Proton flux through the ATP-synthase, calculated with the M–Kexpression (Eq. (22), solid curves) and with the simplified expression(Eq. (28), dashed curves). (A) J H;atp increases with the electrical gradient,DC. ðATPm ¼ 3 mMÞ. (B) J H;atp declines as the concentration of thereaction product increases. ðDC ¼ 160 mVÞ.and where ATPm FRT.AF 1 ¼ ln K F 1Pi ADPm(27)G ¼ 100pa ð1 þ eAF 1 FRT Þ,(23)H ¼ ðpa þ pb Þe3DmH FRT ,(24)K ¼ ð1 þ q1 eAF 1 FRT Þe3DCB FRT ,(25)Parameter values are pa ¼ 1:656 10 8 ms 1 , pb ¼ 3:373 10 10 ms 1 , q1 ¼ 1:346 10 8 , q2 ¼ 7:739 10 7 , q3 ¼6:65 10 15 , K F 1 ¼ 1:71 106 , and Pi ¼ 20 mM is theinorganic phosphate concentration.In the simplified expression for J H;atp there is anincreasing sigmoidal dependence on DC and a weakdecreasing dependence on ATPm : p13p12J H;atp ¼. (28)p13 þ ATPm1 þ expððp14 DCÞ p15 ÞL ¼ ðq2 þ q3 eAF 1 FRT Þe3DmH FRT ,(26)Graphs of the M–K (Eq. (22)) and simplified (Eq. (28))expression are compared in Fig. 6.J H;atp ¼ 3rF1G H,K þL(22)where rF 1 ¼ 1:787 mM is the concentration of the ATPsynthase, and
ARTICLE IN PRESSThe M–K expression for the phosphorylation rate ofADP by the ATP-synthase, J F 1F 0 , isM N,¼ rF 1K þLJ F 1F 0(29)Jleak (µM/ms)R. Bertram et al. / Journal of Theoretical Biology 243 (2006) 575–5865800.40.30.2120140N ¼ pa e3DmH FRT þ pc2 eAF 1 FRT e3DmH FRT(31)and K and L are given by Eqs. (25), (26). Because thephosphorylation rate of ADP is determined by the protonflux through the synthase, the simplified expression forJ F 1F 0 is similar to that of J H;atp . In fact, J F 1F 0 is a constantmultiple of J H;atp : p13p16J F 1F 0 ¼. (32)p13 þ ATPm1 þ expððp14 DCÞ p15 ÞThe ADP phosphorylation rates computed with Eqs. (29)and (32) are shown in Fig. 7.There is a small leak of protons across the innermitochondrial membrane, which is larger for larger valuesof the electrical potential. This is linear in the M–K model:J H;leak ¼ gH DmH ,(33)where gH ¼ 2 10 3 mM ms 1 mV 1 . In our model we usethe linear functionJ H;leak ¼ p17 DC þ p18 .JF1F0 (µM/ms)1050120140160180 Ψ (mV)(A)2100110502468160180RATm(A)1050120140 Ψ (mV)(B)Fig. 9. Flux through the adenine nucleotide translocator, calculated withthe M–K expression (Eq. (35), solid curves) and the simplified expression(Eq. (38), dashed curves). (A) Flux increases with the ATP concentration,and thus with the ATP/ADP ratio. (DC ¼ 160 mVÞ. (B) Flux increaseswith the inner membrane potential ðRATm ¼ 5Þ.(34)Note that we have replaced the pH dependence with aconstant factor p18 . The fluxes computed using Eqs. (33)and (34) are shown in Fig. 8.The ATP produced in the mitochondria is transported tothe cytosol through the adenine nucleotide translocator.This is a carrier that exchanges one molecule of mitochondrial ATP4 for one molecule of cytosolic ADP3 . It tendsto keep the ATP/ADP ratio in the cytosol equal to that inthe mitochondria. In the M–K formulation the flux rate,JF1F0 (µM/ms)180Fig. 8. Proton leakage across the inner membrane increases with theelectrical potential. Computed with Eq. (33) (solid curves), and with Eq.(34) (dashed curves).JANT (µM/ms)(30)JANT (µM/ms)M ¼ ð100pa þ pc1 e3DCB FRT ÞeAF 1 FRT ,(B)160 Ψ (mV)where23ATPm (mM)45Fig. 7. Phosphorylation rate of the ATP synthase, calculated with theM–K expression (Eq. (29), solid curves) and with the simplified expression(Eq. (32), dashed curves). (A) Phosphorylation is powered by the electricalgradient, and thus increases with DC. ðATPm ¼ 3 mMÞ. (B) J F1F0 declinesas the concentration of the reaction product is increased. ðDC ¼ 160 mVÞ.J ANT , isJ ANT ¼ V maxANTRAT m 0:8 RAT c,ð1 þ 0:11RAT c ÞðRAT m þ 7:2Þeð 0:5FRT DCÞ(35)where V maxANT ¼ 5 mMms 1 is the maximum flux rate, andRAT m ¼ATPm,ADPm(36)RAT c ¼ATPc,ADPc(37)are the nucleotide ratios in the mitochondria and thecytosol, respectively. Fig. 9 shows the dependence ofJ ANT on the mitochondrial nucleotide ratio and on theinner membrane potential. Since the transporter maintainsRAT c RAT m , we assume that RAT c ¼ RAT m in thefigure. The transporter is driven at a higher rate when themitochondrial ATP/ADP ratio is larger (Fig. 9(A)), andthe transport rate increases with the inner membranepotential (Fig. 9(B)). In the simplified expression, we setRAT c ¼ RAT m and replace the dependence on RAT m witha simpler functional form: RAT m(38)J ANT ¼ p19e0:5FRT DC .RAT m þ p20The Ca2þ uniporter carries Ca2þ from the cytosol intothe mitochondrion and depends on the electrical driving
ARTICLE IN PRESSforce DC. This is described in the M–K model by O J uni ¼ V maxUni,PþQ(39)where CacCac 31þ,K transK trans(40) Cac 4,P¼ 1þK trans(41)0.020.010.00120140J uni ¼ ðp21 DC p22 ÞCa2c .(43)The original and simplified expressions for the uniporterrate are shown in Fig. 10. The rate increases when eitherthe inner membrane potential or the cytosolicCa2þ concentration increase.The final flux term is for the Naþ Ca2þ exchanger, whichtransports Ca2þ out of the mitochondria while bringingNaþ in. The original M–K expression for J NaCa wasmodified by Cortessa et al. to include a dependence onthe mitochondrial Ca2þ concentration. The reformulatedexpression for J NaCa isoJ NaCa ¼ V maxNaCaðCam Cac ÞebFRTðDC DC Þ,ð1 þ K Na Nac Þ3 ð1 þ K Ca Cam Þ(44)Juni (µM/ms)where Nac ¼ 10 mM is the Naþ concentration in the cytosol, V maxNaCa ¼ 0:06 mMms 1 , b ¼ 0:5, K Na ¼ 9:4 mM, andK Ca ¼ 3:75 10 4 mM. The simplified expression ac (µM)0.40.5Juni (µM/ms)180(C)0.10.20.3Cam (µM)0.40.50.040.020.000.0Fig. 11. The Naþ Ca2þ exchanger flux, calculated with the M–Kexpression (Eq. (44), solid curves) and the simplified expression(Eq. (45), dashed curves). (A) The flux has a positive dependence on theinner membrane potential. ðCac ¼ 0:2 mM, Cam ¼ 0:2 mMÞ. (B)J NaCa decreases with the cytosolic Ca2þ concentration ðCam ¼ 0:2 mM,DC ¼ 160 mV), and increases with the mitochondrial Ca2þ concentrationðCac ¼ 0:2 mM, DC ¼ 160 mVÞ.the dependence on Cac , Cam , and DC: Cam p24 DC.J NaCa ¼ p23eCac(45)Fig. 11 shows J NaCa over a range of values of its threevariables. It is assumed that the cytosolic Naþ concentration is constant. There is a positive dependence on the innermembrane potential (Fig. 11(A)). As expected from thenature of the Naþ Ca2þ exchanger, the flux is greater whenthe cytosolic Ca2þ concentration is lower (Fig. 11(B)),or when the mitochondrial Ca2þ concentration is greater(Fig. 11(C)).The differential equations for the full model were solvednumerically using the CVODE solver with tolerance of10 9 , implemented in the software package XPPAUT(Ermentrout, 2002). The XPPAUT software is free and canbe downloaded from www.pitt.edu/ phase. The file containing the mitochondrial model can be downloaded fromwww.math.fsu.edu/ bertram. Ψ (mV)(A)(B)160JNaCa (µM/ms)The maximum transport rate is V maxUni ¼ 10 mMms 1 , andK trans ¼ 19 mM, K act ¼ 0:38 mM, L ¼ 110, DCo ¼ 91 mV isthe offset membrane potential, and Cac is the cytosolicCa2þ concentration. The uniporter flux is greatly simplifiedwith the expression1800.04o(42)160 Ψ (mV)(B)L1 ð1 e 2FRT ðDCm DC Þ ÞQ¼.ð1 þ Cac K act Þna5810.03(A)JNaCa (µM/ms)O ¼ 2FRTðDCm DCo ÞJNaCa (µM/ms)R. Bertram et al. / Journal of Theoretical Biology 243 (2006) 575–5860.120.080.040.000.04. Mitochondrial responses to input0.10.20.3Cac (µM)0.40.5Fig. 10. The uniporter transport rate, calculated with the M–K expression(Eq. (39), solid curves) and the simplified expression (Eq. (43), dashedcurves). (A) The transport rate increases with the inner membranepotential ðCac ¼ 0:2 mMÞ, and (B) with the cytosolic Ca2þ concentrationðDC ¼ 160 mVÞ.An increase in the glucose concentration increases theglycolytic flux, leading to an increase in the FBPconcentration. In addition, glycolysis has been shown tobe oscillatory in some cases (Tornheim and Lowenstein,1974; Longo et al., 1991), resulting in periodic pulses ofFBP. We next examine the affect that a single FBP pulsehas on the mitochondrial variables.Fig. 12 shows the responses to steps in the FBPconcentration to 5, 10, or 15 mM (Fig. 12(A)), with the
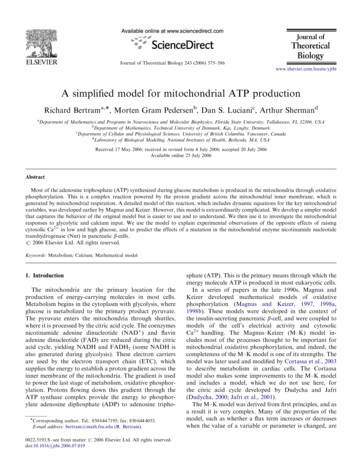
ARTICLE IN PRESSR. Bertram et al. / Journal of Theoretical Biology 243 (2006) 575–586(E)3 45 6 7(B)20123 45 6 70.80.40123 45 6 7(D)012 3 4 5Time (min)67(F)1601400123 45 6 76420(A)(C)0.2012 3 4 5Time (min)67Fig. 12. The effects of FBP steps on the mitochondrial variables. Thecytosolic Ca2þ concentration is 0:1 mM.cytosolic Ca2þ concentration held constant at 0:1 mM.Each step provides fuel for the mitochondria, so there isa resulting increase in NADH m (Fig. 12(C)). The elevatedNADH m increases respiration, increasing the oxygenconsumption (Fig. 12(E)). The increased respirationhyperpolarizes the inner membrane (Fig. 12(D)), resultingin increased ATP production through the F1F0 ATPsynthase (Fig. 12(F)). The hyperpolarized membrane alsoincreases the Ca2þ uniporter flux rate (Fig. 10), leading to aslight increase in the mitochondrial Ca2þ concentration(Fig. 12(B)). Since respiration saturates at large NADHconcentrations (Fig. 5), reflecting metabolic control, thereis a saturation of J o , DC, and ATPm for the higher FBPconcentrations.Calcium concentration changes in the cytosol typicallyoccur as the result of ion channel openings or Ca2þ releasefrom the endoplasmic reticulum. In many cases, Cac iselevated due to bursts of action potentials. In Fig. 13 weshow the response of the model to three 30-s Cac pulses,with FBP concentration held constant at 5 mM. Each pulsecould reflect a burst of action potentials, which is typicallytens of seconds in duration in pancreatic b-cells (Zhang etal., 2003).The entry of Ca2þ across the inner mitochondrialmembrane affects the mitochondria in two ways: the fluxof positive ions depolarizes the inner membrane (theelectrical effect), and the increase in Cam activates PDH,increasing NADH m and leading to hyperpolarization of themembrane (the dehydrogenase effect). In Fig. 13 we showthe results of these combined actions (solid curves), as wellas the electrical effect in isolation (dashed curves), obtainedby setting p3 ¼ 0, which removes the dehydrogenase effect.Panel C shows that the Ca2þ pulses increase NADH m(solid curve), as expected from the dehydrogenase effect.This transiently enhances respiration, as shown by(E)01234567(B)0.30.20.14200123456701234567012 3 4 5Time (min)671650.4012345670.50.40.30Cam (µM)Cac (µM)018010060.4 Ψ (mV)20.1NADHm (mM)Cam (µM)10.2Jo (µM/ms)JO (µM/ms)(C)0 Ψ (mV)NADHm (mM)(A)1000.60.3ATPm (mM)FBP (µM)20(D)ATPm (mM)582012 3 4 5Time (min)67(F)16015543.53Fig. 13. The effects of Ca2þ steps on the mitochondrial variables. Thedashed curves show the result when the stimulatory effect of Ca2þ onPDH activity is saturated by setting p3 ¼ 0 in Eq. (10). The FBPconcentration is 5 mM.increases in the oxygen consumption (Fig. 13(E)). Theenhanced respiration hyperpolarizes the inner membrane(Fig. 13(D)), increasing the ATP production (Fig. 13(F)).Thus, the Ca2þ pulses p
Finally, we consider the effects of a negative mutation in the mitochondrial enzyme nicotinamide nucleotide trans-hydrogenase (Nnt). Such a mutation causes glucose intolerance and impaired b-cell function in the widely used C57BL/6J mouse strain (Toye et al., 2005). In the simplified model, simulation of the Nnt mutation is accomplished by