Transcription
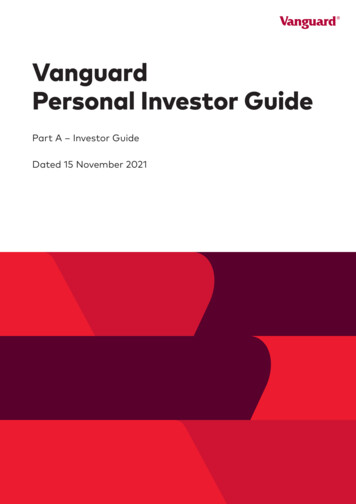
Vanguard Vanguard Wellesley Income FundProduct SummaryBalanced allocation: 60%–65% bonds, 35%–40% stocks.Seeks long-term growth of income, a high and sustainable level ofVanguard Style View : Conservative AllocationPortfolio emphasizing large- and mid-capitalization value stocks.current income, along with moderate long-term capital appreciation.Equities with strong income orientation.Fundamental research approach.Market capitalizationIntermediate duration, investment-grade fixed income securities.Investment styleValue Blend GrowthLargeMidSmallDiversified portfolio of intermediate-term, investment-grade bonds.DurationShort Medium LongQualityTrsy/AgcyInvGrdCorpBelowInvGrdCentral tendencyExpected range of fund holdingsQuarterly CommentaryThe second quarter of 2022 was another difficult period for globalfinancial markets. Inflation readings across much of the worldwere at levels not seen in decades as supply chain bottleneckspersisted and the war in Ukraine increased pressure on risingenergy and food prices. Central banks in many developedcountries, including the United States and the United Kingdom,acted to counter inflation by raising short-term interest rates. TheEuropean Central Bank moved to end its asset purchases andindicated it would begin raising rates in July.Stocks retreated amid concerns that high inflation and tightermonetary policy could bring on a recession. They ended thequarter down more than 15%, as measured by the FTSE Global AllCap Index. U.S. stocks declined slightly more than the globalmarket, while stocks in Europe, the Asia-Pacific region, andespecially emerging markets held up a little better.Yields of U.S. Treasuries rose across the maturity spectrum, withmore movement at the shorter end of the curve, given theprospect of more rate hikes by the Federal Reserve. The broadU.S. investment-grade bond market declined close to 5% (asmeasured by the Bloomberg U.S. Aggregate Float Adjusted Index).Vanguard Wellesley Income Fund outperformed both isbenchmark, the Wellesley Income Composite Index (–6.88%), andthe average return of its peers (–8.47%) for the quarter.The fund’s equity portion outperformed its benchmark, the FTSEHigh Dividend Yield Index (–8.62%), driven by both strongselection and sector allocation decisions. Strong selection infinancials (–15.6%), consumer staples (–3.4%), and consumerdiscretionary (–13.0%) was a contributor to performance, whilepoor selection and an underweight to energy (–5.0%) detracted.As of June 30, 2022The fund’s fixed income component underperformed itsbenchmark, the Bloomberg U.S. Credit A or Better Bond Index(–6.00%).For the 12 months ended June 30, the fund outperformed itscomposite benchmark (–8.15%) and peer average (–11.42%). Thefund’s equity portion outperformed its benchmark ( 0.07%), withstrong selection and an underweight to both financials (–13.5%)and consumer discretionary (–16.9%) helping returns. Poorselection in health care ( 20.0%) detracted. The fund’s fixedincome component underperformed its benchmark (–12.55%).Note: Company returns may differ if a security was held in theportfolio for less than the full period.People and ProcessVanguard Wellesley Income Fund seeks long-term growth ofincome, a high and sustainable level of current income, andmoderate long-term capital appreciation by investing in high-qualitybonds and stocks. The fund seeks to provide an attractive andstable income stream that increases over time, with moderatecapital appreciation and moderate risk. Asset allocation changesare made gradually in response to changes in relative valuations.
Vanguard Wellesley Income FundFixed Income Component: May invest in short-, intermediate,and long-term investment-grade corporate bonds, while seeking tomaintain an aggregate intermediate duration. Also can invest inU.S. Treasury, government, agency, and mortgage-backedsecurities. The fund advisor adds value through activemanagement, such as adjusting sector weightings in response tomarket opportunities.Wellington Management Company LLPFounded in 1928, Wellington Management Company LLP, Boston,Massachusetts, is among the nation’s oldest and most respectedinstitutional investment managers. The firm has advised VanguardWellesley Income Fund since 1970.Investment Manager BiographiesEquity Component: Focuses on large-company value stocks withabove-average dividends and potential for income growth. Usingfundamental research, the advisor typically invests in fewer than100 stocks, generally with low price/earnings and price/bookratios, and stable or improving fundamentals.Loren L. Moran, CFA, Senior Managing Director. Portfoliomanager. Advised the fund since 2017. Worked in investmentmanagement since 2006. B.S., Georgetown University.Matthew C. Hand, CFA, Managing Director. Portfolio manager.Advised the fund since 2021. Worked in investment managementsince 2004. B.A., University of Pennsylvania.Total ReturnsExpenseRatioQuarterYearto Date1 Year3 Years5 Years10 YearsWellesley Income FundInvestor Shares dmiral Shares ey Income Composite Index—-6.88-10.92-8.152.614.005.45Mixed-Asset Target AllocationConservative Funds Average—-8.47-12.89-11.421.022.283.51The performance data shown represent past performance, which is not a guarantee of future results. Investment returns and principal value willfluctuate, so investors’ shares, when sold, may be worth more or less than their original cost. Current performance may be lower or higher thanthe performance data cited. For performance data current to the most recent month-end, visit our website at vanguard.com/performance. Theperformance of an index is not an exact representation of any particular investment, as you cannot invest directly in an index. Figures for periods ofless than one year are cumulative returns. All other figures represent average annual returns. Performance figures include the reinvestment of all dividendsand any capital gains distributions. All returns are net of expenses.Note: Wellesley Income Composite Index: Weighted 65% bonds and 35% stocks. For bonds: Lehman U.S. Long Credit AA or Better Bond Index throughMarch 31, 2000, and Bloomberg U.S. Credit A or Better Bond Index thereafter. For stocks: 26% S&P 500/Barra Value Index and 9% S&P Utilities Indexthrough June 30, 1996, when the utilities component was split into the S&P Utilities Index (4.5%) and the S&P Telephone Index (4.5%); as of January 1,2002, the S&P Telephone Index was replaced by the S&P Integrated Telecommunication Services Index; as of July 1, 2006, the S&P 500/Barra Value Indexwas replaced by the S&P 500/Citigroup Value Index; as of August 1, 2007, the three stock indexes were replaced by the FTSE High Dividend Yield Index.Average fund returns are derived from data provided by Lipper, a Thomson Reuters Company. Admiral class shareholders are required to maintain specificminimum balances and meet other special criteria.As of June 30, 2022
Vanguard Wellesley Income FundQuarterly Returns: Investor SharesYear-End2nd Quarter3rd Quarter4th QuarterWellesleyIncome FundFTSE HighDividendYieldIndexAssets(Millions)Year1st Quarter2022-3.59%-6.68%———— 0.069.8811,647Quarterly Returns: Admiral SharesYear-EndYear1st Quarter2nd Quarter2022-3.59%-6.66%20211.042020-7.4120193rd Quarter4th QuarterWellesleyIncome FundFTSE HighDividendYieldIndexAssets(Millions)———— 4423,80320123.651.523.890.7110.109.8820,696As of June 30, 2022
Vanguard Wellesley Income FundFund FactsFund NumberTickerNewspaper ListingCUSIP NumberVolatility IAXWellslWellslAdml921938106921938205Assets (millions)(Total 59,542) 10,918 48,625Inception7/1/19705/14/20010.23%0.16%Expense Ratio(as of 1/2022)Fund Asset Allocation% ofTotal Net AssetsStocks36.3%Bonds61.9Short-term reserves1.8Total100.0 %Equity CharacteristicsWellesleyIncome FundNumber of stocksFTSE HighDividendYieldIndex66443Median market cap 109.7 Billion 130.0 BillionAverage market cap 143.0 Billion—15.2x14.1x2.6x2.4xReturn on equity14.3%15.2%Earnings growth rate12.3%11.0%Equity yield (dividend)2.9%3.1%Foreign holdings2.7%0.0%Short-term reserves0.0%—Price/earnings ratioPrice/book ratioTurnover rate (fiscal year end)39.1%—R-SquaredBetaWellesley Income Composite Index0.990.98DJ US Total Stock Mkt Float Adj Idx0.830.39R-squared and beta are calculated from trailing 36-month fund returnsrelative to the associated benchmark.Ten Largest Stocks% ofTotal Net AssetsJohnson & Johnson3.9%Pfizer Inc.3.8JPMorgan Chase & Co.3.6Home Depot Inc.3.1Merck & Co. Inc.3.0ConocoPhillips2.7Procter & Gamble Co.2.6Cisco Systems Inc.2.6MetLife Inc.2.5Mondelez International Inc.2.4Top Ten as % of Common Stock30.2%Top Ten as % of Total Net Assets11.0%The holdings listed exclude any temporary cash investments and equityindex products.Distribution by Credit Quality% of PortfolioU.S. Government22.4%Aaa3.6Aa11.0A41.9Baa23.0Ba0.1Not RatedTotal-2.0100.0%Credit-quality ratings are measured on a scale that generally ranges fromAAA (highest) to D (lowest). "NR" is used to classify securities for which arating is not available. NR securities may include a fund's investment inVanguard Market Liquidity Fund or Vanguard Municipal Cash ManagementFund, each of which invests in high-quality money market instruments andmay serve as a cash management vehicle for the Vanguard funds, trusts,and accounts. U.S. Treasury, U.S. Agency, and U.S. Agencymortgage-backed securities appear under "U.S. Government." Credit-qualityratings for each issue are obtained from Bloomberg using ratings derivedfrom Moody's Investors Service (Moody's), Fitch Ratings (Fitch), andStandard & Poor's (S&P). When ratings from all three agencies areavailable, the median rating is used. When ratings are available from two ofthe agencies, the lower rating is used. When one rating is available, thatrating is used.As of June 30, 2022
Vanguard Wellesley Income FundSector Diversification (% of Stocks)WellesleyIncome FundFTSE ication Services3.4%4.5%-1.1Consumer Discretionary5.86.5-0.714.613.70.9Consumer h Care17.316.40.9Industrials9.39.10.2Information .0Real Sector categories are based on the Global Industry Classification Standard( GICS ), except for the Other category (if applicable), which includessecurities that have not been provided a GICS classification as of theeffective reporting period.Fixed Income CharacteristicsWellesleyIncome FundNumber of bondsAverage effective maturityBloombergCreditA or BetterIndex1,2724,06410.6 years10.6 years7.2 years7.2 yearsDistribution by Effective Maturity% ofPortfolioUnder 1 Year3.6%1 to 2 Years9.0%2 to 3 Years10.9%3 to 4 Years8.7%4 to 5 Years10.4%5 to 6 Years5.4%6 to 7 Years4.2%% of Portfolio7 to 8 Years4.3%Asset-Backed1.8%8 to 9 Years3.3%Commercial Mortgage-Backed0.39 to 10 Years5.3%Finance29.710 to 11 Years4.8%Foreign2.311 to 12 Years0.8%4.212 to 15 Years3.0%27.415 to 20 Years8.2%20 to 30 Years15.1%Average durationDistribution by IssuerGovernment 8.78.8Other6.8Total100.0%As of June 30, 2022Over 30 YearsTotal3.0%100.0%
Vanguard Wellesley Income FundAs of June 30, 2022
Important informationFor more information about Vanguard funds or Vanguard ETFs, visit vanguard.com or call 800-523-1036 to obtain a prospectus or, ifavailable, a summary prospectus. Investment objectives, risks, charges, expenses, and other important information are contained in theprospectus; read and consider it carefully before investing.Vanguard ETF Shares are not redeemable with the issuing Fund other than in very large aggregations worth millions of dollars. Instead,investors must buy or sell Vanguard ETF Shares in the secondary market and hold those shares in a brokerage account. In doing so, the investormay incur brokerage commissions and may pay more than net asset value when buying and receive less than net asset value when selling.All investing is subject to risk, including the possible loss of the money you invest.Investments in bond funds and ETFs are subject to interest rate, credit, and inflation risk.The Factor Funds are subject to investment style risk, which is the chance that returns from the types of stocks in which a Factor Fund invests will trail returns fromU.S. stock markets. The Factor Funds are also subject to manager risk, which is the chance that poor security selection will cause a Factor Fund to underperform itsrelevant benchmark or other funds with a similar investment objective, and sector risk, which is the chance that significant problems will affect a particular sectorin which a Factor Fund invests, or that returns from that sector will trail returns from the overall stock market.Vanguard Commodity Strategy Fund could lose all, or substantially all, of its investments in instruments linked to the returns of commodity futures or othercommodity investments. Commodity futures trading is volatile, and even a small movement in market prices could cause large losses.Investments in derivatives may involve risks different from, and possibly greater than, those of investments in the underlying securities or assets.London Stock Exchange Group companies includes FTSE International Limited (“FTSE”), Frank Russell Company (“Russell”), MTS Next Limited (“MTS”), and FTSETMX Global Debt Capital Markets Inc (“FTSE TMX”). All rights reserved. “FTSE ”, “Russell ”, “MTS ”, “FTSE TMX ” and “FTSE Russell” and other service marksand trademarks related to the FTSE or Russell indexes are trade marks of the London Stock Exchange Group companies and are used by FTSE, MTS, FTSE TMXand Russell under licence. All information is provided for information purposes only. No responsibility or liability can be accepted by the London Stock ExchangeGroup companies nor its licensors for any errors or for any loss from use of this publication. Neither the London Stock Exchange Group companies nor any oftheir licensors make any claim, prediction, warranty or representation whatsoever, expressly or impliedly, either as to the results to be obtained from the use of theindex or the fitness or suitability of the index for any particular purpose to which it might be put.The funds or securities referred to herein are not sponsored, endorsed, or promoted by MSCI, and MSCI bears no liability with respect to any such funds orsecurities. The prospectus or the Statement of Additional Information contains a more detailed description of the limited relationship MSCI has with Vanguard andany related funds.The index is a product of S&P Dow Jones Indices LLC ("S&P DJI"), a division of S&P Global ("S&P"), or its affiliates, and has been licensed for use by Vanguard.S&P is a registered trademark of Standard & Poor’s Financial Services LLC, a division of S&P Global; Dow Jones is a registered trademark of Dow JonesTrademark Holdings LLC (“Dow Jones”); and these trademarks have been licensed for use by S&P DJI and sublicensed for certain purposes by Vanguard.Vanguard product(s) are not sponsored, endorsed, sold, or promoted by S&P DJI, Dow Jones, S&P, their respective affiliates, and none of such parties make anyrepresentation regarding the advisability of investing in such product(s), nor do they have any liability for any errors, omissions, or interruptions of the index.The Russell Indexes and Russell are registered trademarks of Russell Investments and have been licensed for use by The Vanguard Group. The products are notsponsored, endorsed, sold or promoted by Russell Investments and Russell Investments makes no representation regarding the advisability of investing in theproducts.CFA and Chartered Financial Analyst are registered trademarks owned by CFA Institute.“Dividend Achievers”is a trademark of The NASDAQ OMX Group, Inc. (collectively, with its affiliates, “NASDAQ OMX”) and has been licensed for use by TheVanguard Group, Inc. Vanguard mutual funds are not sponsored, endorsed, sold, or promoted by NASDAQ OMX and NASDAQ OMX makes no representationregarding the advisability of investing in the funds. NASDAQ OMX MAKES NO WARRANTIES AND BEARS NO LIABILITY WITH RESPECT TO THE VANGUARDMUTUAL FUNDS.BLOOMBERG is a trademark and service mark of Bloomberg Finance L.P. Bloomberg Finance L.P. and its affiliates, including Bloomberg Index Services Limited("BISL") (collectively, "Bloomberg"), or Bloomberg's licensors own all proprietary rights in the Bloomberg Indices.The products are not sponsored, endorsed, issued, sold or promoted by “Bloomberg.” Bloomberg makes no representation or warranty, express or implied, to theowners or purchasers of the products or any member of the public regarding the advisability of investing in securities generally or in the products particularly orthe ability of the Bloomberg Indices to track general bond market performance. Bloomberg shall not pass on the legality or suitability of the products with respectto any person or entity. Bloomberg’s only relationship to Vanguard and the products are the licensing of the Bloomberg Indices which are determined, composedand calculated by BISL without regard to Vanguard or the products or any owners or purchasers of the products. Bloomberg has no obligation to take the needs ofthe products or the owners of the products into consideration in determining, composing or calculating the Bloomberg Indices. Bloomberg shall not beresponsible for and has not participated in the determination of the timing of, prices at, or quantities of the products to be issued. Bloomberg shall not have anyobligation or liability in connection with the administration, marketing or trading of the products.Bloomberg Finance L.P. and its affiliates (collectively, “Bloomberg”) are not affiliated with Vanguard and do not approve, endorse, review, or recommendVanguard Commodity Strategy Fund. BLOOMBERG and the Bloomberg Commodity Index are trademarks or service marks of Bloomberg and have been licensed toVanguard. Bloomberg does not guarantee the timeliness, accurateness, or completeness of any data or information relating to the Bloomberg Commodity Index.The Global Industry Classification Standard ("GICS") was developed by and is the exclusive property and a service mark of MSCI Inc. ("MSCI") and Standard andPoor's, a division of McGraw-Hill Companies, Inc. ("S&P") and is licensed for use by Vanguard. Neither MSCI, S&P nor any third party involved in making orcompiling the GICS or any GICS classification makes any express or implied warranties or representations with respect to such standard or classification (or theresults to be obtained by the use thereof), and all such parties hereby expressly disclaim all warranties of originality, accuracy, completeness, merchantability orfitness for a particular purpose with respect to any such standard or classification. Without limiting any of the foregoing, in no event shall MSCI, S&P, any of itsaffiliates or any third party involved in making or compiling the GICS or any GICS classification have any liability for any direct, indirect, special, punitive,consequential or any other damages (including lost profits) even if notified of the possibility of such damages.CGS identifiers have been provided by CUSIP Global Services, managed on behalf of the American Bankers Association by Standard & Poor’s Financial Services,LLC, and are not for use or dissemination in a manner that would serve as a substitute for any CUSIP service. The CUSIP Database, 2022 American BankersAssociation. “CUSIP” is a registered trademark of the American Bankers Association.U.S. government backing of Treasury or agency securities applies only to the underlying securities and does not prevent share-price fluctuations. Unlike stocksand bonds, U.S. Treasury bills are guaranteed as to the timely payment of principal and interest.Investments in stocks or bonds issued by non-U.S. companies are subject to risks including country/regional risk and currency risk. These risks are especially highin emerging markets.Investments in Target Retirement Funds are subject to the risks of their underlying funds. The year in the Fund name refers to the approximate year (the targetdate) when an investor in the Fund would retire and leave the work force. The Fund will gradually shift its emphasis from more aggressive investments to moreconservative ones based on its target date. The Income Fund has a fixed investment allocation and is designed for investors who are already retired. Aninvestment in the Target Retirement Fund is not guaranteed at any time, including on or after the target date.Center for Research in Security Prices, LLC (CRSP ) and its third-party suppliers have exclusive proprietary rights in the CRSP Index Data, which has been licensedfor use by Vanguard but is and shall remain valuable intellectual property owned by, and/or licensed to, CRSP . The Vanguard Funds are not sponsored, endorsed,sold or promoted by CRSP , The University of Chicago, or The University of Chicago Booth School of Business and neither CRSP , The University of Chicago, orThe University of Chicago Booth School of Business, make any representation regarding the advisability of investing in the Vanguard Funds. 2022 The Vanguard Group, Inc. All rights reserved. Vanguard ETFs U.S. Patent No. 6,879,964.Vanguard Marketing Corporation, Distributor.
Vanguardfi Wellesley fiIncome Fund As of March 31, 2022 ProductSummary Balanced allocation: 60%Œ65% bonds, 35%Œ40% stocks. Seeks long-term growth of income, a high and sustainable level of current income, along with moderate long-term capital appreciation. Intermediate duration, investment-grade fixed income securities.