Transcription
Statistical Transparency of Policing ReportPer House Bill 2355 (2017)December 1, 2020Revised December 8, 2020Oregon Criminal Justice CommissionKenneth SanchagrinInterim Executive DirectorThe mission of the Oregon Criminal Justice Commission is to improve the legitimacy, efficiency, andeffectiveness of state and local criminal justice systems.
Authors and ContributorsKelly OfficerSiobhan McAlisterMichael WeinermanCourtney RauKatherine TallanOregon Criminal Justice Commission Researchers
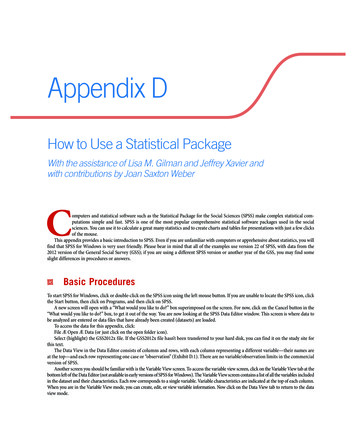
Executive SummaryHouse Bill 2355 (2017) mandated that by 2021, all Oregon law enforcement agencies must submit dataregarding officer initiated traffic and pedestrian stops to the Oregon Criminal Justice Commission, so theCommission could analyze the submitted data for evidence of racial or ethnic disparities on an annual basis.To accomplish these ends, the Commission, along with the Oregon State Police and the Oregon Department ofPublic Safety Standards and Training (DPSST), created the Oregon Statistical Transparency of Policing (STOP)Program. This is the second annual report to the Oregon Legislature by the STOP Program examining datareceived pursuant to HB 2355.Since the passage of HB 2355, the STOP Program developed a standardized method for data collection as wellas data collection software offered free of charge to all state law enforcement agencies. As of this time, theSTOP Program has received at least one full year of datafrom the fifty-one largest law enforcement agencies inTable E1.the state and analyses using those data are presented inDescriptive Statistics forthis report. In 2021, the STOP Program will report onAggregate Year 2 Stop Dataall Oregon police departments and sheriffs’ offices, asrequired by the Bill.VariableTier 1Tier 2Table E1 reports descriptive statistics for the combinedTraffic Stop97.8%95.6%Tier 1 and Tier 2 data contained in this report, whichRace/Ethnicityrepresents stops made from July 1, 2019 through JuneAsian/PI3.4%2.5%30, 2020. Across all agencies, the vast majority of theBlack5.6%3.1%reported data were for traffic stops, although the share ofLatinx12.9%11.3%traffic stops made by Tier 2 agencies was slightly lowerMiddle Eastern1.4%0.9%than their larger counterparts. The majority of stops inOregon involved white individuals, which, in and ofNative American0.6%0.4%itself, is not surprising given the demographic makeup ofWhite76.2%81.9%Oregon as a whole. Overall, a little over one-quarter ofGenderTier 1 stops and one-fifth of Tier 2 stops involved Asian/Male66.9%64.1%PI, Black, Latinx, Middle Eastern, or Native .1%Once the stop had been initiated, stopped individualsAgeeither were subject to no further action or merely givenUnder 2110.3%11.6%a warning in a little over 60 percent of stops. Other21 – 2924.0%22.2%outcomes, including receiving a citation or being arrested,varied widely across agencies and are discussed in detail30 – 3925.1%24.5%in the main body of the report. Finally, with regard to40 – 4917.1%17.2%searches, approximately 2.7percent of all stops resulted in50 and Older23.5%24.5%a search of some type.Stop DispositionTo examine the traffic and pedestrian stop data acquiredNone2.6%7.5%by the STOP Program for racial/ethnic disparities, STOPWarning57.1%57.2%Program researchers utilized three methods. The firstCitation37.6%32.9%method, which is used to examine the initial decision toJuvenile Summons0.0%0.0%stop an individual, was the Veil of Darkness AnalysisArrest2.7%2.4%(VOD). The VOD Analysis takes advantage of naturalvariations in daylight and darkness throughout the yearSearch Conducted2.6%2.8%and is based on the assumption that it is easier for an1Tier 1 & 2 Agencies 2020
Executive Summaryofficer to discern race/ethnicity during the day when it is light versus the night when it is dark. Accordingly,the VOD Analysis compares stop rates for minority individuals to those for white individuals during the timewindows surrounding sunrise and sunset. If, as demonstrated by the statistics that result from the VOD Analysis,minority individuals are more likely to be stopped in the daylight when race/ethnicity is easier to detect, thenthere would be evidence of a disparity.The second analytical method employed by the STOP Program is the Predicted Disposition Analysis, whichexamines matched groups using a statistical technique called propensity score analysis to explore whetherdisparities exist in stop outcomes (i.e., citations, searches, or arrests). If, after matching on all available datapoints in the stop data (e.g., time of day and day of the week the stop was made, reason for the stop, gender,age), minority individuals are either cited, searched, or arrested more often than similarly situated whiteindividuals, then there would be evidence of a disparity.Finally, the STOP Program utilized the KPT Hit-Rate Analysis, which compares relative rates of successfulsearches (i.e., those resulting in the seizure of contraband) across racial/ethnic groups. It is based on theassumption that if search decisions by officers are made based on race/ethnicity neutral criteria, then successrates should be similar, if not identical, across different racial/ethnic categories. If, however, search success ratesdiffer and the search success rates for minority individuals are significantly lower than those reported for whiteindividuals, then there would be evidence of a disparity.To determine if disparities identified in this report warrant additional in-depth analysis and/or technicalassistance from the Oregon Department of Public Safety Standards and Training (DPSST), STOP Programresearchers reviewed the results of each of the three analyses conducted on the STOP Program data. For eachindividual analysis, an estimated disparity must meet the 95 percent confidence level for it to be statisticallysignificant. Further, following best practices, for a law enforcement agency to be identified as one requiringfurther analysis as well as DPSST technical assistance, it must be identified as having a statistically significantdisparity in two of the three analytical tests performed on the STOP data.Using the above mentioned analyses and thresholds, the STOP Program identified one agency that hadstatistically significant results across two of the tests performed on the data: the Clackamas County Sheriff’sOffice. Specifically, results indicated that the Clackamas County Sheriff’s Office had disparities in the PredictedDisposition Analysis with regard to citation patterns involving Black and Latinx individuals and in the KPT HitRate with regard to searches of Latinx individuals. Thus, it is recommended that the Clackamas County Sheriff’sOffice be examined in greater detail by STOP Program researchers and receive technical assistance from DPSST.Tier 1 & 2 Agencies 20202
Table of Contents1. Background. 11.1. HB 2355 (2017). 12. Methodological Approach. 32.1. Background. 32.2. Oregon STOP Program Analyses. 32.3. Analytical Sample. 42.3.1. Data Elements. 42.3.2.Sample. 62.4. Threshold for Statistical Significance. 92.5. Limitations. 103. Characteristics of the Year 2 Stop Data. 113.1. General Characteristics . 113.2 COVID-19 Data Trends . 164. Veil of Darkness Analysis. 214.1.Aggregate Veil of Darkness Analysis for All Tier 1 Agencies . . 214.2.Agency-level Veil of Darkness Analysis . 234.3. Results for Stops in the Inter-Twilight Window . 245. Predicted Disposition Analysis. 265.1. Aggregate Predicted Disposition Results for All Agencies by Tier . 296. KPT Hit-Rate Analysis. 346.1 Aggregate KPT Hit-Rate Results for all Tier 1 Agencies . 346.2 Agency-level KPT Hit-Rate Results . 367. Findings from 2019-2020 Tier 1 and Tier 2 . . 397.1 Aggregate Findings . 397.2. Veil of Darkness Findings 2019-2020 . 397.3. Predicted Disposition Findings 2019-2020 . 407.3.1. Citations. 407.3.2. Searches . 403Tier 1 & 2 Agencies 2020
Table of Contents7.3.3. Arrests . 417.4. KPT Hit-Rate Findings 2019-2020 . 417.5. Conclusions Next Steps . 417.6. Next Steps and Future Work . 42Works Cited . 43AppendicesAppendix A – List of Law Enforcement Agencies by Tier. 45Tier 1. 45Tier 1. 45Tier 3. 46Appendix B - Data Audit. 47Appendix C – Veil of Darkness Technical Appendix and Detailed Results. 49Detailed Veil of Darkness Results . 51Appendix D – Predicted Disposition Technical Appendix and Detailed Results . 57Assumptions . 58Estimation . 59Limitations . 62Results . . 62Appendix E – KPT Hit-Rate Analysis Technical Appendix. 92Model and Assumptions . 92Hit-Rate and Significance Calculation . . 92Visualization . 93Limitations . 93Tier 1 & 2 Agencies 20204
Table of ContentsList of TablesTable 1.1. Three Tier Reporting Approach in HB 2355 (2017). 2Table 2.3.1.Sample Size Thresholds for Conducting Statistical Analyses. 6Table 2.3.2a. Race/Ethnicity Reporting by Tier 1 Agency for All Reported Stops. 7Table 2.3.2b. Race/Ethnicity Reporting by Tier 2 Agency for All Reported Stops. 8Table 2.4.1. Bonferroni Adjustment by Analysis . . 9Table 3.1.1a. Percent and Number of Tier 1 Agency Stops by Stop Type Traffic vs. Pedestrian. 11Table 3.1.1b. Percent and Number of Tier 2 Agency Stops by Stop Type Traffic vs. Pedestrian. 12Table 3.1.2. Aggregate Tier 1 Demographics by Stop Type. 13Table 3.1.3. Aggregate Tier 1 STOP Disposition by Stop Type. 15Table 3.1.4. Aggregate STOP Search Data, Year 2 Stops. 16Table 3.2.1. Stop Volume for Tier 1 Agencies in March, April, and May 2019 and 2020. 17Table 3.2.2. Tier 2 Agencies With the Greatest Drop in March 2020 Stops,Compared to February 2020. 18Table 4.1.1. Logistic Regression of Minority Status on Daylight forAll Tier 1 & 2 Agencies. 22Table 4.1.2 Logistic Regression of Minority Status on Daylight forAll Tier 1 & 2 Agencies Restricted to DST Window. 22Table 4.2.1 Logistic Regression of Minority Status on Daylight by Tier 1 Agency. 23Table 4.2.2 Logistic Regression of Minority Status on Daylight by Tier 2 Agency. 23Table 4.3.2 Results for Stops of Black Individuals - Tier 2. 24Table 4.3.1. Results for Stops of Black Individuals - Tier 1. 24Table 4.3.3. Results for Stops of Latinx Individuals - Tier 2. 25Table 5.0.1a Aggregate Tier 1 and Agency-level Stop Dispositions. 26Table 5.0.1b Aggregate Tier 1 and Agency-level Stop Dispositions. 27Table 5.0.2 Analyses Completed for Each Agency. 28Table 5.1.1 Predicted Disposition Analysis Results by Tier. 29Table 5.2.1. Predicted Disparity, Tier 1 Agencies, by Agency and Disposition(Statistically Significant Results) . . 31Table 5.2.2. Predicted Disparity, Tier 1 Agencies, by Agency and Disposition(Statistically Significant Results) . . 325Tier 1 & 2 Agencies 2020
Table of ContentsTable 6.1.2 Statewide Tier 1 (Not including OSP) Hit-Rates and Significance by Race/Ethnicity. 35Table 6.1.3. Statewide Tier 2 Hit-Rates and Significance by Race/Ethnicity. 35Table 6.1.1. Statewide Tier 1 Hit-Rates and Significance by Race/Ethnicity. 35Table 6.2.1 Statewide Hit-Rates and Significance by Agency and Race/Ethnicity. 36Table B.1 Missing Data for STOP Program Variables used in Year 2 Report Analyses. 47Table C.1 All Tier 1 Agencies VOD Results. 51Table C.2 All Tier 2 Agencies VOD Results. 51Table C.3 All Tier 1 Agencies Restricted to DST Window VOD Results. 52Table C.4 All Tier 2 Agencies Restricted to DST Window VOD Results. 52Table C.5 Black vs. White Traffic Stops, Agency VOD Results. 53Table C.6 Latinx vs. White Traffic Stops, Tier 1 Agency VOD Results. 53Table C.7 Latinx vs. White Traffic Stops, Tier 2 Agency VOD Results. 54Table C.8 Results for Stops of Black Individuals, Agency Results. 55Table C.9 Results for Stops of Latinx Individuals, Agency Results. 56Table D.1.1 Tier 1 - All. 63Table D.1.2 Tier 1 - No OSP. 64Table D.1.3 Tier 2 - All. 65Table D.1.4 Albany PD Results. 66Table D.1.5 Ashland PD Results. 66Table D.1.6 Beaverton PD Results. 67Table D.1.7 Bend PD Results. 67Table D.1.8 Benton Co SO Results. 68Table D.1.9 Canby PD Results. 68Table D.1.10 Central Point PD Results. 69Table D.1.11 Clackamas Co SO Results. 69Table D.1.12 Corvallis PD Results. 70Table D.1.13 Deschutes Co SO Results. 70Table D.1.14 Douglas Co SO Results. 71Table D.1.15 Eugene PD Results. 71Tier 1 & 2 Agencies 20206
Table of ContentsTable D.1.16 Forest Grove PD Results. 72Table D.1.17 Grants Pass DPS Results. 72Table D.1.18 Gresham PD Results. 73Table D.1.19 Hermiston PD Results. 73Table D.1.20 Hillsboro PD Results. 74Table D.1.21 Hood RIver Co SO Results. 74Table D.1.22 Jackson Co SO Results. 75Table D.1.23 Keizer PD Results. 75Table D.1.24 Klamath Co SO Results. 76Table D.1.25 Klamath Falls PD Results. 76Table D.1.26 Lake Oswego PD Results. 77Table D.1.27 Lane Co SO Results. 77Table D.1.28 Lebanon PD Results. 78Table D.1.29 Lincoln City PD Results. 78Table D.1.30 Lincoln Co SO Results. 79Table D.1.31 Linn Co SO Results. 79Table D.1.32 Marion Co SO Results. 80Table D.1.33 McMinnville PD Results. 80Table D.1.34 Medford PD Results. 81Table D.1.35 Milwaukie PD Results. 81Table D.1.36 Multnomah Co SO Results. 82Table D.1.37 Newberg-Dundee PD Results. 82Table D.1.38 OHSU PD Results. 83Table D.1.39 Oregon City PD Results. 83Table D.1.40 Oregon State Police Results. 84Table D.1.41 Polk Co SO Results. 84Table D.1.42 Port of Portland PD Results. 85Table D.1.43 Portland PB Results. 85Table D.1.44 Redmond PD Results. 867Tier 1 & 2 Agencies 2020
Table of ContentsTable D.1.45 Roseburg PD Results. 86Table D.1.46 Salem PD Results. 87Table D.1.47 Springfield PD Results. 87Table D.1.48 Tigard PD Results. 88Table D.1.49 Tualatin PD Results. 88Table D.1.50 U of O PD Results. 89Table D.1.51 Washington Co SO Results. 89Table D.1.52 West Linn PD Results. 90Table D.1.53 Woodburn PD Results. 90Table D.1.54 Yamhill Co SO Results. 91List of FiguresFigure 3.1.1. Traffic and Pedestrian Stops by Month of Year. 13Figure 3.1.2. Traffic and Pedestrian Stops by Time of Day. 14Figure 3.1.2a. Hourly Stops by Tier. 15Figure 3.2.1. Stops and Citations. 18Figure 3.2.2. Searches and Arrests. 19Figure 3.2.3. Stop Volume by Race. 19Figure 5.0.1. Hypothetical Representation of the Best Possible Comparisons White Group. 28Figure 6.2.1. Black KPT Hit-Rate Comparison. 37Figure 6.2.2. Latinx KPT Hit-Rate Comparison. 38Figure C1. Sample Statewide Distribution of Traffic Stops by Time and Day. 50Figure D1. Overlap Example. 58Figure D2. Weighting Example. 60Figure D3. Confounding Variable Balance Example. 61Figure E1. Stylized Example of Hit-Rate Visualization. 93Tier 1 & 2 Agencies 20208
1. BackgroundThis is the second annual report from the Statistical Transparency of Policing (STOP) Program. In 2017, theOregon Legislature mandated that by July 2021 all Oregon law enforcement agencies were to collect dataconcerning all officer initiated traffic and pedestrian stops. The mandate also required that the Oregon Criminal
regarding officer initiated traffic and pedestrian stops to the Oregon Criminal Justice Commission, so the Commission could analyze the submitted data for evidence of racial or ethnic disparities on an annual basis. To accomplish these ends, the Commission, along with the Oregon State Police and the Oregon Department of