Transcription
NEPHROLOGY ADVANCEDPRACTITIONER SALARYSURVEYAlexis Chettiar RN, MSN, ACNP-BC
No financial interests or conflicts of interest todisclose
Background CKD and ESRD are on the rise in the United states1 The number of medical graduates entering nephrology residencies isdeclining2– 43% of US nephrology residency programs don’t fill all spots in 20143 Nephrology APs work across practice settings Reimbursement systems unique to nephrology obscure AP revenuegeneration– Traditional measures of productivity don’t accurately represent APcontribution
Salary Survey Objectives Provide data APs can use to negotiate salary and benefits Define AP contribution to nephrology practice–Productivity, revenue generation, scope of practice Identify predictors of salary variation–Provider characteristics, practice setting, job scope Compare nephrology AP salaries to national AP salary averages Develop benchmark practice-setting specific standards ofproductivity Understand AP expectations of patient volume–Assess congruence between actual and expected practice volumeacross practice settings–Determine whether nephrology APs are over/underutilized in clinicalpractice relative to reported range of reasonable patient volume
Methods Original survey developed by Kim Zuber PA-C Survey has been administered three times previously overthe last six years Abbreviated survey developed with guidance from Dr. SusanChapman, an academic researcher experienced in surveydevelopment, administration and analysis IRB approval obtained from University of California SanFrancisco Survey was reviewed by a panel of nephrology APs for faceand content validity Data collected using Qualtrics survey tool Distributed to Nephrology Advanced Practitioners via professionalassociation listservs–PAs, Nurse Practitioners, Clinical Nurse Specialists
Methods Survey questions allow for free text to captureresponses outside of anticipated parameters Content included the following domains–Demographics–Productivity/workload (actual and high/low estimate of reasonablepatient volume across practice settings)–Scope of practice–Compensation (wage and benefits) Statistical analysis performed with STATA
Results 107 responses, 13 with partial missing data Average time for survey completion 10.1 minutes 89% of respondents are female 79% of respondents are Nurse Practitioners, 21% are PAs– 1 CNS respondent, grouped with NPs for analysis 84% of respondents are non-Hispanic white Mean age of respondents is 48
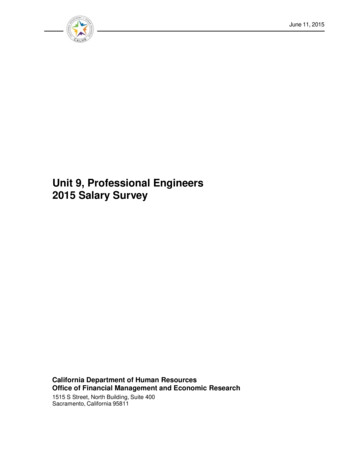
Respondent CharacteristicsYears Practicing 06.04.08.05Age304050age607001020Years Practicing in Nephrology30
ANOVA Table of Salary Means by Characteristics ofProvider and Practice (p)GenderFemalen 96103,363 (2288)Malen 11100,218 (6079)RaceNon- ‐Hisp White n 90 Minorityn 17103,540 (2084)99,454(9009)0.39(.5)ProviderTypeNPn 78103,546 (2581)PAn 27104,777 (3788)0.06(.8)AgeUpto35n 22100,317 (5482)35- ‐50n 28104,871 (3947) 50n 56102,230 (2790)0.29(.74)YearsinNephrology0- ‐5n 43100.939 (3856)6- ‐10n 32103,578 (4451) 10n 31105,416 (2238)0.39(.67)HRRCostQuintileLown 3298,955(3759)Highn 31103,525 (4001)PracticeSizeSmall(1- ‐5)n 18106,456 (5889)Med(6- ‐12)n 31101,897 (3757)0.21(.65)1.07(.31)Large( 12)n 2198,574 (4112)0.65(.5)
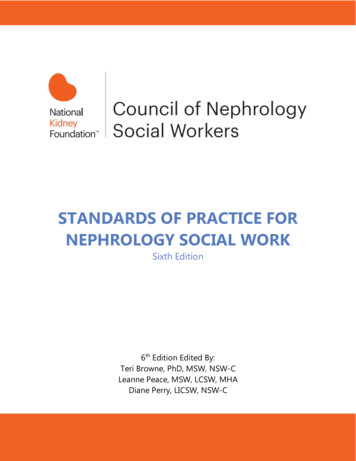
Dartmouth Atlas Hospital ReferralRegions Correlationbetween AP salaryand regionalmedical spending–Dartmouth Atlas hospitalreferral region (HRR)used to define spendingquintiles
Multivariable Regression Analysis of Salary PredictorsCharacteristic(ReferenceGroup)SalaryN 98βcoefficient(pvalue)Benefitsn 94βcoefficient(pvalue)SalaryandBenefitsn er(Female)2115(.78)- ‐680(.86)1436(.88)Age- ‐120(.54)- ‐26(.78)- ‐147(.54)Race(White)- ‐5097(.4)- ‐5898(.05)*- (.24)581(.18)F,R- PracticeSize- ‐463(.14)32(.79)- 5(.34)1941(.33)F,R- ialysisUnit- ‐10,535(.11)- ‐624(.83)- ‐11158(.15)On- ‐Call- ‐6241(.17)- ‐709(.74)- ‐6951(.2)HDUComprehensiveVisits- istration6005(.16)4779(.02)*10,784(.04)*F,R- ‐squared1.78,.1212.62,.1692.59,.167
Additional Practice SettingsReported Research (n 5)– 3 providers report participating in non-academic research Post-acute Rehab (n 2) Free clinic (n 1) Transplant (n 1) Tele-health (n 1) Occupational health (n 1)
Nephrology NP and PA Salaries Compared withNational AveragesNational PA salary 201495,820Nephrology PA salary104,776National NP salary 2014101,621Nephrology NP 00
Nephrology AP Compensation5%10%Salary 103,8604%Health insurance value 5159(for single coverage)Total paid time off 13,630(vacation, sicktime, holiday)81%Retirement benefit 5941(401k, 403b, pension)Total average annual compensation 128,590
Health Insurance Health insuranceHigh deductible health planEmployee contribution
Nephrology AP BenefitsCME REIMBURSEMENT94%PTO TO COMPLETE CME88%401K MATCH72%PENSION PLAN17%OTHER RETIREMENT PLAN27%ANY EMPLOYER SPONSORED RETIREMENT98%40%LIFE INSURANCE30%VACATION TIME73%PAID TIME OFF38%SICK TIME54%OTHER BENEFITS0%10%20%30%40%50%60%70%80%90%100%
Additional Benefits License renewal Phone Travel for conferences iPad Higher education tuitionsubsidy Lab coats Membership toprofessional organizations Pay for sick leave not taken Costco membership Journal and UpToDatesubscriptions Mileage Malpractice insurance Expense account Dental insurance Bonus Pay Disability insurance Car allowance
Nephrology AP Practice Settings/Job Scope85%71%53%31%30%23%Dialysis centerOfficeComprehensivevisits at HDUHospitalPeritoneal dialysisclinicCall20%Homehemodialysisclinic
Work HoursFull Time/Part Time Breakdown40 hours or greater32-39 hours 32 hours3%15%81% 73% of Nephrology AP FTEs work more than 40 hours per week Average number of hours/wk for FTEs (working 40 or hrs/wk) is 45.2
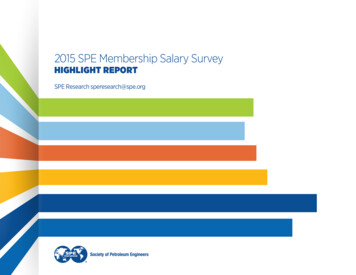
Actual and Ideal Number of Patients per Hour ArossPractice Settings1210Patients per hour86Ideal high meanActual mean 95%CI4Actual meanIdeal low mean20
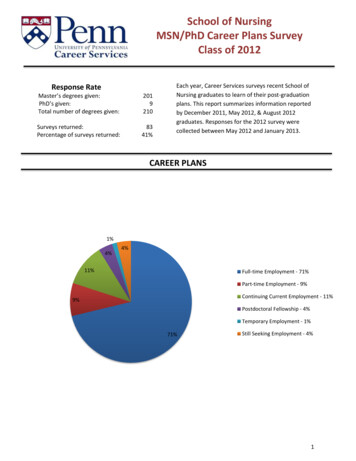
Ratio of Revenue Generated by Nephrology APs to NephrologyAP Employment Cost Across Practice Settings5Revenue to cost ratio atmean productivity4.543.53.93.53.332.7Revenue to cost ratio95%CI2.521.61.51Hemodialysis limitedvisitsHemodialysisHome hemo/peritonealcomprehensive visitsdialysis visitsOffice visitsHospital visitsRevenue generated by FT AP calculated in hospital, office and dialysis center settings based on average actual practice volumeand current national average Medicare reimbursement rates*Revenue adjusted for national average overhead costs in medical practice4*Salary adjusted for non-comp costs to employer (payroll taxes, benefits, etc)5
Limitations Self reported data Small sample size with wide geographic distribution– Represents a substantial proportion of nephrology APspracticing in the US HRR referral may not adequately control for regionalvariations in compensation Value of benefits estimated using Kaiser Family Foundationand Bureau of Labor Statistics data– May not accurately capture true benefit value Revenue generation projections are based on Medicarereimbursement– Actual revenue generated will vary based on case mix ofpatient population
Conclusions Non-Hispanic white race has a statistically significantassociation with higher value benefits and higher adjustedsalary Working in administration or hospital in hospital is associatedwith significant higher compensation (benefits,salary/benefits) Nephrology APs work in a wide range of practice settings Nephrology AP salaries are consistent with AP salariesnationwide The majority of APs have HDHP and/or pay for part of theirhealth insurance premiums
Conclusions Nephrology APs report that actual patient volume is on thelower end of their self-defined ‘reasonable range’ in mostpractice settings Nephrology APs can generate revenue up to 3x employmentcosts Reimbursement to employment cost ratio is highest fordialysis, lowest in the office setting Nephrology APs are a hard working bunch!
References[1] “Kidney Disease Statistics for the United States.” [Online]. cs-united-states.aspx.[Accessed: 26-Apr-2016].[2] M. U. Sharif, M. E. Elsayed, and A. G. Stack, “The global nephrologyworkforce: emerging threats and potential solutions!,” Clin. Kidney J.,vol. 9, no. 1, pp. 11–22, Feb. 2016.[3] AJKDblog, “Nephrology Workforce Crisis: Don’t Forget InternationalMedical Graduates (IMG),” AJKD Blog, 11-Dec-2014. .[4] “AANP - Employment Negotiations.” [Online]. ent/68articles/579employment-negotiations . [Accessed: 26-Apr-2016].[5] Hadzima, J. "How Much Does An Employee Cost ” Boston BusinessJournal, [Online]. DA86B-42C1-4131A07C-63A1F8049996/0/art33.pdf [Accessed: 26-Apr-2016] .
Questions?Comments?Suggestions for next yearssurvey .
Background CKD and ESRD are on the rise in the United states1 The number of medical graduates entering nephrology residencies is declining2 - 43% of US nephrology residency programs don't fill all spots in 20143 Nephrology APs work across practice settings