Transcription
Vocal Fatigue in Prospective Vocal Professionals*,1Supraja Anand, †,1Pasquale Bottalico, and ‡Camille Gray, *Tampa, Florida, yChampaign, Illinois, and zRobert Lee, TexasSummary: Objectives. The goals of the study were to (a) examine vocal fatigue in speech-language pathologystudents through subjective and objective measures following a novel 30-minute vocal loading task (VLT) and(b) evaluate the effects of psychosocial factors on vocal fatigue.Methods. Seventeen speech-language pathology students completed a 30-minute VLT using the LingWAVESsoftware program. In addition to maintaining target intensity goals during reading a text, participants were alsorequired to modify their pitch and voice quality. Vocal fatigue was measured subjectively using Vocal FatigueIndex and Borg vocal effort scale and objectively using variations of relative sound pressure level, fundamentalfrequency, pitch strength, smoothed cepstral peak prominence (CPPS), and acoustic voice quality index before,during, and after VLT. Participants provided information on their sleep quantity, stress, and depression throughnonstandardized and standardized surveys.Results. Results revealed that perceived effort and fatigue increased significantly after the 30-minute VLT.Acoustic measures of relative sound pressure level and fundamental frequency and increased systematically during and after the completion of task. All students were moderately stressed and measures related to pitch werehighly related with perceived stress.Conclusions. The results of this study provide support for altering multiple vocal parameters to induce measurable changes in vocal fatigue following a short-duration VLT.Key Words: Vocal fatigue Speech-Language Pathology (SLP) students Vocal loading Acoustics Psychosocial factors.INTRODUCTIONIt is estimated that between one-fourth and one-third of theworking population in the United States1,2 and across theworld3 rely heavily on their voice to perform their job duties.These “professional voice users” (eg, singers, theatre artists,teachers, lawyers, fitness instructors, telephone/call centeroperators, priests, and speech-language pathologists [SLPs])are often required to meet heavy vocal demands such as usingtheir voice for prolonged periods of time and/or using theirvoice that is not habitual in their everyday life. Prior researchalso highlighted nonoccupational voice use (between 4 and 10pm and weekends) in teachers and reported intensity levels tobe only slightly lower compared to occupational settings( 2.5 dB) and that such nonoccupational voice use couldaffect the already overloaded voice.4 Furthermore, professional voice users are often faced with environmental constraints such as poor room acoustics, humidity levels, andhigh ambient noise. Indeed, all these lifestyle factors makethem highly susceptible for developing voice disorders anddysphonia compared to the general population. For example,the prevalence of reporting a current voice problem washigher in teachers (11.0%) than in nonteachers (6.2%).5 Dysphonia in professional voice users can have significant negative impact on job performance, can lead to loss of wages dueAccepted for publication August 16, 2019.From the *Department of Communication Sciences and Disorders, University ofSouth Florida, Tampa, Florida; yDepartment of Speech and Hearing Science, University of Illinois Urbana-Champaign, Champaign, Illinois; and the zRobert Lee CareCenter, Robert Lee, Texas.1Equal contribution.Address correspondence and reprint requests to Supraja Anand, Department ofCommunication Sciences and Disorders, University of South Florida, Tampa, Florida33620. E-mail: suprajaanand@usf.eduJournal of Voice, Vol. 35, No. 2, pp. 247 2580892-1997 2019 The Voice Foundation. Published by Elsevier Inc. All rights 015to absenteeism or even loss of employment, and can subsequently result in poor quality of life.6,7Research on preprofessional voice usePreprofessional voice users, that is, students who are trainingto be in vocally demanding professions also experience vocaldemands similar to professional voice users (eg, multiple classpresentations/singing/theatre activities), often participate incommunity and social events that require talking, and mayalso have additional jobs that involve continuous or prolongedvoice use, yet there are limited number of research studies inthis population.8 These epidemiologic studies were largelyfocused on student teachers9 11 or singers.12,13 Their resultsshowed that 20% 30% of the trainees suffer from voice symptoms (eg, vocal fatigue) and disorders due to vocal misuse (eg,prolonged periods of voice use) and vocal abuse (eg, persistentthroat clearing). Similar to teachers and singers, SLPs are onegroup of professionals who extensively use their voice daily forproviding therapy and counseling among other tasks andrequire optimal voice quality to guide and model good targetsfor better treatment outcomes. Despite this significance, thereis minimal focus on this population both at professional andpreprofessional levels.14 17 Gottliebson et al (2007)15 reportedvoice problems among 12% of a total of 104 SLP students,and this percentage was similar to previous reports on teachers(11%) and was more common than the general population(3% 9%). Cross-sectional study involving 197 Dutch femaleSLPs from all four years of education (three undergraduateand one graduate) revealed that 93% of student SLPs reportedpresence of pain after speaking (71% sore throat) and manyhad problems with voice quality.17 The purpose of the currentstudy was to examine vocal fatigue in the understudied SLPstudents through an experimental vocal loading paradigm.
248Remainder of the introduction provides background information leading to experimental research questions.Overview of vocal fatigue and vocal loading tasksVocal fatigue has been commonly reported as one of thesymptoms in several voice disorders. Although a preciseand a universally accepted definition of vocal fatigue is currently lacking, it has been described as the negative vocaladaptation that occurs as a consequence of prolonged voiceuse.18 Clinicians have often described it as a feeling of vocaltiredness and weak voice after prolonged voice use.19 Furthermore, vocal fatigue has been generally identified through multiple symptoms including perception of increased vocal effortand discomfort, reduced pitch range and flexibility, reducedvocal projection or power, reduced control of voice quality,increase in symptoms across the speaking day, and improvement in symptoms after a period of rest.7 Given the nature ofextreme vocal demands of professional voice users, it is notsurprising that they are significantly more likely to havesymptoms of vocal fatigue, for example.13,20,21 Indeed, Royet al (2004) reported that teachers were significantly morelikely than nonteachers to have experienced symptoms ofhoarseness, discomfort, and increased effort while using theirvoice, tiring or experiencing a change in voice quality aftershort use, and difficulty projecting their voice. Vocal fatiguehas been extensively studied in naturalistic22 25 or in laboratory26 30 settings. Specifically, in the laboratory, vocal fatiguehas been induced through different types of stressors and/orvocal loading tasks (VLTs). For example, external stressorssuch as room acoustics and background noise31 33 and internal stressors such as duration and type of the speaking taskhave been varied.23,26 28,34,35 Among these studies elevatedintensity and prolonged duration of the speaking task havebeen most commonly used in VLTs to induce vocal fatigue.Effects of sleep, depression, and stress on vocalhealth and functionThe World Health Organization sees health as a multidimensional state of being that encompasses physical, mental, andsocial conditions.36 By extension, vocal health can also be considered multifactorial that may be influenced by vocal loading(eg, prolonged or intensive voice use), physical factors (eg,poor body posture, respiratory allergies, and poor sleep behaviors), environmental factors (eg, dust and humidity), psychological/emotional factors (eg, anxiety, stress, and depression),and personality (eg, neuroticism, extraversion, and psychoticism). Indeed, prior research has indicated that voice symptoms/disorders can be exacerbated by psychological factorssuch as stress and personality, for example.37 Regarding sleep,in young adults, sleep deficiency in terms of quantity and quality, resulted in poor self- and listener-perceptions, reduced fundamental frequency (f0), and higher scores on voice handicapindex. Listeners perceived voices to sound more tired and poorin voice quality.38,39 Moreover, sleep quality was also betterrelated to overall health (including feelings of tension, depression, and anger) and satisfaction with life.40 RegardingJournal of Voice, Vol. 35, No. 2, 2021depression, Marmor et al (2016)41 examined the associationbetween depression and voice problems based on 2012National Health Interview Survey data. Young adultsbetween the ages of 18 and 30 reported to have more voiceproblems in the past year compared to other age groupsincluded in the study. Furthermore, the presence of depressivesymptoms was associated with nearly 2-fold increase in thelikelihood of reporting a voice problem. Regarding stress,research has been conducted on teachers,42 young adults,43and college students44 including those from SLP program.44Adults with hypertension were 42% more likely to reportvoice disorders and adults with a history of mood disordersreported more voice disorders than overall population (9.9%for anxiety/panic disorder and 9.2% for depression). Study byFerreira et al (2012)44 showed that vocal fatigue was significantly related to with intense voice use, stress, and digestiveproblems in a prospective survey study of 517 students. Perceived stress evaluated through Perceived Stress Scale, PSS45and electrophysiology (measures of heart rate and heart ratevariability) revealed higher stress levels prior to mindfulnesstraining. It is likely that stress for SLP students stems fromboth academic and clinical demands.Research questionsStudents training to be future vocal professionals frequentlyexhibit symptoms of vocal fatigue and could potentially be ata high risk for developing voice disorders. To our knowledge,only a limited number of studies have examined vocal fatiguein SLP students and these studies were mostly based on questionnaires/surveys. Therefore, the primary goal of the currentstudy was to examine vocal fatigue in SLP students throughan experimental vocal loading paradigm. Prior studies onvocal loading have largely focused on speaking at a highintensity level for durations of approximately 2 hours.46 Thecurrent study tested a novel VLT paradigm that required students to alter/modify a combination of three vocal parameters; intensity, f0, and voice quality for a relatively shorterduration (30 minutes). Such a task may potentially be usefulin clinical settings where time constraints do not allow clinicians to obtain a true picture of the habitual voice use specifically in professional/preprofessional voice users. Majority ofthe research on vocal fatigue have examined the tasks andoutcome measures in general population and professionalvoice users but have failed to examine the effects of physical/psychological factors such as sleep, depression, stress, andgeneralized fatigue adequately. Given the significance of theeffects of underlying physical/psychological factors on vocalsymptoms/fatigue especially in professional/preprofessionalvoice users, the secondary goal of this study was to investigate/determine this missing relationship.METHODSParticipantsA total of 28 students (undergraduate and graduate) majoringin SLP and music completed an initial Qualtrics questionnaire.
Supraja Anand, et alVocal Fatigue in Prospective Vocal ProfessionalsAll students were expected to meet the following inclusionarycriteria: native speakers of American English, between 18 and35 years of age, and absence of comorbid health conditionsaffecting respiration and voice. Exclusionary criteria includedstudents with history of smoking, chronic alcohol use, recentupper respiratory infections, asthma or other respiratory disorders, or self-reported reflux disease. Of these, 23 students fit allthe criteria and 17 (16 SLPs and one music) completed thevocal loading task in the laboratory. All participants werefemale and ranged between 22 and 24 years of age. All studyprocedures were approved by the Institutional Review Boardat the University of South Florida. All participants consentedto participation and were compensated for their participation.Speech stimuli and tasksAll participants completed 3 trials of sustained /a/ phonationfor 5 6 seconds and read “The Rainbow Passage”47 preand post-VLT. The VLT was accomplished by adapting theVocal Loading Test module/protocol from LingWAVESsoftware program (Version 3.0; Wevosys, 2014). All participants read text from Charlotte’s Web by White andWilliams48 for the duration of VLT. The VLT module inLingWAVES required participants to alternate vocal intensity every 5 minutes between two predetermined levels (“lowload” and “high load”) for a total duration of 30 minutes.Thus, there were six 5-minute intervals, 3 with low-load and3 with high-load conditions. Throughout the task, the software indicated if the participants fell below the desired dBsound pressure level (SPL) goals using a large arrow on thecomputer screen. Recordings were made at 50 cm mic-tomouth distance in a sound booth. In this study, two novelmodifications were made to the VLT. First, the intensitylevel for high-load condition was customized to each participant’s baseline SPL and was set at High load dB SPL ¼Low load dB SPL þ ðLow load dB SPL x 0:15Þ. The current study chose the addition of 15% increase as “ideal” basedon pilot testing by 2 of the authors with levels varied between10% and 20%. At 10%, there was consensus (subjectiveimpression) that the high-load condition did not stress thevocal mechanism adequately to induce fatigue. At 20%, therewas consensus that the high-load condition may potentiallyrisk a vocal injury given that participants were required to sustain it for a relatively long duration. In addition, the 20%increase may also be too high depending on a participant’sbaseline/low-load dB level. For example, a low-load level of72 dB will result in a high-load level of 83 dB as per the equation above. Indeed, prior studies on vocal fatigue havereported maximum levels between 75 and 85 dB.46 The intensity level for the low-load condition was the baseline readingSPL for each participant. Second, in addition to varying theirintensity, participants were instructed to vary their f0 andvoice quality by mimicking the voices of famous cartoon characters of “Minnie Mouse” and “Mufasa” during the low-loadand high-load conditions, respectively. All participants knewthat they were participating in an experiment on vocal fatigue,however, VLT procedure and specific outcomes/observationswere not specifically emphasized.249Evaluation of vocal fatigue and effortVocal fatigue was evaluated objectively using acousticmeasures of SPL, f0, pitch strength (PS), smoothed cepstralpeak prominence (CPPS), and the Acoustic Voice QualityIndex (AVQI) from the pre- and post-vowel and speechtasks. The average among all SPL values was computed perparticipant, and this mean was subtracted from each SPLvalue performed by that participant. This within-subjectcentering was performed in order to evaluate the variationin the participant’s vocal behavior in the different conditions from the “mean” vocal behavior and to reduce the variance among participants. After transformation, themeasure was termed DSPL. For each recording (pre- andpost-VLT; vowel and speech) and acoustic measure, average/mean and standard deviations were calculated. Measures of f0, SPL, and PS were computed in MATLAB(Version 2017a; MathWorks, Natick, MA) and measures ofCPPS, and AVQI were computed in PRAAT software (Version 6.0.13).49 PS refers to saliency of pitch sensation andwas selected due to its proven relationship with voice qualitydimensions (eg, breathiness).50,51 Computational estimatesof PS were extracted from a sawtooth waveform-inspiredpitch estimator with auditory front-end (Aud-SWIPEʹ).52 Adetailed description of the computation can be reviewed inCamacho.52 CPPS provided the magnitude of the cepstralpeak relative to the amplitude of phonation.53 The AVQI isa multivariable model based on acoustic measures that permitted the objective assessment of overall dysphonia severity using sustained vowel and continuous speech.54 Toderive the AVQI, a weighted combination of six acousticmeasures were modeled in a linear regression formula.Measures were representative of time (shimmer local, shimmer local dB, and harmonics-to-noise ratio), frequency(general slope of the spectrum and tilt of the regression linethrough the spectrum) and quefrency domain (CPPS).55Vocal fatigue was evaluated subjectively using the VocalFatigue Index (VFI)56 pre- and post-VLT. Participants alsocompleted the adapted Borg CR10 physical exertion scale57after VLT. Performance during the VLT was measuredusing the same set of acoustic measures, except for AVQI.Evaluation of sleep, depression, and stressAmount of sleep (average number of hours/night) was evaluated through a question on the Qualtrics survey. Depression was evaluated through 21 questions on the BeckDepression Inventory58 and perceived stress was evaluatedthrough 10 questions on the PSS.Statistical analysesLinear mixed models (LMEs) fit by restricted maximumlikelihood (REML) were built using lme459 and lmerTest60packages. The model output included estimates of fixedeffects coefficients, standard error associated with the estimate, degrees of freedom, df, the test statistic, t and the Pvalue. Estimates and standard deviations of fixed effectsrepresent the values of the regression coefficients associatedwith each factor of interest included in the model and their
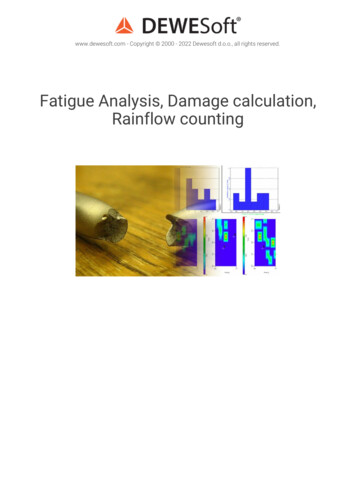
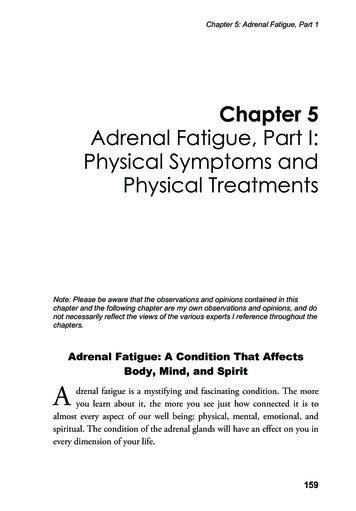
250Journal of Voice, Vol. 35, No. 2, 2021standard deviation. The Satterthwaite method61 was used toapproximate degrees of freedom and calculate P values. Allstatistical analyses were completed using R software (Version 3.1.2).62 Such LMEs have also been used in prior vocalfatigue31 and vocal effort63 studies.A series of LMEs were fitted by REML for each of theacoustic measures as the response variables, with task asthe fixed factor (pre- and post-VLT) and their interaction, andthe participant as the random effects term. The reference levelswere vowel for the task and pre-condition for the VLT. Inaddition, VFI was evaluated as an additional fixed factoralong with task (pre- and post-VLT) and paired t tests werealso performed to evaluate the change in VFI performanceand pain scores pre- and post-VLT. Furthermore, LMEmodel was fitted by REML for each of the response variableswith task as a fixed factor (pre- and post- VLT) and stressindex (overall PSS score) from participants as a random effect.RESULTSComparison of acoustic measures pre- and post-VLTTable 1 represents a summary table with multiple LMEmodels fit by REML for each of the response variables(DSPL, f0, f0 standard deviation, PS, CPPS, and AVQI).Figures 1 6 represent mean and the standard error of eachof the response variables measured pre- and post-VLT forvowel and connected speech stimuli. The values on all thefigures represent raw data and these could be slightly different than the values of the model output in which we considered participants as random factor.1. Delta sound pressure level (ΔSPL, dB): The estimateof standard deviations for random effect participantwas 0 (because of the within-subject centering), whilethe residual standard deviation was 3.11. ΔSPL was10.56 dB higher in vowel compared to connectedspeech. For both vowel and connected speech, ΔSPLincreased by 4.22 dB post-VLT. The SPL standarddeviation did not change significantly between thestimuli and pre- and post-VLT.2. Fundamental frequency (f0, Hz): The estimate of standard deviations for random effect participant was12.13, while the residual standard deviation was 14.58.f0 was 27.44 Hz higher in connected speech comparedto vowel. For both vowel and connected speech, f0increased to 8.62 Hz post-VLT.TABLE 1.A Summary Table Depicting Multiple LME Models Fit by REML for All Response Variables With Task as the Fixed Factor(pre/post VLT) and Their Interaction, and the Participant as the Random Effects Term. The Reference Levels were Vowelfor the Task and Pre-condition for the VLTFixed Factors1. ΔSPL (dB)(Intercept)Task speechPre/post VLT POSTTask speech: Pre/post VLT POST2. f0 (Hz)(Intercept)Task speechPre/post VLT POSTTask speech: Pre/post VLT POST3. f0 standard deviation (Hz)(Intercept)Pre/post VLT POST4. PS (-)(Intercept)Task speechPre/post VLT POSTTask speech: Pre/Post VLT POST5. CPPS (dB)(Intercept)Pre/post VLT POST6. AVQI (-)(Intercept)Pre/post VLT POSTEstimateStd. ErrordftP0.58 10.564.22 0.940.450.960.621.251321321321321.29 11.736.74 0.750.200 0.001*** 0.001***0.454200.027.48.6 4.03.64.23.05.926.8114.5115.7114.555.06.52.9 0.7 0.001***0.004** 0.001***0.500105.8 10.41.92.3311756.4 4.6 0.001*** 0.001***0.46 0.030.05 0.030.010.010.010.012811511611542.47 2.455.41 1.74 0.001***0.015* 0.001***0.08316.591.100.450.52311736.852.12 0.001***0.049*3.66 0.500.150.11231623.87 4.39 0.001*** 0.001***Abbreviations: AVQI, Acoustic Voice Quality Index; CPPS, smoothed cepstral peak prominence; dB, decibel; f0, fundamental frequency; Hz, Hertz; PS, pitchstrength; SPL, sound pressure level.Significance codes: ’’***’’ 0.001 ’’**’’ 0.01 ’’*’’ 0.05 ’’.’’ 0.1
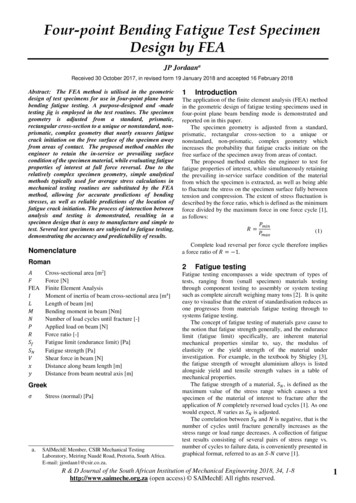
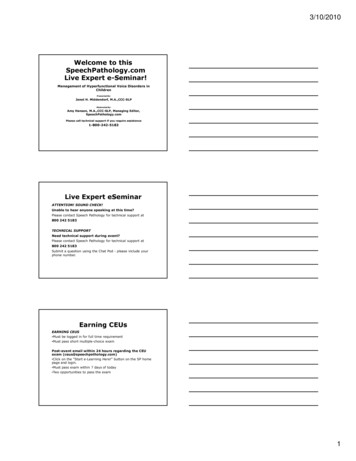
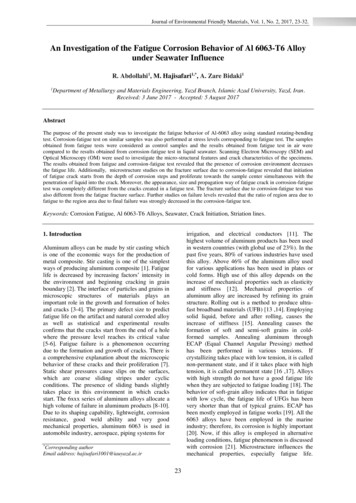
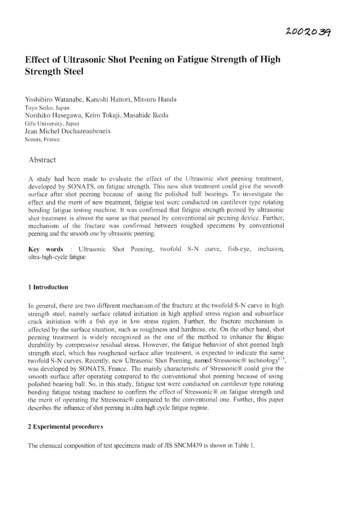
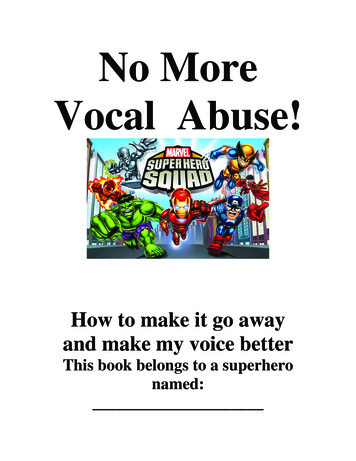
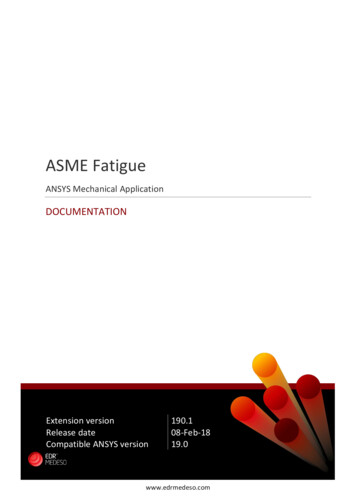
Supraja Anand, et alVocal Fatigue in Prospective Vocal Professionals251FIGURE 1. Mean and the standard error (SE) of the relativeFIGURE 3. Mean and the standard error (SE) of fundamentalsound pressure level (ΔSPL) measured pre- and post-vocal loadingtask (VLT) for vowel and connected speech stimuli.frequency standard deviation (f0 SD) pre- and post-vocal loadingtask (VLT) for vowel and connected speech stimuli.3. f0 Standard deviation: Unlike f0, f0 standard deviationdecreased significantly to 10.35 Hz post-VLT in connected speech.4. Pitch strength (PS): The estimate of standard deviations for random effect participant was 0.04 and theresidual standard deviation was also 0.04. PS waslower by a small magnitude (0.03) in connected speechcompared to vowel. For both vowel and connectedspeech, PS increased by a magnitude of 0.05 post-VLT.5. Smoothed cepstral peak prominence (CPPS, dB):There was a significant increase in CPPS (1.10 dB)post-VLT only for the connected speech.6. Acoustic Voice Quality Index (AVQI): The AVQI wascalculated combining vowel and connected speechstimuli. The estimate of standard deviations for random effect participant was 0.53, while the residualstandard deviation was 0.32. AVQI decreased by amagnitude of 0.50 post-VLT.Vocal Fatigue IndexResults of the LME analysis revealed that the associationsbetween the aforementioned acoustic measures of voice andthe VFI scores were not statistically significant (P 0.05).FIGURE 2. Mean and the standard error (SE) of fundamentalFIGURE 4. Mean and the standard error (SE) of the pitchfrequency (f0) pre- and post-vocal loading task (VLT) for voweland connected speech stimuli.strength (PS) measured pre- and post-vocal loading task (VLT) forvowel and connected speech stimuli.
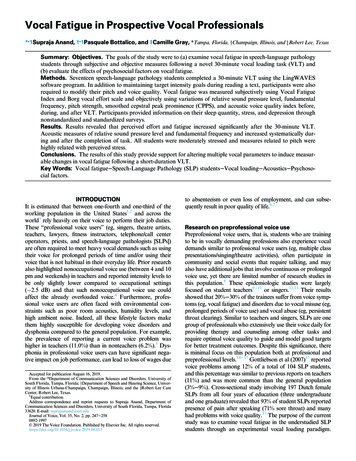
252Journal of Voice, Vol. 35, No. 2, 2021FIGURE 5. Mean and the standard error (SE) of the smoothedcepstral peak prominence (CPPS) measured pre- and post-vocalloading task (VLT) for vowel and connected speech stimuli.Although a significant relationship was not observed, mean§ standard error VFI scores on the three categories namelygeneral tiredness of voice (performance), physical discomfort associated with voicing (pain), and improvement ofsymptoms with rest (recovery) were inspected pre- and postVLT. For pre-VLT, mean scores (averaged across 17 participants) on performance, pain, and recovery, were 8.22 §2.32, 2.28 § 0.92, and 5.63 § 1.15, respectively. For postVLT, mean scores (averaged across 17 participants) on performance, pain, and recovery, were 14.73 § 2.96, 5.18 §1.23, and 6.63 § 1.32, respectively. After checking the normal distribution of the data, a set of paired-samples t testswas conducted to compare VFI performance and painscores in pre- and post-VLT conditions. There was a significant increase in performance (t[16] 3.980, P 0.001)and pain (t[16] 3.785, P 0.002) scores post-VLT.While, an increase in mean score in first and second category indicates greater fatigue (poor vocal performance andelevated pain), an increased mean score in third categoryindicates lower severity (greater improvement after rest).Given that the focus of the current study was to evaluatevocal fatigue after VLT, scores have been reported per category and statistical analyses were conducted on first two categories. Similar reporting of sub-category VFI scores canalso be found in Banks et al (2017).64Performance during VLTAn additional set of linear mixed effect models were fittedby REML for the response variables ΔSPL and f0 with time,vocal load (low vs high) as the fixed factors and their interaction, and the participant as the random effects term. Thereference level for the vocal load factor was low.FIGURE 6. Mean and the standard error (SE) of the acousticvoice quality index (AVQI) measured pre- and post-vocal loadingtask (VLT).Delta sound pressure level (ΔSPL, dB)The model output is reported in Table 2. The estimate ofstandard deviations for random effect participant was 0.61,while the residual standard deviation was 11.89. In bothvocal load conditions, ΔSPL increased with time, howeverthe slope of the increase was higher in the low-load condition. As per the task requirement/instructions SPL was3.24 dB higher in the high-load compared to the low-vocalload task condition. Figure 7 shows the ΔSPL values averaged across all the participants over the total duration ofTABLE 2.LME Model Fit by REML for the Response Variable DSPL During the Vocal Loading Task (VLT)Fixed factorsEstimateStd. ErrordftP(Intercept)TimeVLT highTime: VLT high 1.160.00193.24 0.00050.160.000.200.0013273403273402273402 7.1629.1033.99 5.19 0.001*** 0.001*** 0.001*** 0.001***Significance codes: ’’***’’ 0.001 ’’**’’ 0.01 ’’*’’ 0.05 ’’.’’ 0.1
Supraja Anand, et al253Vocal Fatigue in Prospective Vocal ProfessionalsFIGURE 7. Mean relative the sound pressure level (ΔSPL) forlow and high-load conditions over the total duration of the vocalloading task (VLT).FIGURE 8. Mean fundamental frequency (f0) for low and highload conditions over the total duration of the vocal loading task(VLT).the VLT (30 minutes), and two linear models for two conditions: high and low vocal load.minimum and maximum values. There were negligibledifferences in PS and CPPS over time in the VLT.Therefore, values were averaged across the load conditions and only the descriptive statistics on the load conditions are provided in Figure 9.Fundamental frequency (f0)The model output is reported in Table 3. The estimate ofstandard deviations for random effect participant was30.86, while the residual standard deviation was 0.001. Inboth vocal load conditions, f0 increased with time, howeverthe slope of the increase was higher in the low-load condition. As per the task requirement/instructions, f0 was 50 Hzhigher in the low-load compared to the high vocal load condition. Figure 8 shows f0 values averaged across all the participants over the total duration of the VLT (30 minutes),and two linear models for two conditions: high and lowvocal load.Pitch strength (PS) and smoothed cepstral peakprominence (CPPS)Figure 9 shows PS (left) and CPPS (right) values averagedacross all the participants for low and high-load conditions. The box plots depict 25th percentile, median, 75thpercentile, and the whiskers of the box plots depictEffects of sleep, depression, and stress on vocalfatigueAll but one participant reported to sleep between 6 and10 hours. Overall depression score ranged from 0 to 7 with amean of 1.77 for 13/17 participants. This score ranged from19 to 27 for the remaining four participants with a mean of21.5. Given that there was a limited distribution of the sleepand depression scores, further analysis was not plausible.Overall PS scores ranged between 16 and 25 (mean of 20)indicating moderate stress among participants. LME modeloutputs revealed statistically significant associationsbetween stress index and measures related to pitch, independently by the type of stimuli (vowel or speech) and by theVLT. As shown in Figure 10, participants with higher stressindex showed higher f0 (P 0.030) and smaller f0 standarddeviation (P 0.005) and higher values of PS (P 0.017).TABLE 3.LME Model Fit by REML for the Response Variable f0 During the Vocal Loading Task (VLT)Fixed factors(Intercept)TimeVLT highTime: VLT highEstimateStd. 02928402928402946.4828.08 62.23 7.66 0.001*** 0.001*** 0.001*** 0.001***Significance codes: ’’***” 0.001 ’’**’’ 0.01 ’’*’’ 0.05 ’’.’’ 0.1
254Journal of Voice, Vol. 35, No. 2, 2021measures conducted before, during, and after the VLT. Ourresults demonstrate measurable changes in most of theacoustic measures during and post-VLT task. SubjectiveVFI scores on performance and pain categories significantlyincreased post-VLT indicating that VLT did elicit sensations of vocal fatigue. Furthermore, 15 participants reportedsevere (N 7; values of 5 or 6) and very severe (N 8; values of 7 or 8) perceived vocal effort on the Borg scale postVLT. A secondary goal of the study was to determine theeffects of sleep, depression, and stress on measures of vocalfatigue. Participants with higher stress level showed anincrease in f0 and a decrease in f0
Key Words: Vocal fatigue Speech-Language Pathology (SLP) students Vocal loading Acoustics Psychoso-cial factors. INTRODUCTION It is estimated that between one-fourth and one-third of the working population in the United States1,2 and across the world3 rely heavily on their voice to perform their job duties.