Transcription
Wasserstein Learning of Deep Generative PointProcess ModelsShuai Xiao † , Mehrdad Farajtabar Xiaojing Ye‡ , Junchi Yan§ , Le Song ¶, Hongyuan Zha †Shanghai Jiao Tong University College of Computing, Georgia Institute of Technology‡School of Mathematics, Georgia State University§IBM Research – China¶Ant Financialbenjaminforever@sjtu.edu.cn, mehrdad@gatech.eduxye@gsu.edu, oint processes are becoming very popular in modeling asynchronous sequentialdata due to their sound mathematical foundation and strength in modeling a varietyof real-world phenomena. Currently, they are often characterized via intensityfunction which limits model’s expressiveness due to unrealistic assumptions onits parametric form used in practice. Furthermore, they are learned via maximumlikelihood approach which is prone to failure in multi-modal distributions ofsequences. In this paper, we propose an intensity-free approach for point processesmodeling that transforms nuisance processes to a target one. Furthermore, we trainthe model using a likelihood-free leveraging Wasserstein distance between pointprocesses. Experiments on various synthetic and real-world data substantiate thesuperiority of the proposed point process model over conventional ones.1IntroductionEvent sequences are ubiquitous in areas such as e-commerce, social networks, and health informatics.For example, events in e-commerce are the times a customer purchases a product from an onlinevendor such as Amazon. In social networks, event sequences are the times a user signs on orgenerates posts, clicks, and likes. In health informatics, events can be the times when a patientexhibits symptoms or receives treatments. Bidding and asking orders also comprise events in thestock market. In all of these applications, understanding and predicting user behaviors exhibited bythe event dynamics are of great practical, economic, and societal interest.Temporal point processes [1] is an effective mathematical tool for modeling events data. It hasbeen applied to sequences arising from social networks [2, 3, 4], electronic health records [5], ecommerce [6], and finance [7]. A temporal point process is a random process whose realizationconsists of a list of discrete events localized in (continuous) time. The point process representation ofsequence data is fundamentally different from the discrete time representation typically used in timeseries analysis. It directly models the time period between events as random variables, and allowstemporal events to be modeled accurately, without requiring the choice of a time window to aggregateevents, which may cause discretization errors. Moreover, it has a remarkably extensive theoreticalfoundation [8]. Authors contributed equally. Work completed at Georgia Tech.31st Conference on Neural Information Processing Systems (NIPS 2017), Long Beach, CA, USA.
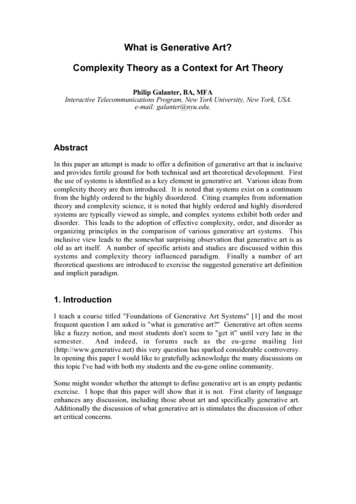
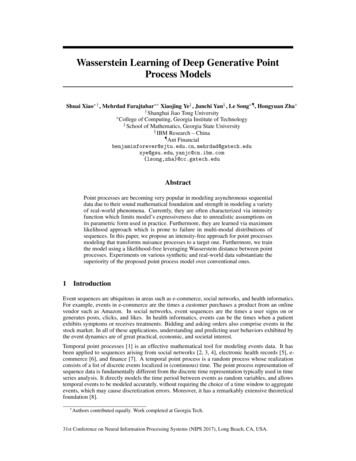
However, conventional point process models often make strong unrealistic assumptions about thegenerative processes of the event sequences. In fact, a point process is characterized by its conditionalintensity function – a stochastic model for the time of the next event given all the times of previousevents. The functional form of the intensity is often designed to capture the phenomena of interests [9].Some examples are homogeneous and non-homogeneous Poisson processes [10], self-exciting pointprocesses [11], self-correcting point process models [12], and survival processes [8]. Unfortunately,they make various parametric assumptions about the latent dynamics governing the generation of theobserved point patterns. As a consequence, model misspecification can cause significantly degradedperformance using point process models, which is also shown by our experimental results later.To address the aforementioned problem, the authors in [13, 14, 15] propose to learn a generalrepresentation of the underlying dynamics from the event history without assuming a fixed parametricform in advance. The intensity function of the temporal point process is viewed as a nonlinear functionof the history of the process and is parameterized using a recurrent neural network. Attenionalmechanism is explored to discover the underlying structure [16]. Apparently this line of work stillrelies on explicit modeling of the intensity function. However, in many tasks such as data generationor event prediction, knowledge of the whole intensity function is unnecessary. On the other hand,sampling sequences from intensity-based models is usually performed via a thinning algorithm [17],which is computationally expensive; many sample events might be rejected because of the rejectionstep, especially when the intensity exhibits high variation. More importantly, most of the methodsbased on intensity function are trained by maximizing log likelihood or a lower bound on it. Theyare asymptotically equivalent to minimizing the Kullback-Leibler (KL) divergence between the dataand model distributions, which suffers serious issues such as mode dropping [18, 19]. Alternatively,Generative Adversarial Networks (GAN) [20] have proven to be a promising alternative to traditionalmaximum likelihood approaches [21, 22].In this paper, for the first time, we bypass the intensity-based modeling and likelihood-based estimation of temporal point processes and propose a neural network-based model with a generativeadversarial learning scheme for point processes. In GANs, two models are used to solve a minimaxgame: a generator which samples synthetic data from the model, and a discriminator which classifies the data as real or synthetic. Theoretically speaking, these models are capable of modelingan arbitrarily complex probability distribution, including distributions over discrete events. Theyachieve state-of-the-art results on a variety of generative tasks such as image generation, imagesuper-resolution, 3D object generation, and video prediction [23, 24].The original GAN in [20] minimizes the Jensen-Shannon (JS) and is regarded as highly unstable andprone to miss modes. Recently, Wasserstein GAN (WGAN) [25] is proposed to use the Earth Movingdistance (EM) as an objective for training GANs. Furthermore it is shown that the EM objective, asa metric between probability distributions [26] has many advantages as the loss function correlateswith the quality of the generated samples and reduces mode dropping [27]. Moreover, it leveragesthe geometry of the space of event sequences in terms of their distance, which is not the case for anMLE-based approach. In this paper we extend the notion of WGAN for temporal point processesand adopt a Recurrent Neural Network (RNN) for training. Importantly, we are able to demonstratethat Wasserstein distance training of RNN point process models outperforms the same architecturetrained using MLE.In a nutshell, the contributions of the paper are: i) We propose the first intensity-free generative modelfor point processes and introduce the first (to our best knowledge) likelihood-free correspondinglearning methods; ii) We extend WGAN for point processes with Recurrent Neural Network architecture for sequence generation learning; iii) In contrast to the usual subjective measures of evaluatingGANs we use a statistical and a quantitative measure to compare the performance of the model tothe conventional ones. iv) Extensive experiments involving various types of point processes on bothsynthetic and real datasets show the promising performance of our approach.2Proposed FrameworkIn this section, we define Point Processes in a way that is suitable to be combined with the WGANs.2.1 Point ProcessesLet S be a compact space equipped with a Borel σ-algebra B. Take Ξ as the set of counting measureson S with C as the smallest σ-algebra on it. Let (Ω, F, P) be a probability space. A point processon S is a measurable map ξ : Ω Ξ from the probability space (Ω, F, P) to the measurable space(Ξ, C). Figure 1-a illustrates this mapping.2
PnEvery realization of a point process ξ can be written as ξ i 1 δXi where δ is the Dirac measure,n is an integer-valued random variable and Xi ’s are random elements Rof S or events. A point processcan be equivalently represented by a counting process: N (B) : B ξ(x)dx, which basically isthe number of events in each Borel subset B B of S. The mean measure M of a point processξ is a measure on S that assigns to every B B the expected number of events of ξ in B, i.e.,M (B) : E[N (B)] for all B B.RFor inhomogeneous Poisson process, M (B) B λ(x)dx, where the intensity function λ(x) yieldsa positive measurable function on S. Intuitively speaking, λ(x)dx is the expected number of eventsin the infinitesimal dx. For the most common type of point process, a Homogeneous Poisson process,λ(x) λ and M (B) λ B , where · is the Lebesgue measure on (S, B). More generally, in Coxpoint processes, λ(x) can be a random density possiblydepending on the history of the process. ForRany point process, given λ(·), N (B) Poisson( B λ(x)dx). In addition, if B1 , . . . , Bk B aredisjoint, then N (B1 ), . . . , N (Bk ) are independent conditioning on λ(·).For the ease of exposition, we will present the framework for the case where the events are happeningin the real half-line of time. But the framework is easily extensible to the general space.2.2 Temporal Point ProcessesA particularly interesting case of point processes is given when S is the time interval [0, TP), whichnwe will call a temporal point process. Here, a realization is simply a set of time points: ξ i 1 δti .With a slight notation abuse we will write ξ {t1 , . . . , tn } where each ti is a random time before T .Using a conditional intensity (rate) function is the usual way to characterize point processes.For Inhomogeneous Poisson process (IP), the intensity λ(t) is a fixed non-negative function supportedin [0, T ). For example, it can be a multi-modal function comprised of k Gaussian kernels: λ(t) Pk2 1/2exp (t ci )2 /σi2 , for t [0, T ), where ci and σi are fixed center andi 1 αi (2πσi )standard deviation, respectively, and αi is the weight (or importance) for kernel i.A self-exciting (Hawkes) process (SE) is a cox process wherePthe intensity is determined by previous(random) events in a special parametric form: λ(t) µ β ti t g(t ti ), where g is a nonnegativekernel function, e.g., g(t) exp( ωt) for some ω 0. This process has an implication that theoccurrence of an event will increase the probability of near future events and its influence will(usually) decrease over time, as captured by (the usually) decaying fixed kernel g. µ is the exogenousrate of firing events and α is the coefficient for the endogenous rate.In contrast, in self-correctingprocesses (SC), an event will decrease the probability of an event:Pλ(t) exp(ηt ti t γ). The exp ensures that the intensity is positive, while η and γ are exogenousand endogenous rates.We can utilize more flexible ways to model the intensity, e.g., by a Recurrent Neural Network (RNN):λ(t) gw (t, hti ), where hti is the feedback loop capturing the influence of previous events (lastupdated at the latest event) and is updated by hti hv (ti , hti 1 ). Here w, v are network weights.2.3 Wasserstein-Distance for Temporal Point ProcessesGiven samples from a point process, one way to estimate the process is to find a model (Ωg , Fg , Pg ) (Ξ, C) that is close enough to the real data (Ωr , Fr , Pr ) (Ξ, C). As mentioned in the introduction,Wasserstein distance [25] is our choice as the proximity measure. The Wasserstein distance betweendistribution of two point processes is:W (Pr , Pg ) infψ Ψ(Pr ,Pg )E(ξ,ρ) ψ [kξ ρk? ],(1)where Ψ(Pr , Pg ) denotes the set of all joint distributions ψ(ξ, ρ) whose marginals are Pr and Pg .The distance between two sequences kξ ρk? , is tricky and need further attention. Take ξ {x1 , x2 , . . . , xn } and ρ {y1 , . . . , ym }, where for simplicityfirst consider thePcase m n. ThePwenntwo sequences can be thought as discrete distributions µξ i 1 n1 δxi and µρ i 1 n1 δyi . Then,the distance between these two is an optimal transport problem argminπ Σ hπ, Ci, where Σ is the setof doubly stochastic matrices (rows and columns sum up to one), h·, ·i is the Frobenius dot product,and C is the cost matrix. Cij captures the energy needed to move a probability mass from xi to yj .We take Cij kxi yj k where k · k is the norm in S. It can be seen that the optimal solutionis attained at extreme points and, by Birkhoff’s theorem, the extreme points of the set of doublystochastic matrices is a permutation [28]. In other words, the mass is transfered from a unique source3
ΩΞcounts5ωs4s3s2ξt1t2s1t3τ1t1τ2τ3 t2 t3 t4 τ4τ5Tb) k · k? distance between sequencesa) Point process probability spaceFigure 1: a) The outcome of the random experiment ω is mapped to a point in space of count measuresξ; b) Distance between two sequences ξ {t1 , t2 , . . .} and ρ {τ1 , τ2 , . . .}Pnevent to a unique target event. Therefore, we have: kξ ρk? minσ i 1 kxi yσ(i) k , wherethe minimum is taken among all n! permutations of 1 . . . n. For the case m 6 n, without loss ofgenerality we assume n m and define the distance as follows:XnXmkξ ρk? minkxi yσ(i) k ks yσ(i) k,(2)σi 1i n 1where s is a fixed limiting point in border of the compact space S and the minimum is over allpermutations of 1 . . . m. The second term penalizes unmatched points in a very special way whichwill be clarified later. Appendix B proves that it is indeed a valid distance measure.Interestingly, in the case of temporal point process in [0, T ) the distance between ξ {t1 , . . . , tn }and ρ {τ1 , . . . , τm } is reduced toXnXm ti τi (m n) T τi ,(3)kξ ρk? i 1i n 1where the time points are ordered increasingly, s T is chosen as the anchor point, and · isthe Lebesgue measure in the real line. A proof is given in Appendix C. This choice of distanceis significant in two senses. First, it is computationally efficient and no excessive computation isinvolved. Secondly, in terms of point processes, it is interpreted as the volume by which the twocounting measures differ. Figure 1-b demonstrates this intuition and justifies our choice of metricin Ξ and Appendix D contains the proof. The distance used in our current work is the simplest yeteffective distance that exhibits high interpretability and efficient computability. More robust distancelike local alignment distance and dynamic time warping [29] should be more robust and are greatvenues for future work.Equation (1) is computationally highly intractable and its dual form is usually utilized [25]:W (Pr , Pg ) sup Eξ Pr [f (ξ)] Eρ Pg [f (ρ)],(4)kf kL 1where the supremum is taken over all Lipschitz functions f : Ξ R, i.e., functions that assign avalue to a sequence of events (points) and satisfy f (ξ) f (ρ) kξ ρk? for all ξ and ρ.However, solving the dual form is still highly nontrivial. Enumerating all Lipschitz functions overpoint process realizations is impossible. Instead, we choose a parametric family of functions toapproximate the search space fw and consider solving the problemmaxw W,kfw kL 1Eξ Pr [fw (ξ)] Eρ Pg [fw (ρ)](5)where w W is the parameter. The more flexible fw , the more accurate will be the approximation.It is notable that W-distance leverages the geometry of the space of event sequences in terms oftheir distance, which is not the case for MLE-based approach. It in turn requires functions of eventsequences f (x1 , x2 , .), rather than functions of the time stamps f (xi ). Furthermore, Stein’s methodto approximate Poisson processes [30, 31] is also relevant as they are defining distances between aPoisson process and an arbitrary point process.2.4 WGAN for Temporal Point ProcessesEquipped with a way to approximately compute the Wasserstein distance, we will look for a model Prthat is close to the distribution of real sequences. Again, we choose a sufficiently flexible parametricfamily of models, gθ parameterized by θ. Inspired by GAN [20], this generator takes a noise andturns it into a sample to mimic the real samples. In conventional GAN or WGAN, Gaussian oruniform distribution is chosen. In point processes, a homogeneous Poisson process plays the role of a4
non-informative and uniform-like distribution: the probability of events in every region is independentof the rest and is proportional to its volume. Define the noise process as (Ωz , Fz , Pz ) (Ξ, C), thenζ Pz is a sample from a Poisson process on S [0, T ) with constant rate λz 0. Therefore,gθ : Ξ Ξ is a transformation in the space of counting measures. Note that λz is part of the priorknowledge and belief about the problem domain. Therefore, the objective of learning the generativemodel can be written as min W (Pr , Pg ) or equivalently:minmaxEξ Pr [fw (ξ)] Eζ Pz [fw (gθ (ζ))](6)θw W,kfw kL 1In GAN terminology fw is called the discriminator and gθ is known as the generator model. Weestimate the generative model by enforcing that the sample sequences from the model have the samedistribution as training sequences. Given L samples sequences from real data Dr {ξ1 , . . . , ξL } andfrom the noise Dz {ζ1 , . . . , ζL } the two expectations are estimated empirically: Eξ Pr [fw (ξ)] PLPL11l 1 fw (ξl ) and Eζ Pz [fw (gθ (ζ))] Ll 1 fw (gθ (ζl )).L2.5 Ingredients of WGANTPPTo proceed with our point process based WGAN, we need the generator function gθ : Ξ Ξ, thediscriminator function fw : Ξ R, and enforce Lipschitz constraint on fw . Figure 4 in Appendix Aillustrates the data flow for WGANTPP.The generator transforms a given sequence to another sequence. Similar to [32, 33] we use RecurrentNeural Networks (RNN) to model the generator. For clarity, we use the vanilla RNN to illustrate thecomputational process as below. The LSTM is used in our experiments for its capacity to capturelong-range dependency. If the input and output sequences are ζ {z1 , . . . , zn } and ρ {t1 , . . . , tn }then the generator gθ (ζ) ρ works according tohi φhg (Ahg zi Bgh hi 1 bhg ),ti φxg (Bgx hi bxg )(7)Here hi is the k-dimensional history embedding vector and φhg andn The parameter set of the generator is θ Ahg k 1 , Bgh k k ,Similarly, we define the discriminator function who assigns asequence ρ {t1 , . . . , tn } according toφxg are the activation functions. obhg k 1 , Bgx 1 k , bxg 1 1 .Pnscalar value fw (ρ) i 1 ai to thehi φhd (Ahd ti Bgh hi 1 bhg )ai φad (Bda hi bad )(8)no where the parameter set is comprised of w Ahd k 1 , Bdh k k , bhd k 1 , (Bda )1 k , (bad )1 1 .Note that both generator and discriminator RNNs are causal networks. Each event is only influencedby the previous events. To enforce the Lipschitz constraints the original WGAN paper [18] adoptsweight clipping. However, our initial experiments shows an inferior performance by using weightclipping. This is also reported by the same authors in their follow-up paper [27] to the original work.The poor performance of weight clipping for enforcing 1-Lipschitz can be seen theoretically as well:just consider a simple neural network with one input, one neuron, and one output: f (x) σ(wx b)and the weight clipping w c. Then, f 0 (x) 1 wσ 0 (wx b) 1 w 1/ σ 0 (wx b) (9)0It is clear that when 1/ σ (wx b) c, which is quite likely to happen, the Lipschitz constraint isnot necessarily satisfied. In our work, we use a novel approach for enforcing the Lipschitz constraints,avoiding the computation of the gradient which can be costly and difficult for point processes. Weadd the Lipschitz constraint as a regularization term to the empirical loss of RNN.LLLXX1X fw (ξl ) fw (gθ (ζm )) fw (ξl ) fw (gθ (ζl )) ν 1 (10)θ w W,kfw kL 1 L ξl gθ (ζm ) ?l 1l 1l,m 1 We can take each of the 2L2 pairs of real and generator sequences, and regularize based on them;however, we have seen that only a small portion of pairs (O(L)), randomly selected, is sufficient. Theprocedure of WGANTPP learning is given in Algorithm 1minmaxRemark The significance of Lipschitz constraint and regularization (or more generally any capacitycontrol) is more apparent when we consider the connection of W-distance and optimal transportproblem [28]. Basically, minimizing the W-distance between the empirical distribution and the modeldistribution is equivalent to a semidiscrete optimal transport [28]. Without capacity control for thegenerator and discriminator, the optimal solution simply maps a partition of the sample space to theset of data points, in effect, memorizing the data points.5
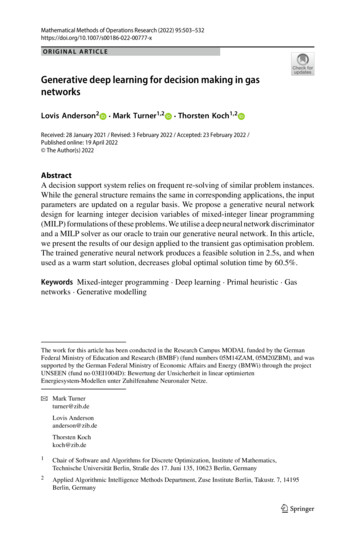
Algorithm 1 WGANTPP for Temporal Point Process. The default values α 1e 4, β1 0.5,β2 0.9, m 256, ncritic 5.Require: : the regularization coefficient ν for direct Lipschitz constraint. the batch size, m. thenumber of iterations of the critic per generator iteration, ncritic . Adam hyper-parameters α, β1 , β2 .Require: : w0 , initial critic parameters. θ0 , initial generator’s parameters.1: set prior λz to the expectation of event rate for real data.2: while θ has not converged do3:for t 0, ., ncritic do4:Sample point process realizations {ξ (i) }mi 1 Pr from real data.5:Sample {ζ (i) }m PfromaPoissonprocesswith rate λz .z 1 Pmi 1PmPm f (ξ ) f (gθ (ζj )) 1(i)(i)0 1 6:L m i 1 fw (gθ (ζ )) m i 1 fw (ξ ) ν i,j 1 w ξii gθw(ζj ) ?07:w Adam( w L , w, α, β1 , β2 )8:end forPz from a Poisson process with rate λz .9:Sample {ζ (i) }mi 1 Pm1(i)10:θ Adam( θ mi 1 fw (gθ (ζ )), θ, α, β1 , β2 )11: end while406Theoretical Quantilesintensityintensity0.500.2505timeData Generated by IP SE me0201005time10246Theoretical QuantilesData Generated by NNReal SCIP NNSE WGAN420Data Generated by IP SE NNreal SC4 IP NNSE WGAN310206Real SC8 IP NNSE WGAN601024Theoretical Quantiles2real SCNN4 IPSE WGAN300Real SCIP NN6 SE WGANData Generated by SC10206Sample QuantilesSample Quantiles4Data Generated by IP SC NNreal SCNN6 IPSE WGAN224Theoretical QuantilesSC8 RealIP NNSE WGAN601040Data Generated by SEData Generated by IPReal SCNN1.00 IPSE WGAN0.750.002Data Generated by NNintensity24Real SCIP NN6 SE WGAN05time10Data Generated by SE SC NNreal SCIP NN6 SE WGANintensity0Data Generated by SCintensity2Real SCIP NN6 SE WGANintensity40Data Generated by SESample QuantilesSample QuantilesData Generated by IPReal SCIP NN6 SE WGAN42005time10Figure 2: Performance of different methods on various synthetic data. Top row: QQ plot slopedeviation; middle row: intensity deviation in basic conventional models; bottom row: intensitydeviation in mixture of conventional processes.3ExperimentsThe current work aims at exploring the feasibility of modeling point process without prior knowledgeof its underlying generating mechanism. To this end, most widely-used parametrized point processes,e.g., self-exciting and self-correcting, and inhomogeneous Poisson processes and one flexible neuralnetwork model, neural point process are compared. In this work we use the most general forms forsimpler and clear exposition to the reader and propose the very first model in adversarial training ofpoint processes in contrast to likelihood based models.3.1 Datasets and ProtocolSynthetic datasets. We simulate 20,000 sequences over time [0, T ) where T 15, for inhomogeneous process (IP), self-exciting (SE), and self-correcting process (SC), recurrent neural point process(NN). We also create another 4 ( C43 ) datasets from the above 4 synthetic data by a uniform mixture6
Table 1: Deviation of QQ plot slope and empirical intensity for ground-truth and learned modelInt. Dev.Int. Dev. QQP. Dev.DataIPSESCNNIPSESCNNIP SE SCIP SC NNIP SE NNSE SC NNMLE-IP0.035 (8.0e-4)0.055 (6.5e-5)3.510 (4.9e-5)0.182 (1.6e-5)0.110 (1.9e-4)1.950 (4.8e-4)2.208 (7.0e-5)1.044 (2.4e-4)1.505 (3.3e-4)1.178 (7.0e-5)1.052 (2.4e-4)1.825 (2.8e-4)MLE-SE0.284 (7.0e-5)0.001 (1.3e-6)2.778 (7.4e-5)0.687 (5.0e-6)0.241 (1.0e-4)0.019 (1.84e-5)0.653 (1.2e-4)0.889 (1.2e-5)0.410 (1.8e-5)0.588 (1.3e-4)0.453 (1.2e-4)0.324 (1.1e-4)EstimatorMLE-SC0.159 (3.8e-5)0.086 (1.1e-6)0.002 (8.8e-6)1.004 (2.5e-6)0.289 (2.8e-5)1.112 (3.1e-6)0.006 (9.9e-5)1.101 (1.3e-4)0.823 (3.1e-6)0.795 (9.9e-5)0.583 (1.0e-4)1.269 (1.1e-4)MLE-NN0.216 (3.3e-2)0.104 (6.7e-3)4.523 (2.6e-3)0.065 (1.2e-2)0.511 (1.8e-1)0.414 (1.6e-1)1.384 (1.7e-1)0.341 (3.4e-1)0.929 (1.6e-1)0.713 (1.7e-1)0.678 (3.4e-1)0.286 (3.6e-1)WGAN0.033 (3.3e-3)0.051 (1.8e-3)0.070 (6.4e-3)0.012 (4.7e-3)0.136 (8.7e-3)0.860 (6.2e-2)0.302 (2.2e-3)0.144 (4.28e-2)0.305 (6.1e-2)0.525 (2.2e-3)0.419 (4.2e-2)0.200 (3.8e-2)from the triplets. The new datasets IP SE SC, IP SE NN, IP SC NN, SE SC NN are created totestify the mode dropping problem of learning a generative model. The parameter setting follows:i) Inhomogeneous process. The intensity function is independent from history and given in Sec. 2.2,where k 3, α [3, 7, 11], c [1, 1, 1], σ [2, 3, 2].ii) Self-exciting process. The past events increase the rate of future events. The conditional intensityfunction is given in Sec. 2.2 where µ 1.0, β 0.8 and the decaying kernel g(t ti ) e (t ti ) .iii) Self-correcting process. The conditional intensity function is defined in Sec. 2.2. It increaseswith time and decreases by events occurrence. We set η 1.0, γ 0.2.iv) Recurrent Neural Network process. The conditional intensity is given in Sec. 2.2, where theneural network’s parameters are set randomly and fixed. We first feed random variable from [0,1]uniform distribution, and then iteratively sample events from the intensity and feed the output intothe RNN to get the new intensity for the next step.Real datasets. We collect sequences separately from four public available datasets, namely, healthcare MIMIC-III, public media MemeTracker, NYSE stock exchanges, and publications citations. Thetime scale for all real data are scaled to [0,15], and the details are as follows:i) MIMIC. MIMIC-III (Medical Information Mart for Intensive Care III) is a large, publicly availabledataset, which contains de-identified health-related data during 2001 to 2012 for more than 40,000patients. We worked with patients who appear at least 3 times, which renders 2246 patients. Theirvisiting timestamps are collected as the sequences.ii) Meme. MemeTracker tracks the meme diffusion over public media, which contains more than172 million news articles or blog posts. The memes are sentences, such as ideas, proverbs, and thetime is recorded when it spreads to certain websites. We randomly sample 22,000 cascades.iii) MAS. Microsoft Academic Search provides access to its data, including publication venues, time,citations, etc. We collect citations records for 50,000 papers.iv) NYSE. We use 0.7 million high-frequency transaction records from NYSE for a stock in one day.The transactions are evenly divided into 3,200 sequences with equal durations.3.2 Experimental SetupDetails. We can feed the temporal sequences to generator and discriminator directly. In practice,all temporal sequences are transformed into time duration between two consecutive events, i.e.,transforming the sequence ξ {t1 , . . . , tn } into {τ1 , . . . , τn 1 }, where τi ti 1 ti . This approachmakes the model train easily and perform robustly. The transformed sequences are statisticallyidentical to the original sequences, which can be used as the inputs of our neural network. To makesure we that the times are increasing we use elu 1 activation function to produce positive inter arrivaltimes for the generator and accumulate the intervals to get the sequence. The Adam optimizationmethod with learning rate 1e-4, β1 0.5, β2 0.9, is applied. The code is available 2 .Baselines. We compare the proposed method of learning point processes (i.e., minimizing sampledistance) with maximum likelihood based methods for point process. To use MLE inference for pointprocess, we have to specify its parametric model. The used parametric model are inhomogeneousPoisson process (mixture of Gaussian), self-exciting process, self-correcting process, and RNN. rning-For-Point-Process7
each data, we use all the above solvers to learn the model and generate new sequences, and then wecompare the generated sequences with real ones.Evaluation metrics. Although our model is an intensity-free approach we will evaluate the performance by metrics that are computed via intensity. For all models, we work with the empiricalintensity instead. Note that our objective measures are in sharp contrast with the best practices inGANs in which the performance is usually evaluated subjectively, e.g., by visual quality assessment. We evaluate the performance of different methods to learn the underlying processes via twomeasures: 1) The first one is the well-known QQ plot of sequences generated from learned model.The quantile-quantile (q-q) plot is the graphical representation of the quantiles of the first data setagainst the quantiles of the second data set. From the time change property [10]R t of point processes,if the sequences come from the point process λ(t) , then the integral Λ tit 1 λ(s)ds betweenconsecutive events should be exponential distribution with parameter 1. Therefore, the QQ plot of Λagainst exponential distribution with rate 1 should fall approximately along a 45-degree reference line.The evaluation procedure is as follows: i) The ground-truth data is generated from a model, say IP; ii)All 5 methods are used to learn the unknown process using the ground-truth data; iii) The learnedmodel is used to generate a sequence; iv) The sequence is used against the theoretical quantiles fromthe model to see if the sequence is really coming from the ground-truth generator or not; v) Thedeviation from slope 1 is visualized or reported as a performance measure. 2) The second metricis the deviation between empirical
Let Sbe a compact space equipped with a Borel -algebra B. Take as the set of counting measures on Swith Cas the smallest -algebra on it. Let (;F;P) be a probability space. A point process on Sis a measurable map : ! from the probability space (;F;P) to the measurable space ( ;C). Figure 1-a illustrates this mapping. 2