Transcription
1EXPERIMENT 7VIBRATION-ROTATION SPECTRUM OF HCl AND DClINTRODUCTIONSpectroscopy probes transitions between different energy levels, or states, using light.Light in the infrared region of the EM spectrum can be used to probe vibrational androtational transitions. The specific rotational and vibrational states are a result of theinteractions between the different atoms in the molecule and, since each molecule has aunique arrangement of atoms, it has a unique IR spectrum almost like a fingerprint. In thislab, you will obtain the spectra of HCl and DCl.When we record a spectrum, all we end up with is a set of lines whose frequenciesand intensities we know. What we cannot tell just by looking at the lines is which energylevels are involved in the transition that leads to each line. To find out anything useful fromthe spectrum, our first step has to be to assign the lines.By ‘assign’ we usually mean specifying the quantum numbers of the energy levelsinvolved. There may be more than one quantum number needed to specify the level,depending on the complexity of the problem. The way we go about assigning andinterpreting a spectrum is as follows:-We start with a model for the energy levels. Typically, we use the energy levels availablefrom solving the Schrodinger equation for a simple system, such as the rigid rotor or theharmonic oscillator in the case of radiation in the IR region.-We then determine the selection rules which apply to these levels and thus predict theform of the spectrum, taking into account that the intensities will be affected by thepopulations of the energy levels as predicted by the Boltzmann distribution (equation 1).
2nj gj-N κεTjeq(8.1)Having done this, we can compare the predicted spectrum with the real spectrum, and seeif they can be made to match up. Typically there will be parameters to adjust, such asrotational constants and vibrational frequencies. The process of matching up theexperimental and predicted spectra is often aided by looking for patterns, such asrepeated spacing of lines.-If there is reasonable agreement between the two spectra, then the assignment process iscomplete, as we know the assignment for the predicted spectrum. The values of anyparameters used in the model can then be interpreted, for example to obtain bond lengths.-However, the match between the experimental and predicted spectra is rarely perfect.Usually we need to refine our model for the energy levels in order to obtain a better fit –for example, by introducing the effects of anharmonicity or centrifugal distortion.The process of assigning and understanding a spectrum is thus one of refining themodel in order to obtain the best agreement. The following is a review of the models used inthis lab. Students should read Chapter 12 of Atkins and de Paula[1] and Chapters 8 and 9 ofCooksy[2].Rotational StatesThe simplest model that considers rotational states is the rigid rotor (RR). This modelconsiders two atoms at a fixed distance that rotate as a unit. A detailed quantum descriptionof the rigid rotor is found in Cooksy [2] and Atkins and de Paula[1]. Here, we will justconsider the result.The quantized energy levels of the rigid rotor are given in equation 2, where I is the
3EJ !2J ( J 1)2I(8.2)moment of inertia shown in equation 3. In the latter, µ is the reduced mass, given inI µr 2(8.3)equation 4, and r is the distance between the two atoms in the rigid rotor. J is the rotationalµ mA mBmA mB(8.4)quantum number and spans integers from 0 to . The degeneracy of the Jth quantum level is2J 1 (used in the Boltzmann distribution, equation 1).Vibrational StatesThe simplest model for vibrations is the harmonic oscillator (HO). Both Atkins andde Paula[1] and Cooksy[2] present many details on the derivation of the quantum vibrationallevels for the harmonic oscillator. Again, we will consider only the result. The vibrationallevels for the harmonic oscillator are given by equation 5, where υ spans integers from 0 to 1 Eυ υ hν 2 (8.5)and ν is the frequency of vibration (equation 6; k is the spring constant). Remember that theν 1/21/21 k 1 V ′′(x) 2π µ 2π µ (8.6)harmonic oscillator potential is V(x) ½kx2 and so the spring constant is directly related tothe curvature, or the second derivative, of the harmonic oscillator potential, V”(x).Interaction between Rotational and Vibrational States (ro-vibrational spectra)When a gas-phase molecule undergoes a vibrational transition, the energy of theabsorbed photon may be slightly lower than or slightly higher than the exact energy neededto change the state of the molecule from υ 0 to υ 1. This excess (or slight deficiency) ofenergy can lead to a simultaneous rotational transition provided ΔJ 0, 1. These selectionrules were derived using the rigid rotor and harmonic oscillator assumptions. The resulting
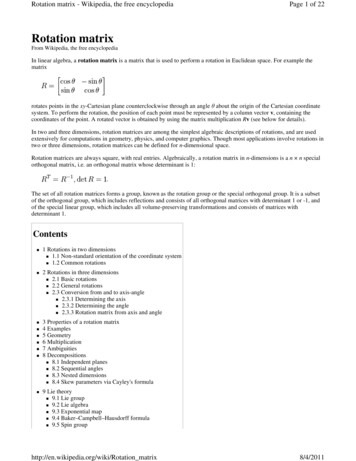
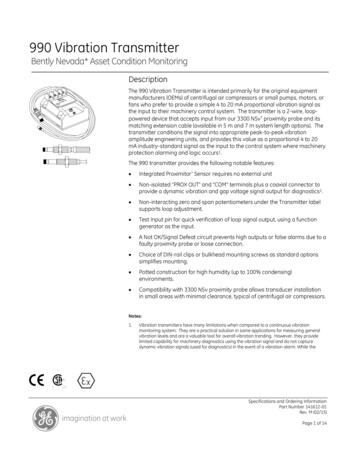
4ro-vibrational spectra can be divided into three branches. Transitions where Δυ 1 andΔJ 1 are called the “R branch”, those where Δυ 1 and ΔJ 1 are called the “P branch”,and those where Δυ 1 and ΔJ 0 are the “Q branch”. For diatomic molecules the Q branchis a forbidden transition (rotation about the bond axis has no effect on the dipole moment)and is not be observed in a ro-vibrational spectrum.Figure 1 illustrates the energy levels for the two lowest vibrational states of adiatomic molecule and shows some of the transitions that are allowed between the sublevels.Also shown is a hypothetical IR spectrum of HCl. What you should notice is that thespectrum is separated into two branches, with a gap between them. The gap is where theinfrared transitions would be if no change in the J value occurred, i.e, ΔJ 0. This region isreferred to as the Q branch and only involves a change in the vibrational quantum number.The low frequency branch (P branch) consists of ΔJ 1 transitions and the high frequencybranch (R branch) consists of ΔJ 1 transitions. Note that the quantum numbers for thelower state in the transition are traditionally labeled as υ” and J” while those for the upperstate are labeled υ’ and J’ (See Lecture 20 notes).You will notice that as you count away from the center of the spectrum the intensityof individual lines increases, goes through a maximum and then falls off in the wings. Thispattern arises from a combination of two effects, the population of molecules in a quantumstate and the number of quantum states at a particular energy. Within a band, the intensitiesare proportional to the population of molecules in the ground vibrational-rotational level. Thepopulation in state J is given approximately by equation 7, where κ is Boltzmann’s constant,N(J ) N 0 (2J 1)e B0 J ( J 1)κT(8.7)which must have the proper units so that the argument of the exponential factor is unitless,
5and N0 is the population in the state υ 0, J 0. The (2J 1) factor is the degeneracy of therotational energy level and arises from the fact that 2J 1 values of the mJ (orientational)quantum number are possible for each value of J. The exponential factor is called aBoltzmann factor and gives the temperature dependence of the distribution.Figure 8.1. Anatomy of a vibration-rotation band showing rotational energy levelsin their respective upper and lower vibrational energy levels, along with someallowed transitions. The spectral lines corresponding to these transitions are shownin the spectrum. Note the splitting that arises from the H35Cl and H37Cl isotopicshifts.
6As in all quantitative work, using the correct units is vital to avoid extractingnonsense from the spectra. In molecular spectroscopy, it is usually safest to converteverything to cgs units. To make sure you know where to begin, you should decide onconsistent units for ν, B, I, r, D, α and κ. The following Table provides values that may behelpful.Table 8.1. Useful constants and conversion factors.h6.626 10-27 erg s6.6261 10-34 Jsκ1.381 10-16 erg/K1.38066 10-23 J/K1 cm-11.986 10-16 erg1.98630 10-34 JmH1.007825 amu1.672623 10-27 kgmD2.0140 amu3.3425 10-27 kgm35Cl34.968852 amu5.803558 10-26 kgm37Cl36.965903 amu6.135000 10-26 kgIf we assume that the vibrational and rotational energies can be treated independently,the total energy of a diatomic molecule (ignoring its electronic energy which will be constantduring a ro-vibrational transition) is simply the sum of its rotational and vibrational energies,as shown in equation 8, which combines equation 1 and equation 4. 1 !2Eυ,J υ hν J ( J 1) 2 2I(8.8)From a pedagogical point of view this provides an excellent framework for exploringquantized vibrational and rotational energy states. The appeal of the HO/RR model arisesfrom the relatively simple mathematical expressions that produce a convenient and solvable
7form of the Schrodinger equation. However, you might wonder how well this idealizedmodel works for a real system.Diatomic molecules are not perfectly rigid rotors. The rotations distort the moleculeand change r. The higher the rotational quantum number, J, the longer the molecule becomes.This centrifugal distortion effect is usually very small and important only for very large Jvalues. The harmonic oscillator model also has limitations. The fact that diatomic moleculesdissociate makes it clear that they are not perfect harmonic oscillators. A potential that takesinto account the fact that diatomic molecules can dissociate is the Morse oscillator potential,equation 9, where De is the dissociation energy. The energy levels for a Morse oscillator areV (x) De (1 e ax )2(8.9)similar to the harmonic oscillator energy levels but include an anharmonic term. As thevibrational quantum number υ increases, the levels get closer together.Combining these two corrections, the energies of the rotational-vibrational levels aregiven, in units of cm 1, by equation 10. The first and second terms account for the vibrationalEυ,J2 1 1 2 ν e υ ν e Xe υ Bυ J ( J 1) Dυ J 2 ( J 1) 22(8.10)energy, and the third and fourth terms account for the rotational energy. The fundamentalvibrational frequency of the molecule is νe. The first anharmonic correction to the vibrationalfrequency is νeXe. Bυ is the rotational constant for a given vibrational level, and Dυ is thecentrifugal distortion constant. Bυ may be obtained from the equilibrium geometry of themolecule using the following relationships (equations 11 & 12), where Be is the equilibriumrotation constant, α is the anharmonicity correction factor to the rotational energy and Ie is theequilibrium moment of inertia. 1 Bυ Be α υ 2 (8.11)
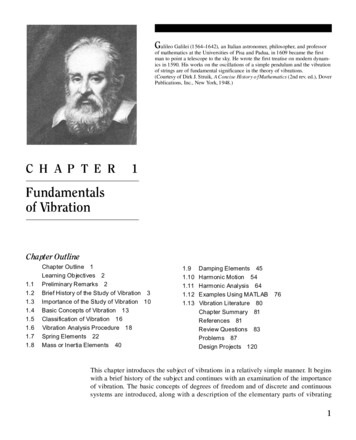
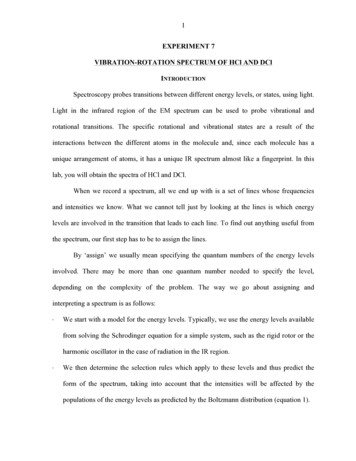
8Be (cm 1 ) h8 π 2 cI e(8.12)PROCEDURE[3]CAUTION! Thionyl chloride is a lachrymator. HCl gas is corrosive and care must be takenN2 Gasto contain it within the optical cell and bubble the excess through water.H2OIndicatorSolutionThionylChlorideIR CellFigure 2: The microscale apparatus used to produce and transfer HCl/DCl gas to an IR gascell. Adopted from ref. 3.You will carry out a reaction that involves thionyl chloride and a mixture of waterand deuterium oxide to produce HCl/DCl gas and SO2 gas according to the followingreaction:SOCl2 (l ) H 2O(l ) 2HCl( g ) SO2 ( g )1. The microscale apparatus is constructed in a fume hood similar to the block diagramshown in Figure 2 (see instructor for details).
92. Approximately three drops of thymol blue is placed into a beaker of water into whichis placed the outlet tube from the gas cell.3. One-half milliliter of thionyl chloride is admitted to the reaction vessel using amicrolitre syringe and the entire apparatus is purged with N2 for 1 minute.4. Purged the IR cell with N2, simultaneously close the inlet stopcock and outletstopcock and move the cell to the FT-IR and collect a background spectrum (Seeinstructor for details) using the following settings:a.b.c.d.e.Resolution: 1 cm 1No. of Scans: 64Final format: AbsorbanceCorrection: NoneBackground Handling: Choose “collect background before every sample”5. Return the cell to the microscale apparatus and run N2 through the apparatus for 1minute.6. The N2 line is then closed with a pinch clamp to prevent HCl/DCl gas from migratingback to the regulator (be careful of any negative pressure).7. Approximately 1 mL of deuterium oxide and 0.5 mL of deionized water aretransferred into a small vial using microlitre syringes.8. One-half milliliter of the D2O/H2O mixture is drawn into a microlitre syringe.9. The syringe is then inserted through the septum and the water is added to the reactionvessel dropwise until the reaction begins to produce gas as is immediately evidentfrom the bubbles escaping from the outlet tube in the beaker of water. The reaction isallowed to proceed until the thymol blue changes color from yellow to red.10. Once the reaction has reached the endpoint indicated in Step 9, the inlet stopcock andoutlet stopcock are closed simultaneously.
1011. Disconnect the inlet and outlet tubes from the cell and immediately place the inlettube into the beaker of water. Reconnect the N2 gas to the reaction vessel to relieveany negative pressure.12. Take the cell to the FT-IR spectrometer and collect a spectrum as instructed.13. Reconnect the outlet tube and purge the IR cell with N2 gas for 1 minute.14. Refill the microliter syringe with deionized water, insert it through the septum andadd water to the vessel dropwise until the reaction has gone to completion asevidenced by no more gas bubbles being generated.15. Since thymol blue changes color over two pH ranges, it can be used to determinewhen the water in the beaker has been neutralized with 2 M NaOH. Once it has beenneutralized, it can be disposed of appropriately.DATA ANALYSISAssigning the SpectrumThe first step in obtaining spectroscopic constants is to assign the spectrum. Severalmethods may be used but the most obvious way for a diatomic molecule is to count outwardfrom the gap between the R and P branches. Remember that the P(0) line is the J” 0 J’ 0 forbidden transition, so you will not see a peak for it. Next you need to tabulate thetransition frequencies of each isotope (H35Cl, H37Cl, D35Cl, and D37Cl) for latermanipulation.Finding Rotational Constants, BυA description of the underlying reasoning that is used to obtain the rotationalconstants for a particular vibrational level is outlined here. First, consider the υ 1 level.
11Note that if you subtract the frequency of the P(J”) line from the that of the R(J”) line, thedifference is given by equation 13, where (J”) is written as (J) for simplicity. This equation[R(J ) P(J ) B1 [( J 2)( J 1) J ( J 1)] D1 ( J 2) ( J 1) J 2 ( J 1)222](8.13)can be simplified to equation 14 and then rearranged into a more useful slope-intercept form(equation 15) so that a plot of [R(J) – P(J)]/(2J 1) versus (J2 J 1) can be use to obtain B1R(J ) P(J ) 2B1 (2J 1) 4 D1 (2J 1)( J 2 J 1)(8.14)R(J ) P(J ) 2B1 4 D1 ( J 2 J 1)(2J 1)(8.15)and D1. To obtain the rotational constants for the υ 0 level, perform the same type ofmanipulation for R(J 1) – P(J 1), whose difference is given by equation 16, which simplifiesto equation 17. These equations apply to both the HCl and DCl species.[R(J 1) P(J 1) B0 [( J 1)( J 2) J ( J 1)] D0 ( J 1) ( J 2) J 2 ( J 1)22R(J 1) P(J 1) 2B0 (2J 1) 4 D0 (2J 1)( J 2 J 1)2](8.16)(8.17)Finding Molecular ParametersUsing the Bυ values and equation 11, you can obtain Be for each isotope.Subsequently, you can calculate the equilibrium bond length (combining equation 12 and 3)and the average bond length for each isotope and vibrational level. If the assumptions wehave made are all correct, re and α should be independent of isotope. Is this true within theprecision of the data?REPORTResults & AnalysisInclude a table of B0, B1, D0, D1, Be α, and re for eachisotopomer (H35Cl, H37Cl, D35Cl and D37Cl) and all graphsused for obtaining these valuesDiscussionCompare your values with those given in references 4-6 (SeeExperiment #4). You should include percent error calculationsassuming the literature value to be correct.1. Do the values of the spectroscopic constants Be, Bυ and Dυ
12vary with isotope and/or with vibrational level in a way thatyou would expect?2. Does re change for each isotope? Explain your answers.3. In general, what accounts for the uneven spacing on the linesin the P and R branches of a vibration-rotation spectrum?4. Use the Boltzmann distribution (equation 7) to model whatthe intensities of the absorption peaks should be for yourexperimental data. Does your data match this theory? Howwould the distribution change at higher temperatures?5. What additional spectroscopic information could be obtainedfrom your data? Be as detailed as possible.AppendicesInclude the data that you obtained experimentally and thespectra with the line positions labeled. Be sure to also include asample calculation for each type performed.REFERENCES1. P.W. Atkins and J. de Paula, Physical Chemistry, 9th Ed., Oxford University Press,2010.2. Cooksy, A, Physical Chemistry: Quantum Chemistry and Molecular Interactions,Pearson Higher Education, 2014.3. S.G. Mayer, R.R. Bard, and K. Cantrell, J. Chem. Educ. 2008, 85, 847.4. F.C De Lucia, P. Helminger, and W.Gordy, Phys. Rev. A 1971, 3, 1849–1857.5. D.H. Rank, D.P. Eastman, S. Rao, and T.A.Wiggins, J. Opt. Soc. Am. 1962, 52, 1-7.6. ic/Html/Tables/HCl.html
rotational transitions. The specific rotational and vibrational states are a result of the interactions between the different atoms in the molecule and, since each molecule has a unique arrangement of atoms, it has a unique IR spectrum almost like a fingerprint. In this lab, you will obtain the spectra of HCl and DCl.