Transcription
From:To:Cc:Subject:Date:Attachments:Jeff Turnipseedsolicitation.questionsMatthew FerraraAHCA RFI - 3M HIS ResponseFriday, June 3, 2022 4:21:15 PMimage001.jpgimage003.jpgAHCA RFI 3M HIS response 6 3 22.docxGood afternoon – please see the attached 3M Health Information Systems responses to the State ofFlorida AHCA RFI 014-21/22.Thank you for the review, considerations, and don’t hesitate to reach out if there are any questions.JeffJeff Turnipseed Client Engagement and Strategy Executive3M Health Information SystemsOffice: 800 455 7338 Mobile: 984 202 6277jsturnipseed@mmm.com
June 3, 2022STATE OF FLORIDA: AGENCY FOR HEALTH CARE ADMINISTRATION REQUEST FOR INFORMATION (RFI 01421/22)To: Cody Massa, Procurement OfficerResponses submitted by 3M Health Information System (3M HIS), 575 West Murray Blvd. Salt Lake City, UT84123. Website: https://www.3m.com/3M/en US/health-information-systems-us.3M HIS Contact Information: Matthew Ferrara, mferrara2@mmm.com Phone: 737-600-2599Jeff Turnipseed, jsturnipseed@mmm.com Phone: 984-202-6277 Description of how the Respondent's approach will offer advantages or improvements over existingprocesses of the SMMC Program. The description should also identify known or potential concerns with theapproach.The Florida Agency for Health Care Administration (AHCA) is aggressively focused on advancing value within itsmanaged care model. 3M HIS applauds this evolving effort and offers the recommendations below asadditional strategies. It is 3M’s belief that the recommendations below will further advance value in the FloridaMedicaid program: Consider risk adjustment methodology for health plan capitation that has greater functionality andis aligned with quality outcomes measures currently used by AHCAThe AHCA/AHCA contracted actuary currently risk adjusts health plan capitation payments using theChronic Disability Payment System risk adjustment tool (CDPS Rx). It is unclear how much utilityCDPS RX risk scores have beyond the activity of the risk adjustment process in setting capitation rates.3M Clinical Risk Groups (CRG) have equal predictive power when used to risk adjust capitationpayments. Because the clinical categorical approach used by CRG yields much better clinicalinformation about the enrollees, they have much more utility and versatility for AHCA, health plansand providers within a value-based care environment. See Appendix for a comparison of riskadjustment models.Through its Quality Strategy, AHCA has launched, in coordination with its health plans, several keyinitiatives focused on reducing Potentially Preventable ED Visits (PPV), Potentially Preventable HospitalAdmissions (PPA), and Potentially Preventable Readmissions (PPR). PPV and PPA leverage 3M ClinicalRisk Groups as the risk adjustment mechanism. CRG’s use cases extend to health plan value-basedcontracting with providers, evaluation of value-based care effectiveness and return on investment,identification of candidates for additional health plan care management, identification of variation incost and quality, etc. Leveraging CRG for both capitation risk adjustment and critical downstreamactivities would serve to create better alignment among the agency, health plans and providers.1
Consider incentivizing health plan performance improvement through default enrollment processthat is linked to measures of value (cost/quality)Health Plans are highly motivated to attract new enrollees and grow their market share. AHCA couldleverage the default enrollment process to incorporate measures of value into the assignment ofdefault pools to health plans. Texas Medicaid implemented an approach that leverages each healthplan’s performance on potentially preventable events as part of the scoring algorithm/resizing ofdefault pools. AHCA could also repurpose other data that it routinely collects on health planperformance to enrich the assessment of health plan value. This initiative would establish a marketlevel competition between health plans based on performance. Furthermore, there is some evidencethat default enrollees are lower utilizers of Medicaid services, which would further motivate healthplans to improve performance relative to their competitors. Consider inclusion of risk adjusted, hospital-centric measures for hospital directed payment program(DPP)AHCA’s current hospital DPP includes the follow quality measures: Overall Cesarean Section numberPotentially Preventable Hospital ReadmissionsHealthcare Related InfectionsFollow-up after Hospitalization for Mental Illness3M has worked with AHCA and its data analytics contractor on calculation of hospital rates ofPotentially Preventable Complications (PPC) for the inpatient setting. At the time, it was contemplatedthat some of the PPCs would be used as quality measures in the DPP. Ultimately, it was decided thatthat the existing measures (listed above) would remain. 3M strongly feels that the PPCs are idealmeasures for use in a hospital DPP in that they include a broad array of patient safety measures andare risk adjusted for fair comparisons. In addition to PPC software that is used in an inpatient setting,3M will be releasing software for licensing that measures risk adjusted rates of PPCs in an outpatienthospital setting. Given that many procedures have shifted from an inpatient hospital setting to anoutpatient hospital setting, 3M feels that this software would be an ideal complement to the currentinpatient PPC software. Consider leveraging 3M methodologies and services to help support, drive, and execute on theFlorida Health Care Connection (FX) principals and trends.3M can help by drive value in Florida with AHCA by:ooEnabling high quality and accessible data – Enriched, high quality, and actionable paymentand population clinical classification that scale to all populationsImprove health care outcomes – Drive innovation and improved outcomes in value andpopulation programs2
ooooooReduce complexity – Simplify, normalize, and translate the language of healthcare intoactionable informationImprove integration with partners – Support modular cloud-based technology and servicesthat scale to managed care and provider partnershipsUse evidence-based decision making – Trusted clinical classification methodologies developedby clinical and economic experts, updated annuallyImprove provider and recipient experiences – Integrated into managed care and providerworkflows to improve patient outcomes and experienceEnable good stewardship of Medicaid funds – Align policy, program, and methodology designto drive efficient use of health system resourcesEnable holistic decision making rather than short term focus - Integrate equitable wholeperson approach that incents long term sustainable value creation3
AppendixMeasuring Population Health Status in Florida: The Choice of a Population HealthStatus GrouperRecommended Criteria for Choice of a Health Status GrouperWe recommend that AHCA balance four criteria in making its decision: 1 How well does the methodology explain and predict population health expensesAbility to understand populations health needs across Florida MedicaidPromoting value-based healthcareEffectiveness and flexibility1. How Well Does the Methodology Explain and Predict Population HealthExpenses?3M Clinical Risk Groups perform similarly on a statistical basis to competing methodologies (e.g., ACGs and MARA) inthe measure that is most relevant to Florida Medicaid health clusters, that is, predictive power at the group level. In comparing population risk adjustment methodologies, the most common citation is a 2016 evaluation by the U.S.Society of Actuaries. 2 The most commonly quoted measure is the R2 statistic, which reflects the percentage of costvariation across individuals that is explained by a grouping methodology. For example, if a formula that correlatedchildren’s weight as a function of their height explained 50% of individual variation in weight, the R2 would be 50%. Inpromoting their methodology, some of our competitors rely heavily on their R2 results from the single SOA study,which had important limitations. Results need to be viewed in context. The SOA authors themselves noted:oR2 should “never be the sole determinant of a model’s success or failure” (p. 56). They declare theirintention “to begin to draw attention away from the R-Squared measure as a definitive metric of risk scoringsuccess” (p. 13) Aside from over-reliance on any single statistic in a complex decision, the R2 can be verymisleading in the presence of outlier observations. 3oThe MarketScan database used for the evaluation mostly reflected healthcare utilization by people withcommercial insurance through large U.S. employers. In fact, the SOA study omits almost all newborns,infants, and people aged 65 and over (pp. 12, 16) as well as many people with disabilities or low incomes.The omission of the 65 population is especially notable, since they often have multiple chronic conditions.oSeveral evaluated methodologies had beendeveloped using the MarketScan database itself,even though the SOA authors would havepreferred an independent database (p. 12). Thisfactor likely favored methodologies that wereboth developed and evaluated using differentyears of the same MarketScan database. CRGs,by contrast, were developed and evaluatedusing entirely separate databases.oMost important, the SOA authors argue – andwe agree – that measuring performance at theindividual level is “notably removed from thebusiness problem that risk scoring models are4
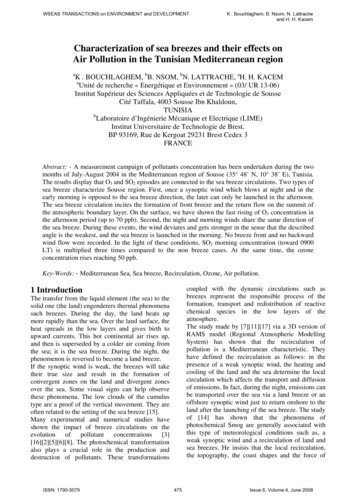
most typically employed to help solve: predicting healthcare expenditures for a group of insured individuals.We believe more useful measures for comparing models in this context are thus at the group level” (p. 21). When risk was evaluated at the group level, performance is “much more tightly clustered across models” (p. 22).Exhibit 1 shows two important findings:oThe average difference between actual and predicted values drops dramatically when you look at the grouplevel rather than the individual leveloCRGs, ACGs, MARA perform equally well (e.g., 3%)When considering the relative merits of a regression based statistical model and a clinical categorical model, it isworth remembering the key differences, as shown in Exhibit 2.The bottom line: So long as a methodology has an acceptable level of predictive power – which CRGs, ACGs, and MARA do– then the choice of a methodology should reflect other considerations.Exhibit 2Differences between Clinical Categorical Models and Regression-Based ModelsIssueClinical Categorical Model (3M CRGs)Regression-based ModelDevelopment methodClinical model developed by cliniciansStatistical model developed withregression analysisStructure of modelClinically meaningful categories of enrolleessubdivided into explicit severity-of-illness levelsAdditive mathematical formula that computesa score for a beneficiaryData used to compute outputLongitudinal claims data linked at the individuallevelLongitudinal claims data linked at theindividual levelUse for rate settingEach clinical category has a payment weightthat is converted into a payment amount:“Product with a price”Numeric score is converted to apayment amountCalculation and replication ofpayment amountsArithmetic average that is easily calculated foreach 3M CRG independent of developersRequires regression analysis, which can bedifficult to perform independent of developersCommunication value toprovidersCreates a language understood by physiciansdue to the explicit clinical definitions of each3M CRGNumeric score with minimal communicationvalueUpdate processSelective clinical areas can be refined withoutaffecting entire clinical modelClinical model is stable, but payment weightswill changeRequires re-specification of statistical modelUse with pharmacy and/orhealth status informationClinical model is stableRequires re-specification of statistical modelCarve outsClinical model is stable, but payment weightswill changeRequires re-specification of statistical modelResponse to changingpractice patterns ortechnology5Requires re-specification of statistical model
2. Ability to Understand Population Health Needs across FloridaWe suggest that CRGs are more powerful than competing methodologies in their ability to help health systemmanagers and clinicians understand and improve health status in Florida. If, alternatively, AHCA chose a methodologydeveloped mostly for allocating funds, we believe that could be a significant missed opportunity. Of the leading methodologies considered in the SOA evaluation, CRGs were the only clinical categorical model. Inthe CRG model, each individual in a population is assigned to a single, mutually exclusive Clinical Risk Group, includingboth a base CRG and a severity of illness (Exhibit 3). Additionally clinical categorical models are based on expertclinical opinion, are hierarchically structured with layers of rules governing the interactionsExhibit 3amongst and between variables in the algorithm. All the other evaluated models wereCRG Examplestatistical regression models. (Although ACGs have a categorical component, publiclyavailable information indicates that ACGs are primarily a regression-based approach.) The CRG categorical clinical model defines groups of individuals who are similar bothclinically and in their typical use of healthcare resources. This approach creates a languagethat links the clinical and financial aspects of care. The importance of this communicationvalue cannot be overemphasized. The best-known categorical model, Diagnosis RelatedGroups for inpatient care, was “arguably the most influential innovation in the history ofhealth care financing.” 4 As the U.S. federal government said, “Central to the success of theMedicare inpatient hospital prospective payment system is that DRGs have remained a clinical description of why thepatient required hospitalization.” 5 Regression models, by contrast, generate risk scores from proprietary regression models that are often difficult forclinicians to accept, interpret, and act on. CRGs were developed by clinicians and researchers from 3M and what is now the national Children’s HospitalAssociation. 6 An explicit goal was to recognize the interaction of chronic conditions and the gradations of severity ofillness within underlying conditions. In Exhibit 3, the “7” indicates an individual with chronic diseases in three bodysystems; the “7060” specifies the combination of heart failure, diabetes, and COPD. The illness burden of people inbase CRG 7060 can range from 1 to 6; this individual is severity 2. Every CRG has an associated relative weight(known as a risk score in the regression models) that reflects average health care cost in this CRG. Very specific clinical logic is used to organize data from an individual’s multiple diagnoses that had been coded usingapproximately 70,000 distinct ICD-10 diagnosis codes. (Procedure and drug codes can also contribute to CRGassignment.) Examples are as follows.oSeverity level grading. A patient with asthma (base CRG 5138) is assigned to severity 1 (CRG 51381) in theabsence of complications, to severity level 2 with a comorbidity of recurrent sinusitis within 90 days, toseverity level 3 with a comorbidity of a major infection, or to severity level 4 with a complication ofrespiratory failure.oHierarchy and conditionality. Extensive logic is used to consolidate similar conditions, distinguish separateconditions, and identify the most serious conditions within each organ system. For example, hierarchicalrules assign a patient with diabetes and a broken leg to a CRG for diabetes. As another example,conditionality rules apply to a patient with both diabetes and skin ulcers. Although chronic skin ulcers are inthe integumentary organ system, they are typically a complication of diabetes and therefore will not countas a distinct chronic disease. They will, however, be considered in assigning the diabetes severity of illness.oRecency. Where appropriate, CRG assignment places greater significance on more recent diagnoses andprocedures.oRecurrence or persistence. Rules of persistence or recurrence distinguish whether certain conditions areacute or chronic. For example, a 90-day recording rule identifies acute nephritis that persists and becomeschronic.6
o Functional status. The 3M Functional Status Groups (FSG) methodology, included within the CRG software,generates complementary information on how deficits in the activities of daily living (e.g., mobility andcognition) affect health status and resource use. 7 FSG assignment requires patient data on functional status.AHCA can use CRGs to understand and improve population health, as illustrated by these examples.oPopulation segmentation. Florida applied CRGs to its Medicaid population of four million people. It found,for example, that 32,000 had serious chronic conditions in three or more body systems (Health Status Group7), of which approximately 2,000 had the combination of heart failure, diabetes, and COPD (base CRG7060). 8oClinical insight. Researchers use CRGs to conclude that children with chronic conditions in two or more bodysystems represented the fastest growing inpatient care cohort at 28 children’s hospitals. 9oPatient data on the clinician’s desktop. New York State provides participating physicians with a dashboardshowing the patient’s CRG assignment, previous CRG, “persistent high needs” status relative to resource usefor the patient’s CRG, and the most recent potentially preventable admission, readmission, and ED visit.oDisease progression. CRGs enable tracking – and, potentially, slowing – of the progression of chronicdiseases. 10 An example is the percentage of people with uncomplicated diabetes who typically progress todiabetes with complications or comorbidities in a three-year period.oMedically complex children. CRGs are commonly used in research on medically complex children. 11oCase management. CRGs are well-suited to case management, first by categorizing patients into discrete andclinically meaningful categories, then by enabling drill-down analysis by diagnostic subgroups, and ultimatelyby serving as the risk adjuster to identify services of marginal value in improving health outcomes. 12Bottom line: Unlike opaque and non-clinical statistical models, CRGs create a common language for clinicians and financialmanagers to understand and improve health status at both the individual and population level.3. Promoting Value Based HealthcareAs Florida moves down the road to value-based healthcare, the choice of h population health status measure is anessential decision. Choosing CRGs fits well with other directions AHCA may consider now or in the future.7
Potentially preventable admissions and emergency department visits. Several U.S. states have successfully used the3M Potentially Preventable Admission and Potentially Preventable Emergency Department Visit methodologies toreport and/or reduce the incidence of these potentially preventable events. 13 Clinical Risk Groups were used toenable fair comparisons of results across physician groups, counties, and other groupings. Episodes of care. CRGs are a building block in the 3M Patient-focused Episode (PFE) methodology, which enablesclinicians and academic researchers to change their focus from individual services to the bundle of services providedfor an episode of pediatric bronchiolitis or orthopedic surgery (among many other PFE examples). 14 Allocation of funds. In addition to empowering clinical tools to improve population health, CRGs are well-suited tothe allocation of funds across health clusters in Florida. The New York State Medicaid program, for example, usesCRGs to allocate approximately 30 billion U.S. a year to managed care organizations. In Spain, four large healthregions use CRGs to identify population morbidity and calculate capitation payment for primary care and ambulatorydrugs.Bottom line: The goal is not just to allocate money – though CRGs perform well for that purpose – but to improve care andreduce the growth in health care spending.4. Effectiveness and FlexibilityWe suggest that AHCA staff, officials at the health cluster level, and clinicians on the front lines of health care deliverywill appreciate the effectiveness and flexibility of 3M CRGs. Clarity. Every individual is assigned to a single CRG. As shown in Exhibit 3, CRGs use everyday language to definepatient health status in clinical terms. Granularity and aggregation. The five-digit CRGs (base CRG severity) are the most granular, useful to cliniciansseeing patients in their office. The most aggregated level comprises the nine Health Status Groups, useful foroverviews of population health status and resource use. In between are three levels of aggregation, such as ACRG3that can be used for allocating budgets by region. As well, Diagnostic Subgroups (a CRG component) combine manyclosely related diagnosis codes into a history of specific conditions for each patient. Transparency. Overviews of CRG categorization are available in the public domain on the Internet 15 and CRGlicensees have access to the CRG Definitions ManualsExhibit 4that provide extensive and detailed information onThe Road to Value Based Healthcarehow the number, nature, and interaction of diseasesdrive DRG assignment. Furthermore, 3M welcomessuggestions for improvement from clinicians andresearchers; CRGs, unlike regression-based models,are not a “black box.” Stable clinical model with separately calculatedrelative weights. The categorical nature of CRGspermits separation of clinical groupings (which aregenerally stable) from the calculation of relativeweights (which vary with differences in benefitcoverage, utilization, and unit costs acrosspopulations). In Florida, CRG groupings likely wouldremain stable across years while relative weights couldbe updated to reflect changes in clinical practice andcoding. The result is a consistent and powerfulcommunication tool. Regression-based models, bycontrast, require complete re-specification as practicepatterns and coding evolve. 168
Clinical model remains stable during clinical logic enhancements. 3M researchers constantly look for opportunitiesto make CRG groupings more clinically appropriate. When these improvements are made, the rest of the clinicalmodel typically remains unchanged. Regression-based approaches, again, require re-specification of the entire modelto accommodate change. Code mapping appropriate to Florida. 3M is a world leader in the mapping of diagnosis and procedure codes; bothacross countries and version boundaries. We have worked with many countries at varying levels of codingsophistication, and we have witnessed coding improve as clinical information has increasing impact on resourceallocation and quality measurement.Bottom line: Because the CRG clinical categorical model is more transparent and more flexible than regression-basedapproaches, it lends itself to multiple uses throughout a country’s health care system.9
Exhibit 5Comparison of Alternative Population Groupers3M Clinical Risk GroupsJohns Hopkins ACGsApproachClinical, categorical model. Each person isassigned to one of 392 base CRGs. Whenseverity levels are assigned, this generates 1,474mutually exclusive CRGs. 17Statistical model (regression-based) on a baseof categories (Aggregated Diagnosis Groups orADGs). Each person is assigned a statisticalrisk score.Statistical model (regression-based). Eachperson is assigned a statistical risk score.Input dataDiagnoses, plus selective use of procedure anddrug dataDiagnoses and drug dataDiagnoses and drug dataConcurrent and prospectivemodelsYes, bothYes, bothYes, bothBasic CharacteristicsMilliman Advanced Risk Adjustors1. How Well Does the Methodology Explain and Predict Population Health Expenses?See discussion on page 1 for essential context in interpreting this informationSociety of Actuaries studyMean Average Error 3.0%for groups of 10,000 people* R2 12%– Prospective95th percentile of error 7.4%*Excludes age 65 , almost allnewborns and infants, andmany people with disabilitiesSociety of Actuaries studyMean Average Error 2.4%for groups of 10,000 people* R2 43%– Concurrent95th percentile of error 5.8%*Excludes age 65 , almost allnewborns and infants, andmany people with disabilities2. Ability to Understand Population Health Needs across FloridaEach individual assigned toa single clinicallymeaningful groupYes (CRG)Mean Average Error 2.9%R2 19%95th percentile of error 7.1%Mean Average Error 2.8%R2 22%95th percentile of error 7.0%Mean Average Error 2.2%R2 52%95th percentile of error 5.6%Mean Average Error 2.0%R2 60%95th percentile of error 5.2%Yes (ADG)No10
Measure of relativeresource useTerminology is “relative weight.”Calculated as the simple average of resource costof individuals in a given CRG.Severity levelsYes, up to 6 levels of severity, recognizing thereality that people with the same illness may havevery different severities of illnessYes – complementary 3M Functional StatusGroups methodology adds predictive valueFunctional status (activitiesof daily living)measurementPediatric emphasisTerminology is “risk score.”Calculated by regression analysis as the sum ofcoefficient values for individual diseases, withan unknown number of coefficients forinteraction terms.LimitedTerminology is “risk score.”Calculated by regression analysis as the sumof coefficient values for individual diseases,with an unknown number of coefficients forinteraction terms.NoNoNoSearch of the biomedical literature findspediatric referencesSearch of the biomedical literature finds nopediatric referencesFully integrated with the 3M Patient-focusedEpisode methodologyNo companion methodology comparable inscope to 3M PFEsNo companion methodology comparable inscope to 3M PFEsCRGs provide risk adjustment for the 3Mmethodologies for Potentially PreventableAdmissions and Potentially Preventable ED Visits.Includes predictions of future inpatient and EDuse as well as identification of ED use with apresenting problem that could have beentreated in an alternative setting.Includes predictions of future inpatient andED use, without distinguishing potentiallyavoidable use.Developed by 3M in collaboration with what isnow the national Children’s Hospital Association.Often used by children’s hospitals andindependent researchers to measure and managemedically complex children. See bibliography,Section D.3. Promoting Value Based HealthcareCompatibility with usingepisodes of care foranalysis and paymentApplicability to avoidablehospital useNo companion methodology comparable inscope to 3M PPAs or PPVs.No companion methodology comparable inscope to 3M PPAs or PPVs.4. Effectiveness and FlexibilityClarityIndividual is assigned to a single, clinically definedCRG. There are almost 1,500 CRGs in total withclear clinical description and each has anassociated relative weightEach individual is assigned a single ACG.There are almost 110 ACGs, their descriptionstend to be broad referencing the number ofADGs and age with no clinical detail/specificity11Each individual is assigned a number ofnumerical risk scores in different servicecategories
Granularity and aggregationFor any individual, clinicians and healthcaremanagers can see the CRG (1,474) includingseverity level, the base CRG (392), Health StatusGroup. Three levels of aggregation, are availableEach individual is assigned multiple ADGs (32)and through statistical modelling methods isassign an ACG (110); regressive statisticalmodels assign the numerical risk score.Only the numerical (percentage) risk scores.Flags indicate the number of conditiondrivers. etc.TransparencyMethodology Overview is publicly available. 18Online Definitions Manual allows licensees to seeextensive detail on CRG assignmentProprietary logic with little transparency intowhat drives the risk scoreProprietary logic with little transparency intowhat drives the risk scoreStability—relative weightsBecause a categorical approach is used, themodel can remain stable while relative weightscan be recalculated separately for differentpopulations or benefit plans. 19 Recalculation isrelatively straightforward and may be donewithout involving the methodology developersBecause a categorical approach is used, parts ofthe model can typically be enhanced withoutchanging the rest of the modelBecause a regression approach is used, themodel must be re-specified for differentpopulations or benefit plans, typically requiringinvolvement of the methodology developers.Because a regression approach is used, themodel must be re-done for differentpopulations or benefit plans, typicallyrequiring involvement of the methodologydevelopers.Because a regression approach is used,enhancements typically require re-specificationof the entire modelBecause a regression approach is used,enhancements typically require respecification of the entire model3M is a world leader in mapping diagnosis andprocedure code sets across countries. CRGs areexplicitly designed for international use.ACGs are used outside the U.S., implyingcapability in international code mappingNo information availableStability – logicenhancementsInternational code mapping12
Clinical Risk Groups: Selected BibliographyA.CRG Documentation by 3M AuthorsFuller RL, Hughes JS, Goldfield NI. Adjusting population risk for functional health status. Popul Health Manage.2016;19(2):136-144.Hughes JS, Averill RF, Eisenhandler J, Goldfield NI, Muldoon J, Neff JM, Gay JC. Clinical Risk Groups (CRGs): a classificationsystem for risk-adjusted capitation-based payment and health care management. Med Care. 2004;42(1):81-90.Goldfield N, Averill R, Eisenhandler J, Hughes JS, Muldoon J, Steinbeck B, Bagadia F. The prospective risk adjustmentsystem. J Ambul Care Manage. 1999;22(2):41-52.Goldfield N, Eisenhan
3M Health Information Systems Office: 800 455 7338 Mobile: 984 202 6277 jsturnipseed@mmm.com. 1 June 3, 2022 STATE OF FLORIDA: AGENCY FOR HEALTH CARE ADMINISTRATION REQUEST FOR INFORMATION (RFI 014-21/22) To: Cody Massa, Procurement Officer .