Transcription
WSEAS TRANSACTIONS on ENVIRONMENT and DEVELOPMENTK . Bouchlaghem, B. Nsom, N. Lattracheand H. H. KacemCharacterization of sea breezes and their effects onAir Pollution in the Tunisian Mediterranean regionaK . BOUCHLAGHEM, bB. NSOM, bN. LATTRACHE, aH. H. KACEMaUnité de recherche « Energétique et Environnement » (03/ UR 13-06)Institut Supérieur des Sciences Appliquées et de Technologie de SousseCité Taffala, 4003 Sousse Ibn Khaldoun,TUNISIAbLaboratoire d’Ingénierie Mécanique et Electrique (LIME)Institut Universitaire de Technologie de Brest.BP 93169, Rue de Kergoat 29231 Brest Cedex 3FRANCEAbstract: - A measurement campaign of pollutants concentration has been undertaken during the twomonths of July-August 2004 in the Mediterranean region of Sousse (35 48’ N, 10 38’ E), Tunisia.The results display that O3 and SO2 episodes are connected to the sea breeze circulations. Two types ofsea breeze characterize Sousse region. First, once a synoptic wind which blows at night and in theearly morning is opposed to the sea breeze direction, the later can only be launched in the afternoon.The sea breeze circulation incites the formation of front breeze and the return flow on the summit ofthe atmospheric boundary layer. On the surface, we have shown the fast rising of O3 concentration inthe afternoon period (up to 70 ppb). Second, the night and morning winds share the same direction ofthe sea breeze. During these events, the wind deviates and gets stronger in the sense that the describedangle is the weakest, and the sea breeze is launched in the morning. No breeze front and no backwardwind flow were recorded. In the light of these conditions, SO2 morning concentration (toward 0900LT) is multiplied three times compared to the non breeze cases. At the same time, the ozoneconcentration rises reaching 50 ppb.Key-Words: - Mediterranean Sea, Sea breeze, Recirculation, Ozone, Air pollution.coupled with the dynamic circulations such asbreezes represent the responsible process of theformation, transport and redistribution of reactivechemical species in the low layers of theatmosphere.The study made by [7][11][17] via a 3D version ofRAMS model (Regional Atmospheric ModellingSystem) has shown that the recirculation ofpollution is a Mediterranean characteristic. Theyhave defined the recirculation as follows: in thepresence of a weak synoptic wind, the heating andcooling of the land and the sea determine the localcirculation which affects the transport and diffusionof emissions. In fact, during the night, emissions canbe transported over the sea via a land breeze or anoffshore synoptic wind just to return onshore to theland after the launching of the sea breeze. The studyof [14] has shown that the phenomena ofphotochemical Smog are generally associated withthis type of meteorological conditions such as, aweak synoptic wind and a recirculation of land andsea breezes. He insists that the local recirculation,the topography, the coast shapes and the force of1 IntroductionThe transfer from the liquid element (the sea) to thesolid one (the land) engenderers thermal phenomenasuch breezes. During the day, the land heats upmore rapidly than the sea. Over the land surface, theheat spreads in the low layers and gives birth toupward currents. This hot continental air rises up,and then is superseded by a colder air coming fromthe sea; it is the sea breeze. During the night, thephenomenon is reversed to become a land breeze.If the synoptic wind is weak, the breezes will taketheir true size and result in the formation ofconvergent zones on the land and divergent zonesover the sea. Some visual signs can help observethese phenomena. The low clouds of the cumulustype are a proof of the vertical movement. They areoften related to the setting of the sea breeze [15].Many experimental and numerical studies haveshown the impact of breeze circulations on theevolution of pollutant concentrations [3][16][2][5][6][8]. The photochemical transformationalso plays a crucial role in the production anddestruction of pollutants. These transformationsISSN: 1790-5079475Issue 6, Volume 4, June 2008
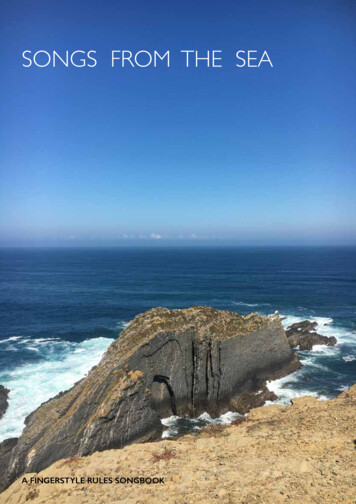
WSEAS TRANSACTIONS on ENVIRONMENT and DEVELOPMENTacids and aerosols. They remarked that the problemof air quality on the Mediterranean basin isprincipally governed by diurnal meteorologicalprocess such as breezes.Thepresentstudyfocusesthecharacterization of sea breezes and their effects onthe air quality at the Eastern Tunisian Coast.synoptic wind play important roles in the transportof pollution. The numerical study of [9] shows theeffect of the recirculation of land and sea breezes onthe ozone distribution. They demand that the ozoneand its precursors be transported over the sea by theland breeze. Later on, the front breeze transports theozone precursors on the land. A weak sea breezeand the intensification of solar radiations activatethe photochemical process and contribute to theozone increase of concentration.2 ExperimentaldescriptiondesignandsiteSousse region (35 48’ N, 10 38’ E), is in the Eastcentre of the Tunisian country (Fig.1). The climateof this region has a particularity which is due to theabsence of relief, and the opening on theMediterranean Sea. Under the influence of itslocation in the Tunisian coasts, our region isdistinguished by a hot and dry summer, and coldand humid winter. The main emissions are linked tobricks and cement factories and essentially to theelectric power plant in the South East of the region.We have made a campaign to measure theconcentrations of the main atmospheric pollutants(NO, NO2, O3 and SO2) in the period ranging from 1July to 6 August 2004 using the mobile laboratoryof National Agency of the Environmental Protection(NAEP) (Fig.2). The chosen site was the hospitalFarhat Hached situated in the town centre of Sousse(500 m from the sea). These measured pollutants areharmful both for the human health and theenvironment: Ozone is a major photo-oxide productof the atmosphere. It is manifested in the presenceof UV radiation stemming from ozone precursors.NO2 UV radiationNO O andO O2O3Then it is consumed by NONO O3NO2 O2Fig.1: North Africa map displaying Tunisia andSousse region location (35 48’ N, 10 38’ E).A 3D model of air pollution TAPM (The AirPollution Model) [10] second version has beenapplied to predict meteorological parameters andpollution field on the Mediterranean. The obtainedresults display that the development of a sea breezeduring the day and a nocturnal land breeze due tothe temperature contrast between the land and thesea may reduce the diffusion of air masses in thepresence of the recirculation. Via a meso-scalemodel, [4] have explained that the late sea breezedevelopment is due to the presence of an offshoresynoptic wind. These breezes are generallycharacterized by the formation of a front breeze anda return current in the upper layers. They displaythat this dynamic nature contributes to the ozoneconcentration increase on the coasts. With referenceto the experimental data of the MEDiterraneanCAmpaign of PHOtochemical Tracers- TRAnsportand Chemical Evolution (MEDCAPHOT-TRACE),[18] has proved that the pollution problems arestrictly interconnected with the launching and thesteadiness of the sea breeze. Via the 3D version ofRAMS Model (Regional Atmospheric ModellingSystem) and the experimental data analysis, [12]have proved that the sea breeze combines with themountain breeze to create a recirculation over theMediterranean basin with a residence time of fewdays. Under the impact of solar radiation, thisrecirculation takes the shape of photochemicalreactor where the precursors give birth to ozone,ISSN: 1790-5079K . Bouchlaghem, B. Nsom, N. Lattracheand H. H. KacemFig.2: Mobile laboratory for air pollutantsmeasurements and Acquisition systems of data.The high levels of ozone give birth to the formationof the Smog phenomena and the green house effect.The oxidization of NOx and SO2 in the atmospherestimulates the formation of aerosols (e.g. H2SO4,476Issue 6, Volume 4, June 2008
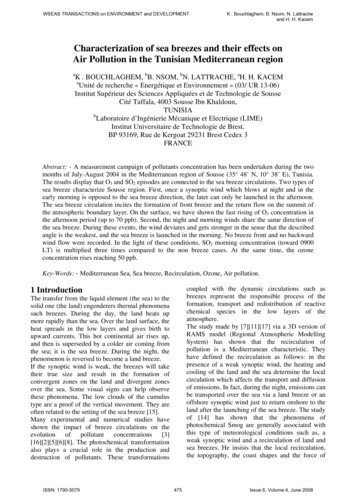
WSEAS TRANSACTIONS on ENVIRONMENT and DEVELOPMENTK . Bouchlaghem, B. Nsom, N. Lattracheand H. H. KacemHNO3 ) which play a crucial role in the productionof acid rain and the damage caused to theenvironment [1].3. Experimental resultsaWith reference to the data of the National Instituteof Meteorology, the data of the NOAA ARL modeland to the air masses trajectories which come overSousse region (HYSPLIT Model-Back trajectories)we have identified days during which the sea breezeis evident. In order to distinguish the sea breezeevents, we have associated their development in aperpendicular wind direction to the coast (50 130 ). The increase of wind speed during a timeperiod is too long, followed by a decrease in windspeed at night. On the synoptic scale, we havechosen anticyclonic situation as well as weakconditions of pressure gradient. The activation ofthe breeze varies between 0800 and 1600 LocalTime (LT). We have come across two types of seabreeze: the early morning sea breeze characterizedby a setting varying from 0800 LT to 1000 LT. Thisbreeze type represents 35% (5 cases) of breeze days.The afternoon sea breeze characterized by alaunching ranging between 1200 LT and 1600 LTrepresenting 65% (10 cases) of breeze days. It isimportant to note that the sun rise time (rangingfrom 0500 to 0529 LT during the campaign) and thediurnal evolution of solar radiation intensity (Fig.8)which controls the setting of sea breeze remainsnearly constant. This result shows that Sousse seabreeze launching doesn’t only depend on the landsea temperature contrast but also on the directionand speed of the synoptic wind. Fig.3 illustrates airmasses trajectories which reach Sousse regionduring the campaign. We distinguish three cases.First, an afternoon sea breeze (Fig.3a) in which wenotice the recirculation of air masses and theswitching of wind direction.Second, early morning sea breeze (Fig.3b) in whichwe remark the steady South Eastern wind directioncoming from the sea. Third, non-sea breeze (Fig.3c)in which the wind direction is maintained offshoreduring the day.bcFig.3: Samples of surface air masses trajectoriesreaching Sousse region. (a) Afternoon sea breezecases (b) Early morning sea breeze cases and (c)Non-sea breeze cases (NOAA ARL data).in the Fig.4. The wind direction changes clockwisein a continuous, slow and progressive way startingfrom the North and the North West direction. Thewind speed rises progressively during the period 001300 LT. It reaches its apogee between 5 and 7 m/sstarting from 1300 LT until the end of the day(about 1900 LT). The maximum of wind speed issynchronized with the late change of the winddirection. The decrease of wind speed after the sunset points out to the disappearance of the sea breeze.This is due to the reduction of sea-land temperaturecontrast.3.2 Early morning sea breeze casesIn order to visualize the early morning sea breezevariation, we have presented on Fig.5, the windtemporal evolution. In the morning (about 0900LT), the wind direction switches about 30 SouthEast vis-à-vis the synoptic wind direction (SSE).The wind progressively turns anticlockwise until itreaches the sea breeze direction. This rotationassociated with a reinforcement of wind is carriedout in such a way as the angle described is weak.We notice that the wind returns to its original sector(SSE) when the breeze vanishes. In order todistinguish the different effects which are due to twotypes of sea breeze, we have to compare the early3.1 Afternoon sea breeze casesThe temporal evolution of the direction and speed ofwind relative to afternoon sea breezes are regroupedISSN: 1790-5079477Issue 6, Volume 4, June 2008
WSEAS TRANSACTIONS on ENVIRONMENT and DEVELOPMENTmorning wind direction and speed to the afternoonones.Wind Direction (1/10 deg)3603040910152402040506273.3 Evolution of pollutants concentrationIn order to understand the photochemical potentialcoupled with the sea breeze dynamic circulations,we have carried out comparisons of ozoneconcentrations for early morning and late sea breezecases vis-à-vis a non sea breeze case (Fig.6).According to these measurements, the region ofSousse is less polluted without breeze than withbreeze. The temporal evolution of the ozoneconcentration related to late sea breeze daysdisplays the ozone concentration reduction duringthe night which is due to the stability of air massesand to the decrease of the atmospheric boundarylayer height. The polluted air is trapped in the upperlayers [12]. This thermal cover inhibits the upwardand downward movements. Moreover, in theabsence of UV radiation during the night, the ozonedestruction is governed by the following activereaction: NO O3NO2 O2.Just after the sunrise, the land surface heating givesbirth to the appearance of a mixture of hot and coldair near the land surface and to the progressiveincrease of the atmospheric boundary layer height.The upper layers ozone is thus trapped on thesurface level [12]. This mechanism contributes tothe concentration increase of early morning ozone.Starting from the fresh emissions in the presence ofUV radiation, the ozone production notablyintervenes in the early morning ozone concentration.As far as the sea breeze effects are concerned, theirinfluence on O3 concentration evolution issignificant in the afternoon. It reaches a maximumconcentration of 70 ppb and maintains the nocturnalozone level. Now let’s focus on the evolution of thepollutants concentration on the surface related tomorning breeze days. As regards, the temporalevolution of the pollutants concentration, theinfluence of sea breeze setting is significant. Thepresence of South-East sea breeze causes thetransport of the electric power plant rement site). This explains the rapid rise inthe concentration of O3 up to 50 ppb and of SO2 upto 10 ppb at 0900 LT. Besides, the ozoneconcentration evolution indicates the presence of asecond ozone maximum in the afternoon. The originof this maximum is attributed to the powerful solarradiation. Now, let’s compare ozone and sulfurdioxide during the two different breeze cases(Fig.7). The ozone maximum relative to afternoonsea breeze switches vis-à-vis that of morningbreezes. This shift is due to the late wind directionchange and to the relatively moderate wind speed.Contrary to the afternoon breeze concentration, theearly morning SO2 concentration is three ust189006121824Local Time8Wind Speed lyAugustAugustAugust006121824Local TimeFig.4: Temporal variation of wind direction, andwind speed during the afternoon sea breeze days.Wind Direction (1/10 deg)3618 July19 July20 July27189006121824Local Time1218 July19 July20 JulyWind Speed m/s108642006121824Local TimeFig.5: Temporal variation of wind direction andwind speed, during the early morning sea breezedays.These later curves are manifested in particular alimited late wind maximum (from 5 to 7 m/s). Thiswind is inferior to that of the morning sea breeze (11m/s). This speed difference is attributed to the factthe late sea breeze is opposed by an offshoresynoptic wind. Nevertheless, the onshore synopticwind which characterizes the setting of the earlymorning sea breeze (about 0900 LT), triggers thewind direction change (anticlockwise) and itsstrengthening in the morning (11 m/s).ISSN: 1790-5079K . Bouchlaghem, B. Nsom, N. Lattracheand H. H. Kacem478Issue 6, Volume 4, June 2008
WSEAS TRANSACTIONS on ENVIRONMENT and DEVELOPMENTK . Bouchlaghem, B. Nsom, N. Lattracheand H. H. Kacemhigher. This shows the pollutant advectionstemming from the electric power plant as soon asthe wind direction becomes parallel to directionmade by the power plant and measurement site.18192013O3 concentration (ppb)50091524181970O3 concentration ppb5580JulyJulyJulyJulyEarly breezes4560July 2004July 2004July 2004July 2004July 2004504030201040035061224No breeze11251061218SO2 concentration (ppb)024Local Time800304091015240405061370Late tJuly5015 July13 July10 July26 July18 July19 JulyEarly Breeze20O3 concentration (ppb)18Local Time30987654No breeze3Late Breeze240130No breeze00206121824Local Time10Fig.7: Comparison of pollutants concentrationsrelated to afternoon and early morning sea breezes.(Solid lines are afternoon sea breeze curve).006121824Local TimeFig.6: Comparison of the temporal evolution ofpollutants concentration related to early morning seabreeze cases and the afternoon sea breeze cases visà-vis non-sea breeze cases800Late breezesRadiation Flux w/m2700During the whole measurement campaign, theevolution of the solar radiation flux is of the sameshape (Fig.8). Knowing that the powerful radiationis a dominant factor controlling the ozoneproduction, the photochemical potential is not theunique factor responsible for the concentrationsdifference between the days of breeze. The latewind direction change, the relatively weak windspeed and the air masses recirculation highlight theafternoon ozone maximum. In fact, the ozone and itsprecursors are advected on the Mediterranean Seavia the nocturnal offshore synoptic wind just toreturn after the sea breeze setting. The offshoresynoptic wind opposes the sea breeze penetrationcausing the formation of an accumulation over theMediterranean Sea. The ozone is far from the NOfresh emissions and thus can be saved. The ozonedestruction mechanism is 3 to 7 times less rapid onthe sea than in the land [13]. Due to the sea breezesetting, the ozone and its precursors return to jointthe fresh emissions of Sousse region. Thismechanism favours the appearance of an ozonemaximum in the afternoon. The relatively weakwind traps the pollutants and promotes thephotochemical production of ozone in the presenceof intense solar radiation.ISSN: 1790-5079Early breezesNo breezes600500400300200100006121824Local TimeFig.8: Temporal variation of solar radiation flux atSousse region (NOAA ARL data).4 Typical studies of sea breeze casesWith reference to the data of local meteorologicalstations, to NOAA data and to air massestrajectories, we have treated as an example the daysof July 2004 (4, 15, 18 and 19 July) during whichthe sea breeze flow is clear. The two days 4 and 15July 2004 represent afternoon sea breeze cases. The18 and 19 July 2004 are marked by a morning seabreeze. With the assistance of NOAA data, we havestudied the late sea breeze vertical evolution. Wehave represented the vertical speed fields at 1200UTC (LT UTC 1h) but at different heights(100m, 800m, 1500m and 3000m) (Fig. 9). It isimportant to note the appearance of two types ofcells (A and B) close to Sousse coast (A is anupward vertical movement and B is a downwardvertical movement). At 100m altitude, the A upward479Issue 6, Volume 4, June 2008
WSEAS TRANSACTIONS on ENVIRONMENT and DEVELOPMENT(a)(b)100 mK . Bouchlaghem, B. Nsom, N. Lattracheand H. H. Kacem800 m(d)3000m(c)1500 mFig. 9: Spatial evolution of vertical wind component (mb/h) over North Africa and the Mediterranean sea on 4July 2004 at 1200 UTC. These fields are obtained at (a) 100 m altitude, (b) 800 m altitude, (c) 1500 m altitudeand (d) 3000 m altitude. A: upward motion and B: downward motion. (NOAA ARL data).weak deviation according to surface sea breeze.The upward air movements which are the result ofthe sea breeze launching penetrate inland. Theoffshore synoptic wind mixes with the rising hot airto form the front of the breeze. This is representedin Fig. 9 by intensified upward winds in the frontthrough the compression of wind current. Theformation of such a breeze is often associated withconvective clouds parallel to the coast [15]. Fig. 10indicates the spatial and temporal evolution on thesurface of the vertical wind component in NorthAfrica and the Mediterranean Sea for the same day.The surface wind fields are obtained at 00 UTC,0600 UTC, 1200 UTC and 1800 UTC. At 00 and0600 UTC the Tunisian territory and theMediterranean Sea are dominated by downward airmovements. Starting from 1200 UTC we witnessthe appearance of upward movements near theTunisian coasts. The wind spread reaches about 80km inland. The subsidence over the MediterraneanSea is of paramount significance. The reduction ofthe surface heat flux just before the sun set (1800UTC) causes the abating of the sea breeze cell.vertical movement (-3 mb/h) covers the entireTunisian coast (Fig. 9a). The spread of A cellreaches about 80 km onshore. Over theMediterranean Sea, the downward movement of Bcell is evident. At 800m altitude, the intensity of Acell rises reaching -6 mb/h and is followed bysubsidence symmetrical movements over the sea( 6 mb/h, B cell). From 800m to 1500m altitude,the vertical speed intensity accentuates (from -6mb/h to -10 mb/h) always in the presence of A andB cells. Higher than 1500m altitude whichrepresents the height of the atmospheric boundarylayer over Sousse region (NOAA data) the Bdownward movement disappears and the A cellspeed weakens (from -10 mb/h to -5 mb/h).According to this figure, air masses circulation maybe described as following: At 1200 UTC, the landis heated up more than the sea. Over the landsurface, the heat wave propagates in the surfaceboundary layer giving birth to upward currents. Therising air is superseded by a colder air blowingfrom the sea. The return wind direction witnesses aISSN: 1790-5079480Issue 6, Volume 4, June 2008
WSEAS TRANSACTIONS on ENVIRONMENT and DEVELOPMENTK . Bouchlaghem, B. Nsom, N. Lattracheand H. H. Kacem(a)00 UTC(b)0600 UTC(c)1200 UTC(d)1800UTCFig. 10: Spatial and temporal evolution of vertical wind component (mb/h) over North Africa and theMediterranean sea on 4 July 2004. These surface fields are obtained at (a) 00 UTC, (b) 0600 UTC, (c) 1200UTC and (d) 1800 UTC. A: upward motion.Basing ourselves on these data we can put forwardthe following explanations: On the surface, theonshore synoptic wind accentuated by the seabreezecomponentpropagatesfromtheMediterranean Sea (cell A) to the Tellian Atlas (cellB) where it is ejected at 3000 m altitude. At thislevel, upward motion becomes horizontal withclockwise rotation and a slow descent at thesynoptic scale [3]. We have compared on Fig. 13the afternoon sea breeze evolution of 15 July 2004vis-à-vis that of the morning sea breeze of 18 July2004. During the afternoon sea breeze, the offshorewind direction dominates Sousse region until 1200LT (Fig. 13a). The wind flow changes clockwisewhen the breeze is set. At the peak of theatmospheric boundary layer (1500 m), the flowbecomes offshore (Fig. 13a). The continentalsynoptic wind merges with the upward hot air inthe front breeze to trigger the return flow which isFig. 11 represents the midday vertical windcomponent evolution of early morning sea breeze atdifferent altitudes (100m, 800m, 1500m and3000m). At 800m altitude two wind cells (A and B)appear. A cell indicates downward air movements(w 6 mb/h at 800m) and B cell shows upwardmovements (w -4mb/h). We have compared thevertical component of Fig. 11 with the horizontalwind field at each level represented in Fig. 12. Wecan show that the flow in cell A is transferred tocell B. In reality, this is the cold and humid marineflow which is advected from the Mediterranean tothe North of Tunisia and to Algeria where the AtlasMountains are responsible for the upwardmovements observed at this level. From 800m to1500m altitude (Fig. 11b, c) the wind speed in cellB is accentuated (from w -4 mb/h to w -10mb/h). At 3000 m we remark the disappearance ofcell A and the persistence of cell B.ISSN: 1790-5079481Issue 6, Volume 4, June 2008
WSEAS TRANSACTIONS on ENVIRONMENT and DEVELOPMENTK . Bouchlaghem, B. Nsom, N. Lattracheand H. H. Kacem(a)100 m(b)800 m(c)1500 m(c)3000mFig. 11: Vertical wind component (mb/h) over the Mediterranean sea and North Africa on 18 July 2004 at 1200UTC. Four levels are presented (a) 1000 mb (100m height), (b) 925 mb (800m height), (c) 850 mb (1500mheight) and (d) 700 mb (3000m height). A: downward motion and B: upward motion.These conditions are not suitable for sea breezefront formation.accompanied by a subsidence on the MediterraneanSea. Fig. 13c and 13e respectively illustrate thehumidity and wind direction profiles relative to theafternoon sea breeze. At this stage, it is ofparamount importance to note the wind directionchange starting the atmospheric boundary layersummit (1500 m). The relative humidity evolutionwith the altitude denotes two different phases: In thelower layers (up to 1500 m) the humidity rises from39% to 54%. The cold and humid air of the seabreeze propagates throughout these layers (Fig.13c). In the upper layers, the relative humidityprofile decreases from 54% to 40%. The hot and dryinland synoptic wind dominates these atmosphericlayers. At the top of the atmospheric boundary layer,the two flows interact to produce the divergentreturn flow and a convergent subsidence on theMediterranean Sea. Nevertheless, in the morningbreeze case, the onshore synoptic wind (Fig. 13b)inhibits the air upward rising. The vertical windscurrents are weak due to the setting aside of currentflow. The humidity vertical profile is homogenous(Fig. 13d).ISSN: 1790-50795 Air pollutants concentrationWe have pointed out above that the pollutionepisode in the region of Sousse is principallygoverned by the intensity of the pollutants emissionsources, by the UV radiation photochemicalpotential and the meteorological conditionspromoting the pollutants transport. The solarradiation flux is nearly constant during the wholecampaign (Fig. 8). The early morning sea breezetemperature maximum of 18 July 2004 is 31.2 Cwhich is actually higher than that of 15 Julyafternoonseabreeze(27.5 C)(Nationalmeteorological data). These two elements have asignificant influence on the photochemical potentialof the ozone production. Contrary, the O3 maximumin the afternoon sea breeze (59 ppb) (Fig. 14c) farout weighs that of the early morning sea breeze (49ppb) (Fig. 14a). This result confirms the dominance482Issue 6, Volume 4, June 2008
WSEAS TRANSACTIONS on ENVIRONMENT and DEVELOPMENT(a)(c)100 m(b)1500 m(d)K . Bouchlaghem, B. Nsom, N. Lattracheand H. H. Kacem800 m3000 mFig. 12: Horizontal wind flow observed on 18 July 2004 at different levels (a) 1000 mb (100m height), (b) 925mb (800m height), (c) 850 mb (1500m height) and (d) 700 mb (3000m height). Sousse city is indicated by astar on the figure. (NOAA ARL data).Thus, the upper reservoir layer of ozone is firmlytrapped on the level of the surface which leads to anincrease of concentration of early morning ozone[12]. The production of ozone interferes remarkablein the early morning ozone concentration beginningwith the newly obtained emissions in the presenceof UV radiation.It’s crucial to note that in the afternoon, theinfluence of the sea breeze effects on O3concentration is so important since it attains amaximum concentration of 60 ppb and helpsmaintain the nocturnal level of ozone. Both thephotochemical production and the pollutionrecirculation in the afternoon sea breeze case helpbring a concentration of ozone in the region ofSousse. The transport of O3 and its precursors arepromoted by the offshore synoptic wind over theMediterranean Sea given that the weak wind whichprecedes the breeze launching contributes to on of O3 is preserved since there are noNO fresh emission.of dynamic effect over the photochemical onesduring the campaign. Fig. 14 represents thetemporal evolution of the pollutants concentration(O3 and SO2) during the two breeze cases. TheSouth East direction of the early morning sea breezehas a significant effect (Fig. 14a, b). This directionallows the pollution transport from the electricpower plant to the measurement site. Thisphenomenon helps the appearance of an ozonemaximum (49 ppb) and SO2 (10 ppb) about 0900LT. The second ozone peak can be explained by theintense photochemical production in the afternoon.The temporal development of the ozoneconcentration on the surface associated with the latesea breeze day has been studied in the same figure.The ozone concentration reduction during the nightis displayed by the curve. So the active reaction ofdestruction governs the ozone depletion. As soon asthe sun rises, a combination of hot and cold air nextto land surface and of a gradual increase of theatmospheric boundary layer height come intoexistence due to the heating of the land surface.ISSN: 1790-5079483Issue 6, Volume 4, June 2008
WSEAS TRANSACTIONS on ENVIRONMENT and DEVELOPMENTK . Bouchlaghem, B. Nsom, N. Lattracheand H. H. Kacem(b)(a)25002500seaseaAltitude (m)Altitude 200204060-60-40-200204060Humidity %Humidity %(d)(c)600015 JulyAltitude (m)500040003000200010000090180270360Wind Direction (deg)(e)Fig. 13: (a) Air masses trajectories reaching Sousse at 1500 LT, on 15 July 2004 (100m and 1500m height), (b)air masses trajectories reaching Sousse on 18 July 2004 (100m and 1000m height), (c) relative humidity profileof 15 July 2004 respectively in the land and over the sea, (d) relative humidity profile of 18 July 2004respectively in the land and over the sea, (e) wind direction profile at Sousse on 15 July 2004 (NOAA ARLdata).ISSN: 1790-5079484Issue 6, Volume 4, June 2008
WSEAS TRANSACTIONS on ENVIRONMENT and DEVELOPMENTK . Bouchlaghem, B. Nsom, N. Lattracheand H. H. Kacem705513 July 200415 July 200413 July 2004O3 concentration ppbO3 concentration ppb18 July 200445352560504030200612182406Local Time1824(c)(a)12418 July13 July15 July13 July10SO2 concentration (ppb)SO2 concentration (ppb)12Local Time8643212000612180246Local Time121824Local Time(b)(d)Fig. 14: Comparison of SO2 and O3 concentration for early morning sea breeze case (18 July 2004) vis-à-visnon sea breeze case (13 July 2004) (a, b) and afternoon sea breeze case (15
3.1 Afternoon sea breeze cases . The temporal evolution of the direction and speed of wind relative to afternoon sea breezes are regrouped . a b c . Fig.3: Samples of surface air masses trajectories reaching Sousse region. (a) Afternoon sea breeze cases (b) Early morning sea breeze cases and (c) Non-sea breeze cases (NOAA ARL data). in the Fig.4.