Transcription
2021 CUPA-HRFACULT Y IN HIGHER EDUC ATION ANNUAL REPORTOverview2021 Faculty in Higher EducationAnnual ReportCITATION FOR THIS R E PORTBichsel, Jacqueline; Fuesting, Melissa; Nadel-Hawthorne, Sarah; & Schmidt, Anthony (2021, March).Faculty in Higher Education Annual Report: Key Findings, Trends, and Comprehensive Tables for TenureTrack, Non-Tenure Teaching, and Non-Tenure Research Faculty and Summary Data for Adjunct Faculty forthe 2020-21 Academic Year (Research Report). CUPA-HR. Available fromhttps://www.cupahr.org/surveys/results/.i
2021 CUPA-HRFACULT Y IN HIGHER EDUC ATION ANNUAL REPORTAbout CUPA-HRCUPA-HR is higher ed HR. We serve higher education by providing the knowledge, resources,advocacy and connections to achieve organizational and workforce excellence. Headquarteredin Knoxville, Tennessee, and serving over 33,000 HR professionals and other campus leadersat nearly 2,000 member institutions and organizations, the association offers learning andprofessional development programs, higher education workforce data, extensive online resourcesand just-in-time regulatory and legislative information.AuthorsJacqueline Bichsel, Ph.D., Director of ResearchMelissa Fuesting, Ph.D., Survey ResearcherSarah Nadel-Hawthorne, Ph.D., Survey ResearcherAnthony Schmidt, M.S.Ed., Data Visualization ResearcherCITATION FOR THIS R E PORTBichsel, Jacqueline; Fuesting, Melissa; Nadel-Hawthorne, Sarah; & Schmidt, Anthony (2021, March).Faculty in Higher Education Annual Report: Key Findings, Trends, and Comprehensive Tables for TenureTrack, Non-Tenure Teaching, and Non-Tenure Research Faculty and Summary Data for Adjunct Facultyfor the 2020-21 Academic Year (Research Report). CUPA-HR. Available fromhttps://www.cupahr.org/surveys/results/.1
2021 CUPA-HRFACULT Y IN HIGHER EDUC ATION ANNUAL REPORTCUPA-HR Data Use Agreement All survey results are copyrighted by the College and University Professional Associationfor Human Resources (CUPA-HR). No data contained in a survey report or obtained throughDataOnDemand (DOD) may be reproduced in any form for any purpose without the writtenconsent of CUPA-HR. Report findings and conclusions may be appropriately cited/referenced inother reporting if there is proper acknowledgment of the source and the referenced materialdoes not involve reproduction of data tables or graphics.DOD can be purchased only by higher education institutions. Due to the sensitive andconfidential nature of the data we collect, we reserve the right to confirm an individual’sauthorization to purchase DOD with his or her HR department, and to confirm with HR thateach user listed on the order is authorized to view employee data. Individuals outside of theHR department seeking access will need written approval from the head of HR — these includefaculty, unions, other administrators, etc. CUPA-HR accepts no responsibility for any employeewho misrepresents his or her authorization.Annual survey reports contain comprehensive tables of aggregated data and may be purchasedby anyone. However, all points of this agreement apply to the use of this tabular data.Survey results may not be changed or modified. Results may not be misrepresented as to theirsource or intent.Survey results may not be used to solicit or conduct business. The sole exception is the use ofconsultants who are currently engaged in a project with a higher ed institution that has grantedaccess to that institution’s purchase of DOD. Consultants may use the obtained data in theirbusiness dealings with the purchasing institution only. Consultants cannot order DOD directly.They should ask the appropriate representative of the institution for which they are working tocontact us — via research@cupahr.org — to request consultant access to DOD. The institutionrepresentative should furnish: (a) the consultant’s name, company, address, e-mail, and phonenumber; (b) a statement that indicates the consultant has been hired to perform work requiringthe use of CUPA-HR data; (c) authorization for the consultant to see the institution’s data; and (d)the names of the surveys to which the consultant should be granted access.Survey results may not be uploaded to a separate system or placed on the web without theexplicit permission of CUPA-HR.Access to survey reports and DOD is limited to the users purchasing the report or subscription.Sharing report information, log-in credentials, output from DOD analyses, or DOD accesswith other institutions or organizations will result in immediate cancellation of access and willpreclude future access. The system tracks and monitors purchases, use, and users.An institution is defined as an entity which has as its sole purpose the provision ofpostsecondary education and reports to the Integrated Postsecondary Education Data System(IPEDS) hosted by the National Center for Education Statistics (NCES). Results must be purchasedfor each institution in which CUPA-HR data is used and may only be used for the institutionfor which the subscription was purchased. Results may not be shared with — or used for —institutions within a multi-institution system for which a DOD subscription or annual report hasnot been purchased. System offices, defined as any entity that oversees two or more institutions,may share or use data only with institutions in their system for which the data has beenpurchased.2
2021 CUPA-HR3FACULT Y IN HIGHER EDUC ATION ANNUAL REPORTContentsAbout CUPA-HR 1Authors 1CUPA-HR Data Use Agreement 2Contents 3Highlights 4Introduction 5Faculty Surveyed 5Instructional Programs Surveyed 6Participating Institution Characteristics 7Faculty Composition and SizeA LL SE C TI O N SFaculty Composition by ClassificationFaculty Job Losses Over the First Year of the PandemicWhere Were Faculty Cuts Made?AV A IL A BL E INFU LL R EP O R TDisciplines With the Greatest Percentage Decrease in Full-Time FacultyDisciplines With the Greatest Decrease in Number of Full-Time FacultyTrends in Full-Time Faculty SalariesRepresentation and Pay of Women and Racial/Ethnic Minorities in Tenure-Track FacultyComposition of TT Faculty Workforce by Sex and Race/EthnicityRepresentation of Women and Racial/Ethnic Minorities by RankPay Ratios for Women and Racial/Ethnic Minorities by RankPay Equity and Representation of New and Newly-Promoted Women andRacial/Ethnic MinoritiesAdjunct (Pay-Per-Course, Part-Time) FacultyMethodology 8Survey 8Full-Time Faculty and Department Heads 8Faculty Paid by the Course (Adjunct Faculty) 9Institutional Characteristics 9Respondents 10Acknowledgments 11Appendix A. Comprehensive Tables A1Appendix B. Participating Institutions B1
2021 CUPA-HRFACULT Y IN HIGHER EDUC ATION ANNUAL REPORTHighlightsThe following are highlighted results from the CUPA-HR 2021 Faculty in Higher Education AnnualReport: The proportions of tenure-track, non-tenure-track, and adjunct faculty are relatively unchangedfrom last year. However, faculty of all types experienced job losses across all institutionalclassifications. Adjunct faculty experienced the greatest decrease in size, with a nearly 5%reduction in workforce since last year.The two disciplines sustaining the greatest percentage loss in full-time faculty are Leisure &Recreational Activities and Library Science.The two disciplines with the greatest loss in sheer faculty numbers are Business, Management,& Marketing and Biological & Biomedical Sciences.The overall median salary increase for full-time faculty from 2019-20 to 2020-21 was 0.69%, thelowest increase since 2010.The proportions of women and racial/ethnic minorities within tenure-track faculty are notmuch different from last year, indicating that faculty cuts made during the past year did notdisproportionately impact the representation of women and minorities in tenure-track facultyoverall.Women and minorities are less represented with increases in rank among tenure-track faculty,a trend that has persisted for many years.Adjunct faculty earn the most pay per credit hour at doctoral institutions ( 1,288) and the leastat associate’s institutions ( 917). This difference may be due to the fact that at most doctoralinstitutions, the department hiring the adjunct sets their pay, whereas a single entity sets thepay for all adjuncts at most associate’s institutions.4
2021 CUPA-HRFACULT Y IN HIGHER EDUC ATION ANNUAL REPORTIntroductionThis marks the 40th year of data collection for the CUPA-HR Faculty in Higher Education Survey,which was piloted in 1981-82. Broadly, the survey collects data on full-time faculty by instructionalprogram, tenure type, and rank (defined later in the introduction), as well as aggregate data foradjunct (pay-per-course) faculty.Beginning in the 2016-17 academic year, the CUPA-HR Faculty in Higher Education Survey begancollecting demographic information on all full-time faculty — sex, race/ethnicity, age, and years inrank. In 2018-19, this survey started collecting data on the highest degree attained for each fulltime faculty member. In addition, the survey collects detailed salary supplement and course reliefinformation for faculty department heads/chairs, making it the most comprehensive major surveyof workforce data on higher education faculty.This marks a special year for data collection and reporting for all CUPA-HR surveys. The severebudget cuts in the wake of the COVID-19 pandemic forced many institutions to freeze hiring, cutpositions and, in some cases, decrease salaries. This report highlights the overall changes to facultysize and salaries over the past year.FACULT Y SURVE YEDA total of 263,721 full-time faculty positions were reported for this year’s survey. Salary anddemographic data for tenure-track (TT), non-tenure teaching (NTT), and non-tenure research(NTR) faculty were collected by rank: professor, associate professor, assistant professor, newassistant professor, and instructor for TT and NTT faculty; and professor, associate professor,assistant professor, new assistant professor, scientist, and postdoctoral scholar for NTR faculty.1Supplemental salary and course relief data were collected on the 9,579 faculty identified asdepartment heads/chairs. In addition, salary data on 57,190 adjunct (pay-per-course) faculty werecollected in aggregate form.21Tenure-track faculty include those who are already tenured as well as pre-tenure faculty.2See the Methodology section of this report for more specific information on the sample and the data collected.5
2021 CUPA-HRFACULT Y IN HIGHER EDUC ATION ANNUAL REPORTINS TRUC TIONAL PROGR AMS SURVE YEDInstructional programs used in the survey are based on the 2020 Integrated PostsecondaryEducation Data System (IPEDS) Classification of Instructional Programs (CIP).3 The CIP taxonomy is ahierarchy organized on three levels: 2-digit codes (XX) define the most general groupings of related disciplines.4 4-digit codes (XX.XX) define subdisciplines that have comparable content and objectives. 6-digit codes (XX.XXXX) define specific specialties within disciplines.For example:42) PSYCHOLOGY. Instructional programs that focus on the scientific study of the behavior ofindividuals, independently or collectively, and the physical and environmental bases of mental,emotional, and neurological activity.42.27) Research and Experimental Psychology. Instructional content for this group ofprograms is defined in codes 42.2701-42.2799.42.2701) Cognitive Psychology and Psycholinguistics. A program that focuses onthe scientific study of the mechanisms and processes of learning and thinking, andassociated information encoding, decoding, processing and transmitting systems.Includes instruction in theories of cognition and intelligence; studies of cognitiveprocesses such as memory, sensation, perception, pattern recognition, problemsolving, and conceptual thinking; cybernetics; psycholinguistics; and the study ofbiological and social communications mechanisms and processes.3IPEDS 2020 Classification of Instructional Programs (CIP) Codes (2019). National Center for Education Statistics.Detailed reporting on all CIPs can be found in DataOnDemand.4Most analyses referenced in this report are based on 2-digit CIP codes. In the interest of conserving space, thisreport uses intuitive abbreviated versions of the 2-digit titles specified by IPEDS.6
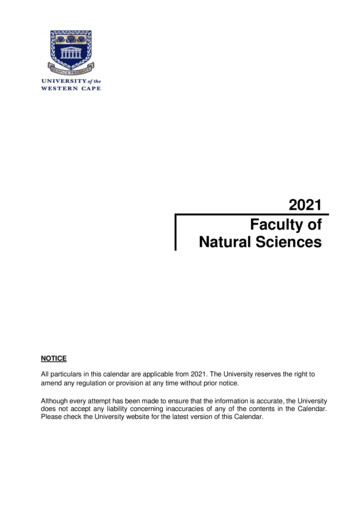
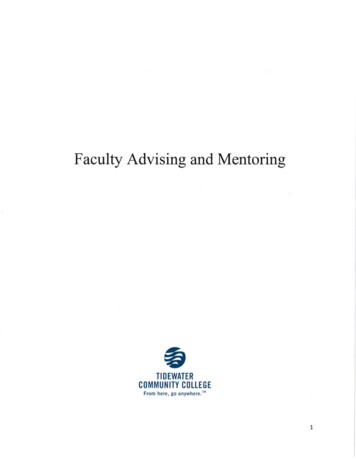
2021 CUPA-HR7FACULT Y IN HIGHER EDUC ATION ANNUAL REPORTPARTICIPATING INS TITUTION CHAR AC TER IS TICSThe information in Figure 1 summarizes the institutional characteristics of respondents to thisyear’s Faculty in Higher Education Survey. In total, 793 institutions provided incumbent-level datafor full-time faculty, and 362 of those institutions provided aggregate data for adjunct faculty.5Institutions are well represented in this year’s data by classification, affiliation, and region.2 0 2 1 F A C U L T Y I N H I G H E R E D U C AT I O NFaculty Survey accalaureateAssociate'sTOTAL: 793PrivateReligiousREGIONMidwest197194Special e 15See Appendix B for a list of all participating institutions. Special focus/other institutions (including for-profitinstitutions) and postdocs were excluded from all analyses for this report except for the adjunct faculty section(resulting in a sample size of 721 institutions and 249,348 full-time faculty for the rest of this report). See theMethodology section for more detail on these exclusions.South
2021 CUPA-HRFACULT Y IN HIGHER EDUC ATION ANNUAL REPORTMethodologySURVE YThe data collection period for CUPA-HR’s Faculty in Higher Education Survey ran from November 2,2020 to January 15, 2021. The survey was conducted through Surveys Online.6Full-Time Faculty and Department HeadsThis year’s survey includes data for 263,721 full-time faculty, including 171,367 tenure-track (TT)faculty; 79,339 non-tenure teaching (NTT) faculty; and 13,015 non-tenure research (NTR) faculty. Ofthose faculty, 9,579 were identified as department heads. For each full-time faculty member, thefollowing data were collected: Annualized 9-10-month salary (effective date November 1, 2020) Tenure type (TT, NTT, or NTR) Rank professor, associate professor, assistant professor, new assistant professor, and instructorfor TT and NTT facultyprofessor, associate professor, assistant professor, new assistant professor, scientist, andpostdoctoral scholar for NTR facultyHighest degree attained [doctorate (Ph.D., M.D., J.D., or equivalent), master’s, bachelor’s,associate’s] H-1B status Sex (optional) Race/ethnicity (optional) Year entered current rank (optional) Birth year (optional) Whether the faculty member is a department head (if checked, additional data on salarysupplements, summer salary, and course relief were collected)Participants could either enter this data manually online for each faculty member or upload a filecontaining this data.Faculty Paid by the Course (Adjunct Faculty)A total of 362 institutions provided optional aggregate information on pay and pay practices for atleast 57,190 pay-per-course (adjunct) faculty.7 Data collected were: Which entity sets the adjunct pay rate (collective bargaining, single unit, department, other) Whether and how pay is affected by enrollment in course6Surveys Online is a product of Peerfocus.7The total number of adjunct faculty reported is a low estimate, given that the question on number of adjunctfaculty is optional.8
2021 CUPA-HR FACULT Y IN HIGHER EDUC ATION ANNUAL REPORTWhether adjunct faculty are paid different rates based on: Level of education Type of degree program taught (graduate or undergraduate) Selected disciplines/courses Total number of adjunct faculty Average pay per semester credit hour Lowest pay per semester credit hour Highest pay per semester credit hour Total number of credit hours taught by adjunct facultyInstitutional CharacteristicsIn addition, data on institutional characteristics were collected from all participants:8 Total expenses reported to IPEDS in 2019-20 Student enrollment (effective date approximately October 15, 2020) Faculty size (effective date November 1, 2020) and number of separations in the past year Staff size (effective date November 1, 2020) and number of separations in the past year Human resources staff size and number of separations in the past year CHRO reporting relationship Whether collective bargaining exists for the following groups: Full-time faculty Part-time or adjunct faculty Full-time staff Graduate studentsBasic information on total expenses as well as student, faculty, and staff size were requiredquestions. All other questions were optional.8See the Faculty Survey Participation and Information Template (SPIT) for more specific information about the datacollected on this year’s survey, as well as the instructions provided to participants.9
2021 CUPA-HR10FACULT Y IN HIGHER EDUC ATION ANNUAL REPORTR E SPONDENTSRespondents were largely human resources professionals and institutional research professionalsfrom higher education institutions in the U.S.9 There were 793 institutions that completed thesurvey (Table 1). All participating institutions are listed in Appendix B.Table 1. Number of Responding Institutions by Classification and ’s00107107Special Focus/Other5191272Total Participants194197402793Total N for This Report1431883907219Special focus/other institutions (n 72) were excluded from the analyses of full-time faculty in this report. Specialfocus/other institutions include medical/law institutions, tribal colleges, research foundations, internationalinstitutions, for-profit institutions, higher ed affiliates, and unclassified institutions that typically have muchdifferent salary structures than traditional institutions and differ greatly from each other, so reporting them as asingle category is not appropriate. Although their data were not analyzed for this report, their data are available forbenchmarking in DataOnDemand, and their names appear in the participant list in Appendix B. They are includedas “Other” institutions in Table 2.
2021 CUPA-HRFACULT Y IN HIGHER EDUC ATION ANNUAL REPORTAcknowledgmentsCUPA-HR’s Faculty in Higher Education Annual Report provides data on salaries and demographicinformation for faculty employed in a cross-section of the nation’s colleges and universities.We are indebted to the human resources professionals, institutional research professionals, andprofessionals working in the office of the provost of the colleges and universities who completedthe survey.In the CUPA-HR national office, our research department staff coordinated and reviewed allaspects of survey analysis and report production. To ensure the accuracy of data, the researchstaff conducted numerous outlier and validation checks with those responsible for completing thesurvey. Peerfocus, Inc., our partner and collaborator in Surveys Online, provided web-based datacollection, automated validation checks, and table generation. This report was designed, reviewed,edited, and marketed by members of our research, communications and marketing, and executiveteams, acknowledged below.CUPA-HR RESEARCH STAFFJacqueline Bichsel, Ph.D. Director of ResearchSarah Nadel-Hawthorne, Ph.D. Survey ResearcherMelissa Fuesting, Ph.D. Survey ResearcherAnthony Schmidt, M.S.Ed. Data Visualization ResearcherSuzi Bowen, M.A. Research Operations ManagerCUPA-HR COMMUNICATIONS AND MARKETING STAFFGayle KiserDirector of Communications and MarketingMissy Kline Project ManagerErin Rosolina Marketing ManagerJeremy Longmire Sr. Graphic Designer and Website CoordinatorCUPA-HR EXECUTIVE REVIEWERSAndy Brantley President and Chief Executive OfficerRob Shomaker Senior Vice President11
2021 CUPA-HRFACULT Y IN HIGHER EDUC ATION ANNUAL REPORTAppendix A. Comprehensive TablesThe salaries provided in these tables are annualized, full-time (1.0 FTE) salaries based on9-10-month contracts. Like the annual report itself, salaries from for-profit institutions, highered affiliates, and special focus institutions are not included. The tables in this appendix reportaverage, median, minimum, and maximum salaries.10 The median divides salaries in half: 50% of allreported salaries fall above or below this salary. The median is a more reliable measure than themean (average) in distributions that are skewed (containing a few extremely low or — in the case ofmost salary data — high numbers).These tables also provide an additional statistic called a “salary factor.” The salary factor is theratio, for a given academic rank and discipline, of the average salary to the average salary across alldisciplines. It provides a standardized market value of sorts for each discipline. Disciplines/rankswith salary factors greater than 1.00 pay more than average. Those with salary factors less than1.00 pay less than average.All salaries reported are unweighted, and data is reported only for positions having at least fiveresponding institutions.1110 The tables in Appendix A provide a large-scope picture of faculty salaries. To benchmark faculty salaries usingcustom comparison groups, or to view salaries by gender, race/ethnicity, age, or years in rank, higher ed institutionsshould subscribe to DataOnDemand.11 Both annual reports and DataOnDemand follow Department of Justice safe harbor guidelines for antitrustregulations. An explanation of these guidelines can be found here: 7/02/antitrust regul.html.A1
2021 CUPA-HRFACULT Y IN HIGHER EDUC ATION A NNUA L REPORTComprehensive Tables 2-Digit CIPBY AFFILIATIONTenure TrackPublic A4TA B LESAV A IL A BL E INPrivate Independent A11FU LL R EP O R TPrivate Religious A18Non-Tenure TeachingPublic A25Private Independent A31Private Religious A37Non-Tenure ResearchPublic A43Private Independent A50Private Religious A57BY CL A S SIFIC ATIONTenure TrackDoctoral A64Master’s A71Baccalaureate A78Associate’s A85Non-Tenure TeachingDoctoral A92Master’s A98Baccalaureate A104Associate’s A110Non-Tenure Research (Doctoral Only)Doctoral A116A2
2021 CUPA-HRFACULT Y IN HIGHER EDUC ATION A NNUA L REPORTDEMOGR APHICSTenure TrackSex A123Minority Status A130Non-Tenure TeachingSex A137Minority Status A143Non-Tenure ResearchSex A149Minority Status A156Comprehensive Tables 4-Digit CIPBY AFFILIATIONPublic A163Private Independent A234Private Religious A305BY CL A S SIFIC ATIONDoctoral A376Master’s A447Baccalaureate A518Associate’s A589BY TENUR E S TATUSTenure Track A660Non-Tenure Teaching A731Non-Tenure Research A784A3
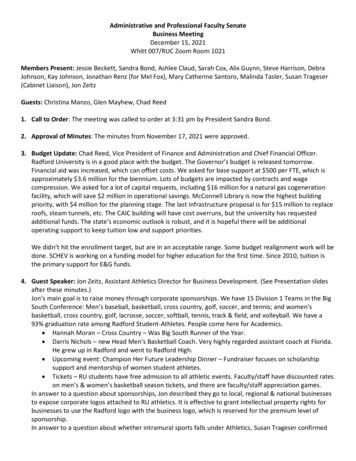
2021 CUPA-HRFACULT Y IN HIGHER EDUC ATION ANNUAL REPORTAppendix B. Participating InstitutionsB1
InstitutionClassificationAffiliationEntity TypeCensus RegionA. T. Still University of Health SciencesSpecialPrivate IndependentSingle Unit InstitutionMidwestAbilene Christian UniversityMaster'sPrivate ReligiousSingle Unit InstitutionSouthAdams State UniversityMaster'sPublicSingle Unit InstitutionWestAdelphi UniversityDoctoralPrivate IndependentSingle Unit InstitutionNortheastAims Community CollegeAssociate'sPublicSingle Unit InstitutionWestAlbany College of Pharmacy and HealthSpecialPrivate IndependentSingle Unit InstitutionNortheastAlbertus Magnus CollegeMaster'sPrivate IndependentSingle Unit InstitutionNortheastAlbion CollegeBaccalaureatePrivate ReligiousSingle Unit InstitutionMidwestAlbright CollegeBaccalaureatePrivate ReligiousSingle Unit InstitutionNortheastAlcorn State UniversityMaster'sPublicInstitution Within a SystemSouthAlexandria Technical & Community College Associate'sPublicInstitution Within a SystemMidwestAlfred State CollegeBaccalaureatePublicInstitution Within a SystemNortheastAlfred UniversityMaster'sPrivate IndependentS
This marks the 40th year of data collection for the CUPA-HR Faculty in Higher Education Survey, which was piloted in 1981-82. Broadly, the survey collects data on full-time faculty by instructional program, tenure type, and rank (defined later in the introduction), as well as aggregate data for adjunct (pay-per-course) faculty.