Transcription
California Emergency Departments: Use Grows as Coverage ExpandsAUGUST 2018
Executive SummaryCalifornia’s emergency departments (EDs) provide a critical source of health care to people experiencing acute medicalconditions or suffering from trauma and injury, and are expected to treat all patients regardless of their ability to pay. Theyalso provide an important entry point for inpatient hospital care. In 2016, 334 acute care hospitals in California operatedEDs. The number of EDs has remained relatively stable since 2006, while the number of individual treatment stationswithin them has grown by 1,802 to reach 7,889 in 2016. California’s EDs handled 14.6 million visits in 2016, an increase of44% since 2006.California’s Emergency Departments: Use Grows as Coverage Expands looks at the most recent data on supply, patient visits,and the quality of emergency departments in California, as well as trends from 2006 to 2016. Long ED stays may be a signCalifornia Emergency DepartmentsCONTENTSSupply. . . . . . . . . . . . . . . . . . . . . . . . . . . . . . . . . . 3Patient Visits. . . . . . . . . . . . . . . . . . . . . . . . . . . . . 7Ambulance Diversion. . . . . . . . . . . . . . . . . . . . 16Patients Not Seen. . . . . . . . . . . . . . . . . . . . . . . 18that the ED is overcrowded or understaffed, or that there is a lack of available inpatient beds.Wait Times. . . . . . . . . . . . . . . . . . . . . . . . . . . . . . . 19KEY FINDINGS INCLUDE:Methodology. . . . . . . . . . . . . . . . . . . . . . . . . . . . 22 The supply of ED treatment stations increased in regions throughout the state, even those that experienceda decrease in emergency departments. Use of EDs varied widely across California, from a low of 311 visits perAppendix. . . . . . . . . . . . . . . . . . . . . . . . . . . . . . . . 231,000 residents in Orange County to a high of 516 in Northern and Sierra Counties. Medi-Cal was the expected payer for 43% of all ED visits in 2016, compared to 26% for private payers and 21%for Medicare. Approximately one in every eight ED visits resulted in a hospital admission. Still, there were many seriousconditions among patients who were not admitted, including one in ten visits classified as severe and posingimmediate threat to life or physical function. California ED patients who were sent home spent nearly three hours in the ED, 24 minutes longer than themedian stay nationwide. California ED patients who were admitted spent over five and a half hours in the ED,an hour longer than the national median.CALIFORNIA HEALTH CARE FOUNDATION2
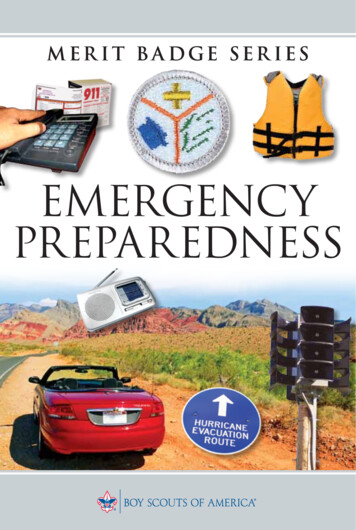
California Emergency DepartmentsGeneral Acute Care Hospitals, by ED LevelSupplyCalifornia, 2016In 2016, 80% of California’s generalacute care (GAC) hospitals operateda licensed emergency departmentGAC HospitalsWithoutLicensed ED20%(ED). EDs provide different levels ofservice. The majority are licensed atComprehensivethe basic level.(2%)ED LevelTOTALGAC HOSPITALS420Standby8%Basic70%Notes: Basic level emergency departments (EDs) have an ED physician on staff 24 hours a day, year-round. Comprehensive level EDs have an ED physician on staff 24 hours a day yearround, as well as other physician specialties (including, but not limited to, thoracic surgeons, neurosurgeons, orthopedic surgeons, and pediatricians) 24 hours a day year-round. Thehospital must also provide burn, acute dialysis, and cardiovascular surgery services. Standby level EDs have an ED physician, at minimum, on call.Source: Office of Statewide Health Planning and Development, Hospital Annual Utilization Data, 2016.CALIFORNIA HEALTH CARE FOUNDATION3
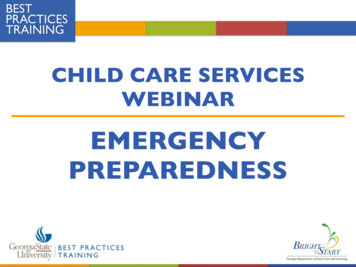
California Emergency DepartmentsTrauma Centers, by LevelSupplyCalifornia, 2016Trauma centers are an importantsubset of emergency departments;they treat patients with traumaticLevel IV13%Level I19%injury. Local Emergency MedicalServices Agencies designate traumacenters according to level, basedLevel III16%on the equipment and resourcesTOTALTR AUMA CE NTE RS79available. Level 1 is the highest.In 2016, California had 79 traumacenters, 15 of which were Level 1.Level II52%Notes: Trauma centers are designated by a local Emergency Medical Services Agency (EMSA) and include personnel, services, and equipment necessary for the care of trauma patients.General requirements include a trauma program medical director, a trauma nurse coordinator, a basic emergency department (minimum), a multidisciplinary trauma team, andspecified service capabilities. EMSA has established four trauma center designations, with Level 1 being the highest.Sources: Office of Statewide Health Planning and Development, Hospital Annual Utilization Data, 2016; California Emergency Medical Services Authority, emsa.ca.gov.CALIFORNIA HEALTH CARE FOUNDATION4
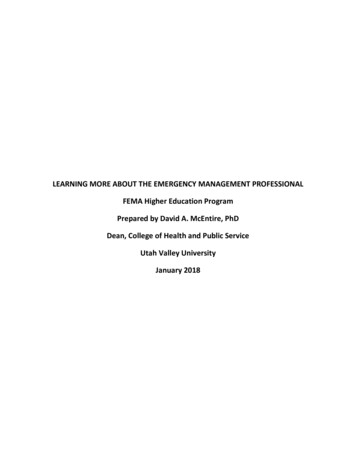
California Emergency DepartmentsEmergency Departments and Treatment StationsSupplyCalifornia, 2006 to 2016While the number of emergencyEMERGENCY DEPARTMENTSTREATMENT STATIONS9,0007,8898,000departments has remained relativelystable over the past 10 years, thenumber of treatment stations hasincreased by 20132014201520161,000Note: A treatment station is a specific place within the emergency department adequate to treat one patient at a time.Source: Office of Statewide Health Planning and Development, Hospital Annual Utilization Data, 2006–2016.CALIFORNIA HEALTH CARE FOUNDATION5
Emergency Departments and Treatment Stationsby Region, California, 2006 vs. 2016California Emergency DepartmentsSupplyThe number of treatment stationsEMERGENCY DEPARTMENTSTREATMENT STATIONSincreased even in regions thatexperienced a decrease in the20062016CHANGE20062016CHANGECentral Coast24240%32041623%Greater Bay Area64652%1,2401,54520%Inland Empire32359%63482023%Los Angeles County7675– 1%1,5441,96021%Northern and Sierra4038– 5%34442519%of emergency departments, butOrange County26260%51864620%added more than 200 newSacramento Area1615– 6%35247326%treatment stations.San Diego Area20200%47673335%San Joaquin Valley3936– 8%65987124%337334– 1%6,0877,88923%Californianumber of emergency departments.For example, San Joaquin Valleyexperienced a decline in the numberNotes: See the appendix for a map of counties in each region. A treatment station is a specific place within the emergency department adequate to treat one patient at a time.Source: Office of Statewide Health Planning and Development, Hospital Annual Utilization Data, 2006–2016.CALIFORNIA HEALTH CARE FOUNDATION6
California Emergency DepartmentsEmergency Department VisitsPatient Visitsper 1,000 Population and Total, California, 2006 to 2016Between 2006 and 2016, theTOTAL VISITS VISITS PER 1,000 POPULATION(IN MILLIONS)14.6161412number of emergency departmentvisits increased by 44%, while thestate’s overall population increasedby 9%. The number of visits per1,000 residents increased by 9.039.3P O P U L AT I O N ( I N M I L L I O N S )36.036.336.637.037.337.738.0Sources: Author calculations based on Office of Statewide Health Planning and Development, Emergency Department Data and Patient Discharge Data, 2006–2016; United States CensusBureau, Intercensal Estimates of the Residential Population for Counties of California: April 1, 2000 to July 1, 2010, and Annual Estimates of the Resident Population: April 1, 2010 to July 1, 2016.CALIFORNIA HEALTH CARE FOUNDATION7
California Emergency DepartmentsEmergency Department Visits per 1,000 PopulationPatient Visitsby Region, California, 2016A D M I S S I ONR AT E355Central CoastGreater Bay Area12%12%39313%15%516Northern and SierraOrange County311San Diego Areain the Northern and Sierra region.11%1,000 residents across regions, thepercentage of ED patients admittedto the hospital was fairly consistent.16%410Sacramento Areain Orange County to a high of 516Despite a wide range in ED visits per364Los Angeles Countyper 1,000 residents varied widelyacross the state, from a low of 311339Inland EmpireEmergency department (ED) visits12%31815%451San Joaquin ValleyOVERALL: 37111%13%Note: See the appendix for a map of counties in each region.Sources: Author calculations based on Office of Statewide Health Planning and Development, Emergency Department Data and Patient Discharge Data, 2016;United States Census Bureau, Annual Estimates of the Resident Population: April 1, 2010 to July 1, 2016.CALIFORNIA HEALTH CARE FOUNDATION8
Emergency Department Visits per Treatment StationCalifornia, 2006 to 2016California Emergency DepartmentsPatient VisitsIn 2016, the average Californiaemergency department treatment1,724 1,691 1,686 1,695 1,683 1,7331,656 1,677 1,6732006200720082009201020112012201320141,802 1,846station handled over 1,800 visits, orapproximately five visits per day.20152016Source: Author calculations based on Office of Statewide Health Planning and Development, Utilization Data, 2006–2016.CALIFORNIA HEALTH CARE FOUNDATION9
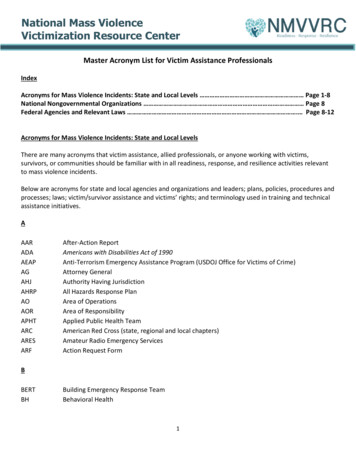
Emergency Department Visits, by Expected PayerCalifornia, 2006 and 2016California Emergency DepartmentsPatient VisitsThe number of Medi-Cal emergencydepartment (ED) visits almost2006OtherOther7%Self-Pay/Uninsured16%TOTA L10.1 milliondoubled between 2006 and while self-pay/uninsured visitsdeclined. In 2016, Medi-Cal was the3%expected payer (i.e., the entity thatPrivate26%TOTAL14.6 millionMedicare19%the hospital expected to pay for thevisit) for 43% of ED visits, comparedwith 23% in 2006. Under the ACA,which went into full effect in 2014,California expanded Medi-Cal to allMedi-Cal23%Medi-Cal43%low-income adults. Between 2006and 2016, the number of Medi-Calenrollees doubled.Notes: Self-pay/uninsured includes county indigent and other indigent programs. Other includes disability, Veterans Affairs, Workers’ Compensation, and other federal/non-federal programs.Source: Author calculations based on Office of Statewide Health Planning and Development, Emergency Department Data and Patient Discharge Data, 2006 and 2016.CALIFORNIA HEALTH CARE FOUNDATION10
California Emergency DepartmentsED Visits, by Expected Payer and RegionPatient VisitsCalifornia, 2016Medi-CalThe payer mix of emergencyMedicareNorthern and SierraOrange CountySacramento AreaSan Diego Area23%34%24%19%44%28%39%23%42%25% 6% 4%region. In Orange County and thecoverage was the expected payer for22% 7% 3%30% of visits. In San Joaquin Valley,27% 8%Medi-Cal was expected to pay for2%19% 5% 4%over half of ED visits.27% 6% 4%17%21%Greater Bay Area, private insurance25% 6% 3%24%56%43%department (ED) visits varied by30% 6% 2%24%40%San Joaquin ValleyCalifornia19%43%Other30% 7% 5%49%Inland EmpireLos Angeles CountySelf-Pay/Uninsured42%Central CoastGreater Bay AreaPrivate19% 5% 2%26% 7% 3%Notes: Other includes disability, Veterans Affairs, Workers’ Compensation, and other federal/non-federal programs. Segments may not sum to 100% due to rounding.Source: Office of Statewide Health Planning and Development, Emergency Department Outpatient and Inpatient Data, 2016.CALIFORNIA HEALTH CARE FOUNDATION11
California Emergency DepartmentsEmergency Department Visits, by Acuity LevelCalifornia, 2006 to 2016VISITSPatient VisitsMinorLow/ModerateModerateSevere Without ThreatSevere With Threat(IN MILLIONS)65.35are classified by acuity level, fromminor to “severe with threat,” whichmeans the patient’s life could bein danger. While visits classified asmoderate represented the largest43.63.33All emergency department visitsproportion of visits, the percentageof severe visits (with and without2.62.12.52.32threat) increased from 32% in 2006to 42% in 420152016Notes: Emergency department visits are categorized based on type of history/examination and medical decisionmaking required. A minor visit requires a problem-focused history/examination and straightforward medical decisionmaking. A low/moderate visit requires expanded problem-focused history/examination and medical decisionmaking of lowcomplexity. A moderate visit requires expanded problem-focused history/examination and medical decisionmaking of moderate complexity. A severe without threat visit requires adetailed history/examination and medical decisionmaking of moderate complexity. A severe with threat visit requires a comprehensive history/examination and medical decisionmakingof high complexity. Excludes visits with unknown/unreported severity.Source: Office of Statewide Health Planning and Development, Hospital Annual Utilization Data, 2006–2016.CALIFORNIA HEALTH CARE FOUNDATION12
California Emergency DepartmentsEmergency Department VisitsPatient Visitsby Acuity Level of Those Not Admitted, California, 2016Emergency Department VisitsN 14.6 millionAcuity Level of Those Not Admitted11%Admitted13%The majority of emergency25%department visits did not result ina hospital admission. One in ten— Severe With Threat— Severe Without Threatvisits for patients not admittedwere for conditions severe enoughto be life-threatening, and anadditional one in four visits werefor severe conditions without threat40%— Moderate18%— Low/Moderate6%— Minor(e.g., an elderly patient who felland was unable to walk).Not Admitted87%Notes: Emergency department visits are categorized based on type of history/examination and medical decisionmaking required. A minor visit requires a problem-focused history/examination and straightforward medical decisionmaking. A low/moderate visit requires expanded problem-focused history/examination and medical decisionmaking of lowcomplexity. A moderate visit requires expanded problem-focused history/examination and medical decisionmaking of moderate complexity. A severe without threat visit requires adetailed history/examination and medical decisionmaking of moderate complexity. A severe with threat visit requires a comprehensive history/examination and medical decisionmakingof high complexity. Excludes visits with unknown/unreported severity.Source: Office of Statewide Health Planning and Development, Hospital Annual Utilization Data, 2016.CALIFORNIA HEALTH CARE FOUNDATION13
California Emergency DepartmentsEmergency Department Visits, by DiagnosisPatient VisitsCalifornia, 2016Injuries and poisonings ry System10.4%Digestive Systemreasons for visiting the emergencydepartment, accounting for onein five visits in 2016.7.1%Musculoskeletal SystemGenitourinary Systemamong the most common6.4%5.6%Circulatory System4.3%Mental Disorders4.2%InfectionsSkin Disorders4.0%3.9%Pregnancies2.6%Nervous System2.5%Not shown: other (2.6%), ear disorders (2.0%), endocrine diseases (1.9%), eye disorders (1.0%), blood disorders (0.5%), cancer (0.5%), perinatal disorders (0.1%), birth defects/births (0.0%).Source: Office of Statewide Health Planning and Development, Emergency Department Outpatient and Inpatient Data, 2016.CALIFORNIA HEALTH CARE FOUNDATION14
California Emergency DepartmentsEmergency Department Visits, by AgePatient VisitsCalifornia, 2016Adults age 20 to 49 accounted for70 to 797%80 7%four in ten emergency department 13%encounters, and adults age 50 to69 accounted for almost one in1 to 911%four visits.10 to 199%50 to 6923%TOTAL E D V IS ITS14.6 million20 to 4940%Note: Segments don’t sum to 100% due to rounding.Source: Office of Statewide Health Planning and Development, Emergency Department Outpatient and Inpatient Data, 2016.CALIFORNIA HEALTH CARE FOUNDATION15
California Emergency DepartmentsAmbulance Diversion HoursAmbulance DiversionCalifornia, 2006 to 2016Ambulance diversion occurs whenTOTAL NUMBER OF HOURS EDs CLOSED TO AMBULANCESa hospital redirects ambulances to200,000nearby hospitals. Overcrowding in182,642the emergency department (ED)175,000is the most common reason anambulance is diverted. Ambulance150,000diversion can have many negative125,000consequences, from increasingambulance turnaround time, to100,00094,68775,000reducing patient quality of care, tonegatively impacting ED capacityat nearby hospitals. Diversion hours50,000in California decreased by 48%25,000between 2006 and ources: Office of Statewide Health Planning and Development, Hospital Annual Utilization Data, 2006–2016; “Health Policy Brief: Ambulance Diversion,” Health Affairs, June 2, 2016,www.healthaffairs.org.CALIFORNIA HEALTH CARE FOUNDATION16
20062016CHANGE – % % – % – % % TOTAL NUMBER OF HOURS EMERGENCY DEPARTMENTS CLOSED TO AMBULANCES – % – % – % – % – % ( ) “ ” emsa.ca.gov 17
ED Visits from Patients Who Left Without Being SeenCalifornia, 2006 to 2016in the emergency department (ED)374,872but left before being treated by an363,0822007emergency tient Not SeenIn 2016, 326,587 patients registered20062012California Emergency Departments326,587Source: Office of Statewide Health Planning and Development, Hospital Annual Utilization Data, 2006–2016.CALIFORNIA HEALTH CARE FOUNDATION18
California Emergency DepartmentsEmergency Department Wait TimesWait TimesCalifornia, 2014 to 2016MEDIAN TIMELong stays in an emergency2014 2015 2016(IN MINUTES)department (ED) may be a signthat the ED is overcrowded or330 343 341understaffed, or that there is a lackof available inpatient beds. In 2016,the median stay for patients whowere sent home was nearly threehours. Those being admitted stayedin the ED for over five hours on165 167 162127 134 138average, with two of those hoursoccuring after the doctor decidedto admit them.Length of StayDischarged PatientsLength of StayBoarding TimeAdmitted PatientsNote: Boarding time is the amount of time patients spent in the emergency department (ED) after the doctor decided to admit them as an inpatient before leaving the ED for their room.Source: US Centers for Medicare & Medicaid Services, Hospital Compare, data.medicare.gov/data/hospital-compare.CALIFORNIA HEALTH CARE FOUNDATION19
California Emergency DepartmentsEmergency Department Wait TimesWait TimesCalifornia vs. United States, 2016MEDIAN TIMEIn 2016, the median stay forCalifornia United States(IN MINUTES)California emergency departmentpatients who were sent home341was nearly three hours. That is24 minutes longer than the280162138median stay nationwide.138100Length of StayLength of StayDischarged PatientsBoarding TimeAdmitted PatientsNote: Boarding time is the amount of time patients spent in the emergency department (ED) after the doctor decided to admit them as an inpatient before leaving the ED for their room.Source: US Centers for Medicare & Medicaid Services, Hospital Compare, data.medicare.gov.CALIFORNIA HEALTH CARE FOUNDATION20
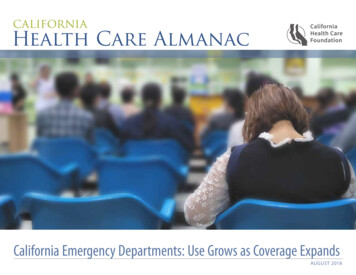
Length of ED Stay for Admitted Patients, by CountyCalifornia, 2013 to maMendocinoGlenn 195 to 284 minutes 328 to 352 minutes 286 to 320 minutes 354 to 478 minutesPlumasButteSierraNevadaPlacerYubaSutterEl DoradoYoloSonomaAlpineSacraNapamento AmadorSolanoCalaverasMarinTuolumneSanContra JoaquinCostaSan FranciscoAlameda Stanislaus MariposaSan MateoSantaMercedClaraMaderaSanta CruzFresnoSanBenitoLake ColusaMontereyWait TimesThe amount of time patients spentTime from ED Arrival to DepartureAdmitted Patients, by QuartileLassenCalifornia Emergency Departmentsin the emergency departmentbefore being admitted varied bycounty. Patients in Madera Countyhad the longest wait time (nearlyOverall: 340 minuteseight hours) while patients inColusa County had the shortestMono(under four hours).InyoTulareKingsSan LuisObispoSanta BarbaraKernSan BernardinoVenturaLos AngelesOrangeRiversideSan DiegoImperialNotes: ED is emergency department. Data covers Q2 2013 to Q1 2014.No data are available for counties without color. Does not necessarily include general acute care hospitals exclusively.Source: “Hospital Report,” IPRO, accessed May 26, 2015, www.whynotthebest.org.CALIFORNIA HEALTH CARE FOUNDATION21
California Emergency DepartmentsMethodologyThe California Health Care Almanac is an onlineThis analysis relies primarily on data obtained from reports submitted by licensed hospitals toclearinghouse for data and analysis examiningCalifornia’s Office of Statewide Health Planning and Development (OSHPD), which conducts anthe state’s health care system. It focuses on issuesannual standardized survey required from all hospitals in California. These include private PatientDischarge Data, Emergency Department Data, and Hospital Annual Utilization Data. Data wereABOUT THIS SERIESof quality, affordability, insurance coverage andthe uninsured, and the financial health of thesystem with the goal of supporting thoughtfulused to evaluate emergency department (ED) capacity and utilization trends in California hospitalsplanning and effective decisionmaking. Learnfrom 2006 to 2016. All general acute care hospitals with an ED (standby, basic, and comprehensive)more at www.chcf.org/almanac.that was open at any time in the year during the study period were included.AU T H O RRenee Y. Hsia, MD, MSc, is professor of emergencymedicine and health policy at the University ofCalifornia, San Francisco (UCSF).ACKNOWLEDGMENTSMatthew Niedzwiecki, PhD, is assistant professorof emergency medicine and health policyat UCSF, and Sarah Sabbagh, MPH, is healthpolicy research associate in the department ofemergency medicine at UCSF.F O R M O R E I N F O R M AT I O NCalifornia Health Care Foundation1438 Webster Street, Suite 400Oakland, CA 94612510.238.1040www.chcf.orgCALIFORNIA HEALTH CARE FOUNDATION22
California Emergency DepartmentsAppendix: California Counties Included in RegionsNORTHERNAND SIERRASACRAMENTOAREAGREATERBAY AREANORTHERNAND SIERRAREGIONCOUNTIESCentral CoastMonterey, San Benito, San Luis Obispo, Santa Barbara,Santa Cruz, VenturaGreater Bay AreaAlameda, Contra Costa, Marin, Napa, San Francisco,San Mateo, Santa Clara, Solano, SonomaInland EmpireRiverside, San BernardinoLos Angeles CountyLos AngelesNorthern and SierraAlpine, Amador, Butte, Calaveras, Colusa, Del Norte, Glenn,Humboldt, Inyo, Lake, Lassen, Mariposa, Mendocino,Modoc, Mono, Nevada, Plumas, Shasta, Sierra, Siskiyou,Sutter, Tehama, Trinity, Tuolumne, YubaOrange CountyOrangeSacramento AreaEl Dorado, Placer, Sacramento, YoloSan Diego AreaImperial, San DiegoSan Joaquin ValleyFresno, Kern, Kings, Madera, Merced, San Joaquin,Stanislaus, TulareCENTRALCOASTSAN JOAQUINVALLEYINLANDEMPIRELOS ANGELESCOUNTYORANGECOUNTYCALIFORNIA HEALTH CARE FOUNDATIONSAN DIEGO AREA23
EDs. The number of EDs has remained relatively stable since 2006, while the number of individual treatment stations 44% since 2006. California's Emergency Departments: Use Grows as Coverage Expands looks at the most recent data on supply, patient visits, and the quality of emergency departments in California, as well as trends from 2006 to 2016.