Transcription
Student Affairs Administratorsin Higher ATALANDSCAPE ANALYSIS ofEMERGENCY AIDPROGRAMSKevin Kruger, Amelia Parnell, and Alexis Wesaw
Student Affairs Administratorsin Higher EducationCopyright 2016 by the National Association of Student Personnel Administrators (NASPA), Inc.All rights reserved. NASPA does not discriminate on the basis of race, color, national origin,religion, sex, age, gender identity, gender expression, affectional or sexual orientation, ordisability in any of its policies, programs, and services.
LANDSCAPE ANALYSIS ofEMERGENCY AIDPROGRAMSKevin KrugerPresident, NASPAAmelia ParnellVice President for Research and Policy, NASPAAlexis WesawDirector of Data Analytics, NASPA Student Affairs Administratorsin Higher Education
ABOUT NASPANASPA–Student Affairs Administrators in Higher Education is the leading association forthe advancement, health, and sustainability of the student affairs profession. We serve afull range of professionals who provide programs, experiences, and services that cultivatestudent learning and success in concert with the mission of our colleges and universities.Founded in 1919, NASPA comprises more than 13,000 members in all 50 states, 25 countries,and 8 U.S. Territories.Through high-quality professional development, strong policy advocacy, and substantiveresearch to inform practice, NASPA meets the diverse needs and invests in realizing thepotential of all its members under the guiding principles of integrity, innovation, inclusion, andinquiry. NASPA members serve a variety of functions and roles, including the vice presidentand dean for student life, as well as professionals working within housing and residence life,student unions, student activities, counseling, career development, orientation, enrollmentmanagement, racial and ethnic minority support services, and retention and assessment.ACKNOWLEDGMENTSNASPA collaborated with Gates Bryant and Abigail Callahan at Tyton Partners to developinterview guides and a national survey to explore the landscape of emergency aid programsacross the United States. This work was also guided by an advisory committee, and NASPAthanks Kathryn T. Hutchinson, PhD; Richard Walker, EdD; Paulette Dalpes, EdD; and ChrisMeiers, PhD, for their valuable contributions.
ContentsList of Figures . . . . . . . . . . . . . . . . . . . . . . . . . . . . . . . . . . . . . . . . . . 6List of Tables . . . . . . . . . . . . . . . . . . . . . . . . . . . . . . . . . . . . . . . . . . 7Executive Summary . . . . . . . . . . . . . . . . . . . . . . . . . . . . . . . . . . . 9Overview . . . . . . . . . . . . . . . . . . . . . . . . . . . . . . . . . . . . . . . . 15Administration . . . . . . . . . . . . . . . . . . . . . . . . . . . . . . . . . . . . . 25Identification . . . . . . . . . . . . . . . . . . . . . . . . . . . . . . . . . . . . . . . 25Procedures . . . . . . . . . . . . . . . . . . . . . . . . . . . . . . . . . . . . . . . . 26Timing . . . . . . . . . . . . . . . . . . . . . . . . . . . . . . . . . . . . . . . . . . . 27Integration . . . . . . . . . . . . . . . . . . . . . . . . . . . . . . . . . . . . . . . . . 28Communication . . . . . . . . . . . . . . . . . . . . . . . . . . . . . . . . . . . . . 31Marketing . . . . . . . . . . . . . . . . . . . . . . . . . . . . . . . . . . . . . . . . . 31Recurrence . . . . . . . . . . . . . . . . . . . . . . . . . . . . . . . . . . . . . . . . 37Sustainability . . . . . . . . . . . . . . . . . . . . . . . . . . . . . . . . . . . . . . 41Governance . . . . . . . . . . . . . . . . . . . . . . . . . . . . . . . . . . . . . . . . 41Financing . . . . . . . . . . . . . . . . . . . . . . . . . . . . . . . . . . . . . . . . . 43Stewardship . . . . . . . . . . . . . . . . . . . . . . . . . . . . . . . . . . . . . . . . 47Data . . . . . . . . . . . . . . . . . . . . . . . . . . . . . . . . . . . . . . . . . . . . 47Conclusion . . . . . . . . . . . . . . . . . . . . . . . . . . . . . . . . . . . . . . . 51Appendix: Methodology . . . . . . . . . . . . . . . . . . . . . . . . . . . . . . . . 55References . . . . . . . . . . . . . . . . . . . . . . . . . . . . . . . . . . . . . . . . . . . 58
List of Figures1Delivery of Emergency Aid Across 2- and 4-YearPublic and Private Institutions (n 439)112Primary Communication Methods for Emergency Aid123Select Funding Sources for Emergency Aid Programs124Extent to Which Different Objectives Influenced theDevelopment of Emergency Aid Programs (n 444)165Percentage of Institutions With an Emergency Aid Program (N 706)176Delivery of Emergency Aid Programs Across 2- and4-Year Public and Private Institutions (n 439)187Percentage of Institutions With Each Type ofEmergency Aid Program, by Sector198Number of Emergency Aid Types at Each Institution, by Sector199Percentage of Institutions That Require anApplication, by Type of Emergency Aid2610Percentage of Institutions That Require an Application,by Type of Emergency Aid and Sector2711Faculty and Staff Involvement in the Process ofProviding Emergency Aid (n 381)2912Percentage of Institutions That Use Data to Proactively IdentifyStudents Who May Benefit From Emergency Aid (n 387)3413Information Used by Institutions to Proactively IdentifyStudents Who May Benefit From Emergency Aid (n 89)3514Information Used by Institutions to Proactively Identify StudentsWho May Benefit From Emergency Aid, by Sector3515Percentage of Institutions That Follow Up With Students AfterThey Receive Some Form of Emergency Aid (n 381)3816Services That Are Most Beneficial to StudentsWho Experience Emergencies (n 380)3817Percentage of Institutions Currently Assisting AllStudents Who Request Emergency Aid (n 444)4318Percentage of Institutions That Maintain a Record ofStudents Who Receive Emergency Aid (n 379)4819Extent to Which Tools or Resources Are Used by Institutionsto Meet the Following Objectives (n 377)49
List of Tables1Primary Types of Emergency Aid102Number of Years Emergency Aid Programs Have Been in Existence17310 Components That Define a Robust Emergency Aid Program204Details of Emergency Aid Programs225Level of Cross-Departmental Collaboration inSupport of Emergency Aid at Institutions286Primary Communication Channels to Inform StudentsAbout Emergency Aid Opportunities327Factors That Prevent Institutions From Using Data to ProactivelyIdentify Students Who May Benefit From Emergency Aid368Frequency With Which Students Who Received Emergency Aid AreReferred to the Additional Support Services Selected in Figure 16399Barriers to Coordinating Additional Support Servicesfor Students Who Received Emergency Aid3910Barriers to Serving a Greater Number of Students With Emergency Aid4211Frequency With Which a Student Is Denied EmergencyAid Because of Institutional Resource Constraints4412Primary Source of Funding, by Type of Emergency Aid4513Mechanisms Used to Track Students Who Receive Emergency Aid4814Distribution of Respondents, by Institution Functional Area5615Distribution of Respondents, by Institution Sector5616Definitions of Six Types of Emergency Aid57
TEXECUTIVE SUMMARYhere is no shortage of discussion on how college costs affect students’persistence toward a degree. Ample research has shown that one barrierto timely degree completion is students’ ability to cover their necessaryexpenses. Although students and their families are expected to planfor the cost of tuition, fees, housing, and textbooks, for many students thereremains a possibility that other unforeseen expenses—ones that students maynot be prepared to address—may also arise. Such expenses, often connectedto an emergency, can be so significant that they result in students deciding totake a break or fully withdraw from their institutions. College administratorsare becoming increasingly aware of the likelihood that students may at somepoint experience an unexpected financial crisis and, in preparation for suchuntimely events, are operating emergency aid programs.Prior research on emergency aid has focused on programs that were designed and fundedby foundations and other organizations and were implemented by a small group of highereducation institutions. For example, in 2008, MDRC examined the efficacy of two emergency aid programs funded by Lumina Foundation: the Angel Fund Emergency Financial AidProgram, which supported 26 tribal colleges, and the Dreamkeepers Emergency Financial AidProgram, which supported 10 community colleges (see Geckeler, Beach, Pih, & Yan, 2008). TheGreat Lakes Higher Education Guaranty Corporation (2016) recently reported on the resultsof its emergency grant program at 16 colleges in the Wisconsin Technical College System.Although these studies certainly offered valuable insight into the influence of emergencyaid on student success, a data gap still remained regarding programs that were started by aninstitution and supported primarily with institutional resources. The Association of Public andLand-grant Universities (APLU), in partnership with the Coalition of Urban Serving Universities(USU), examined the use of completion grants.1 However, specific areas in need of more1Completion grants, sometimes referred to as “retention grants” or “gap grants,” are programs specifically designed to targetstudents who have genuine unmet financial need and have used all other sources of aid, are on track for graduation in thenext semester or year, and have an outstanding financial gap that will require them to drop out (see APLU & USU, 2016).LANDSCAPE ANALYSIS OF EMERGENCY AID PROGRAMS 2016 NASPA9
Table 1 Primary Types of Emergency AidType of AidPrimary UseCampus vouchersCover materials from the bookstore or meals from the dining hall; few barriers todistributionCompletionCover outstanding balances for students poised to graduate or continue to the nextscholarshipssemesterEmergency loansAddress hardship related to the timing of a student’s financial aid disbursementFood pantriesAddress food insecurity on campusRestricted grantsSupport students who experience unexpected hardship; typically require thatstudents meet certain academic or other requirementsUnrestricted grantsSupport students who experience unexpected hardship; typically awarded withoutrestrictionsexploration included the prevalence of additional types of emergency aid programs acrossvarying sectors and sizes of colleges in the United States, the processes by which collegestypically administer the aid, the methods for informing students about the availability of aid,and the sources of funding to sustain the resources. To address these underexplored areas,NASPA—Student Affairs Administrators in Higher Education conducted a national landscapeanalysis of emergency aid programs.The following report reflects the most comprehensive research of emergency aid programsknown to date. The landscape analysis thoroughly addressed the current condition of emergency aid, including 10 components of robust programs; challenges and opportunities forincreasing the number of students served; and considerations for colleges that intend tomore closely examine the influence of emergency aid on students’ persistence toward adegree. Woven throughout the report are exhibits that describe the delivery of emergency aidamong multiple sectors and sizes of institutions, and examples of effective campus practice.Three key findings shape the discussion:110Colleges are offering several types of emergency aid, and have been doing so for multiple years.NASPA’s landscape analysis, which was conducted through interviews and a nationalsurvey of vice presidents for student affairs and financial aid directors, revealed that of the 2016 NASPA LANDSCAPE ANALYSIS OF EMERGENCY AID PROGRAMS
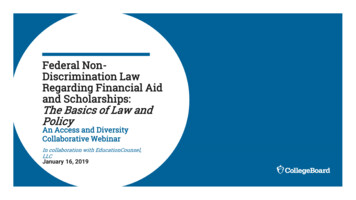
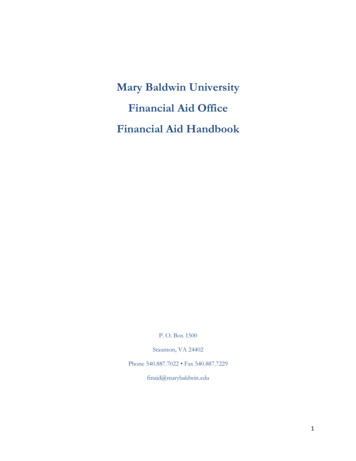
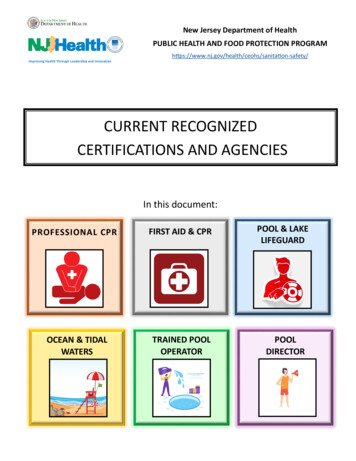
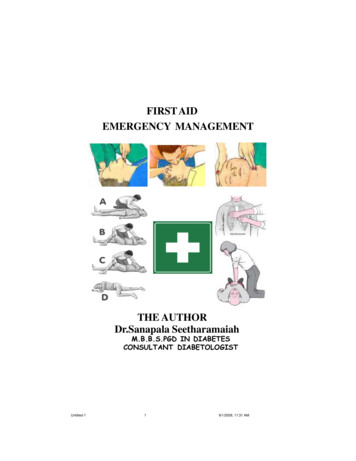
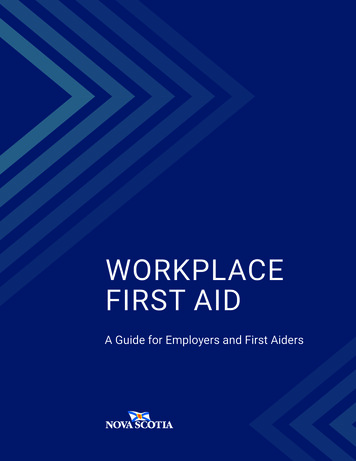
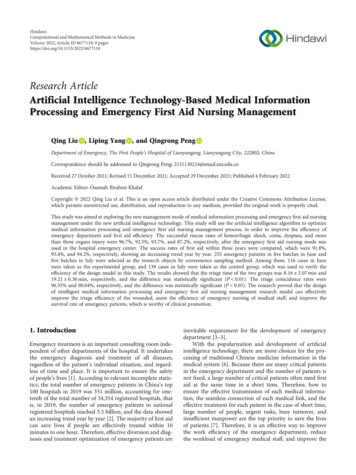
Figure 1 Delivery of Emergency Aid Across 2- and 4-Year Public and Private Institutions (n 439)47%Campus vouchers48%33%CCompletionl ti scholarshipsh l hi57%10%67%e ge cy loansoa sEmergency32%45%Food pantries47%Restricted grants10%20%2%51%4%48%5%54%Unrestricted grants0%4%41%30%Yes40%No50%60%70%5%80%90%100%Don't know523 campuses reporting an emergency aid program, 82% have offered a program for 3or more years.2 The analysis did not indicate major differences among institution sectors,as more than 70% of institutions from most sectors have an emergency aid program. Theresults suggest that these programs have been operating with collaborative efforts frommultiple divisions, where requests are often handled on a case-by-case basis, and thatsix primary types of support are offered. Table 1 describes each type of aid.3As shown in Figure 1, public, private, 2-year, and 4-year institutions (n 439) providea balanced mix of emergency aid. However, analysis of results for public 2- and 4-yearinstitutions specifically revealed a higher prevalence of food insecurity, as food pantriesare the second leading type of emergency aid provided for those institutions. The useof completion scholarships trails slightly in comparison to the other types of aid, whichcould be a result of colleges using those resources to primarily serve a more narrowpopulation, oftentimes students who are close to graduation.2Word of mouth is the primary method for disseminating information about all types ofemergency aid. As shown in Figure 2, word of mouth was the most common communicationstrategy for all types of emergency aid. After word of mouth, the most frequently cited23For the purposes of this project, emergency aid includes one-time grants, loans, and completion scholarships of less than 1,500 provided to students facing unexpected financial crisis, as well as food pantries, housing assistance, and transportation assistance.See Appendix for the definition of each type of emergency aid.LANDSCAPE ANALYSIS OF EMERGENCY AID PROGRAMS 2016 NASPA11
Figure 2 Primary Communication Methods for Emergency %12%15%17%16%10%12%11%10%9%17%5%0%Campus vouchers(n 173)Completionscholarships(n 125)Emergency loans(n 257)Word of mouthFood pantries(n 169)Direct e-mailRestricted grants(n 172)Unrestricted grants(n 208)Institution websiteFigure 3 Select Funding Sources for Emergency Aid 0%1%0%Campus vouchers(n 172)2%Completionscholarships(n 125)2%Emergencyloans(n 257)Foundation and individual donors1220%17%20%0%Food pantries(n 169)Operating budget1%0%Restricted grants(n 172)Unrestrictedgrants(n 208)Alumni association 2016 NASPA LANDSCAPE ANALYSIS OF EMERGENCY AID PROGRAMS
methods for disseminating information include direct e-mail messaging and theinstitution website. Administrators acknowledged that because word of mouth is theleading method for disseminating information to students, students are often requiredto proactively inquire about the possibility of emergency aid. This could raise concernsregarding the process by which colleges determine which students should be given theaid, as disparities in delivery may result from only certain students knowing whom tocontact for assistance. One option for maximizing the provision of emergency aid is toproactively identify, perhaps with data, the students who would most benefit from thesupport. However, the majority of colleges are not yet using data for this purpose.3For most colleges, the need for emergency aid is greater than the resources available.University foundation and individual donors, followed by the operating budget, are thetop sources of emergency aid funds. However, these sources do not fully meet thedemand for aid, as colleges reported a lack of financial resources as the leading barrierto serving more students with emergency aid. While administrators acknowledged thatmore students would benefit from knowing about emergency aid, theyexpressed a concern that increased marketing of these programscould result in their student demand reaching a level that could not bemet with existing resources. One approach to expanding emergencyaid programs is to solicit contributions from new sources. For example,as shown in Figure 3, no more than 2% of institutions reported alumnigiving as the primary funding source for any type of emergency aid.In addition to uncovering important details regarding the administration,communication, and sustainability of emergency aid, the landscape analysis identified five areas of need for increasing the effectiveness of theseprograms. Those needs primarily relate to increased guidance to institutions for addressing unforeseen crises—such as a common languagefor describing an emergency, a toolkit for assessing the strength of theirprogram, and suggestions for better utilization of data to examine theeffect of emergency aid on student success. The report concludes with aOne option formaximizing theprovision of emergencyaid is to proactivelyidentify, perhaps withdata, the students whowould most benefitfrom the support.discussion of these future needs and an appendix with methodology.LANDSCAPE ANALYSIS OF EMERGENCY AID PROGRAMS 2016 NASPA13
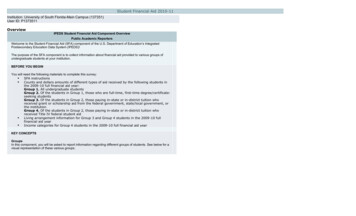
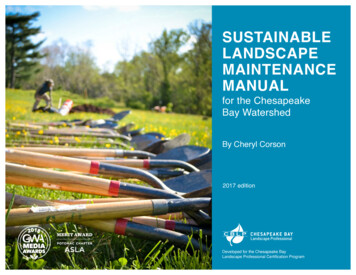
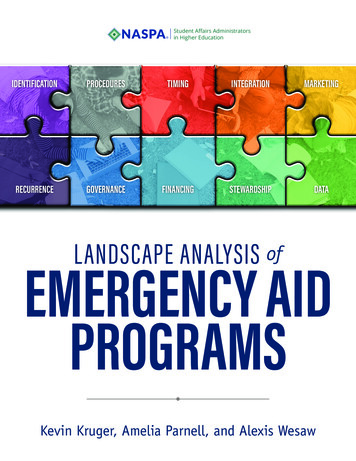
HOVERVIEWigher education institutions across the United States are providingfinancial and humanitarian resources to support students whoexperience an emergency. Although emergency aid programs are nottypically advertised widely, the types of support provided—such asgrants, loans, food pantries, and vouchers—offer critical support that could insome instances help students stay enrolled at their institutions. The followingsummary of major themes from NASPA’s national landscape analysis ofemergency aid programs will describe how emergency aid programs areoperated, including details regarding primary departments responsible andnumber of students served. This report will also address how colleges gatherand use information about students who receive emergency aid, and howadministrators further support students who receive emergency aid in an effortto mitigate repeated need. Emergency aid programs thrive when adequatefinancial resources are available, and this discussion will offer information onthe amount of funding that institutions are budgeting for their programs andthe amount distributed to students for each of the six types of aid.Survey results indicated that colleges intend to use emergency aid to support the goalsof persistence and graduation. As shown in Figure 4, at least two thirds of administratorsreported that eliminating barriers to student success and retaining students are two objectives that greatly influenced the development of their institution’s emergency aid program.LANDSCAPE ANALYSIS OF EMERGENCY AID PROGRAMS 2016 NASPA15
Figure 4 Extent to Which Different Objectives Influenced the Development of Emergency Aid Programs (n 444)Addressing emergencies from a humanitarian perspective3%Eliminating barriers to student success73%20%4%24%21%Removing financial holds for students in position to graduateRetaining studentsSomewhat50%65%26%6%0%Great extent73%21%20%40%60%80%Very little/not at allNote. Percentages do not sum to 100%. Responses of “I don’t know” were intentionally omitted from the figure.For the purposes of this landscape analysis, NASPA asked administrators to respond toquestions with a description of emergency aid as including one-time grants, loans, and completion scholarships of less than 1,500 provided to students facing unexpected financial crisis, aswell as food pantries, housing assistance, and transportation assistance. As shown in Figure 5,nearly 75% of survey respondents indicated that their institution has an emergency aidprogram, including at least 70% of 2- and 4-year institutions. More than 80% of institutionshave had a program for 3 or more years (see Table 2).16 2016 NASPA LANDSCAPE ANALYSIS OF EMERGENCY AID PROGRAMS
Figure 5 Percentage of Institutions With an Emergency Aid Program (N 706)74%All (N 706)24%82%Public 4‐year (n 246)17% 1%73%Private nonprofit 4‐year (n 264)27%70%Public 2‐year (n 172)0%20%Yes0%27%40%No2%60%3%80%100%Don't knowTable 2 Number of Years Emergency Aid Programs Have Been in ExistenceResponseFrequencyPercentageLess than 1 year285%1 to 2 years367%3 to 5 years9518%More than 5 years33264%I don’t know306%Total521100%LANDSCAPE ANALYSIS OF EMERGENCY AID PROGRAMS 2016 NASPA17
Results from the landscape analysis indicate that colleges are addressing emergencieswith six primary types of aid, of which the most used are emergency loans, followed by smallgrants, vouchers, and food pantries, as shown in Figure 6. As shown in Figure 7, emergencyloans appear to be the leading type of aid offered by public 2- and 4-year institutions. Foodpantries are the second leading type of aid for public institutions. The leading type of aidprovided by private nonprofit 4-year institutions is unrestricted grants. In terms of students’eligibility to receive these types of emergency aid, administrators reported that the awardingof completion scholarships and restricted grants can be contingent on a student’s academicstanding or meeting a minimum grade point average; unrestricted grants, food pantries, andvouchers typically do not have such requirements. More than 85% of all institutions reportedoffering more than one type of aid (see Figure 8).Figure 6 Delivery of Emergency Aid Programs Across 2- and 4-Year Public and Private Institutions (n 439)45%Food pantries47%Restricted grants51%4%48%5%54%Unrestricted grants0%10%20%41%30%Yes2%32%67%Emergency loans1810%57%33%Completion scholarships4%48%47%Campus vouchers40%No50%60%70%80%5%90%100%Don't know 2016 NASPA LANDSCAPE ANALYSIS OF EMERGENCY AID PROGRAMS
Figure 7 Percentage of Institutions With Each Type of Emergency Aid Program, by Sector43%45%Campus vouchers32%28%Completion scholarships59%38%75%62%59%Emergency loans55%28%Food pantries55%54%40%Restricted grants50%51%Unrestricted grants64%44%0%10%20%Public 4‐year30%40%50%Private nonprofit 4‐year60%70%80%Public 2‐yearFigure 8 Number of Emergency Aid Types at Each Institution, by Sector13%All (n 439)24%7%Public 4‐year (n 166)24%19%Private nonprofit 4‐year (n 164)31%22%12%Public 2‐year (n 102)32%0%31%20%12340%4560%8% 3%13% 4%21%34%26%20%20% 3% 2%19%80%9% 3%100%6LANDSCAPE ANALYSIS OF EMERGENCY AID PROGRAMS 2016 NASPA19
Table 3 10 Components That Define a Robust Emergency Aid ProgramAdministrationIdentificationDefining an emergencyProceduresGuidelines appropriate to the needs and local context of the institutionTimingQuick response to student crisisIntegrationCoordinated efforts across departmentsCommunicationMarketingAwareness of the programRecurrenceStudents learn personal financial responsibilitySustainabilityGovernanceIndividuals responsible for operating the program and managing resourcesFinancingEnsuring sufficient fundsStewardshipFlexible safeguarding of limited fundsDataEvaluation of information and metrics over timeFor institutions that reported offering two types of emergency aid, 58% provide emergency loans as one of the two. The leading combinations of offerings for these institutionswere as follows: Emergency loans and food pantry (17%) Emergency loans and unrestricted grants (16%) Emergency loans and vouchers (11%)For institutions that offer three types of emergency aid, 71% provide emergency loans and58% offer unrestricted grants as one of the three. The leading combinations of offerings forthese institutions were:20 Emergency loans, unrestricted grants, and restricted grants (12%) Emergency loans, unrestricted grants, and vouchers (12%) Emergency loans, unrestricted grants, and completion scholarships (9%) 2016 NASPA LANDSCAPE ANALYSIS OF EMERGENCY AID PROGRAMS
For institutions that offer four types of emergency aid, 76% provide vouchers and 72%have restricted grants as one of the four. The leading combinations of offerings for theseinstitutions were: Emergency loans, campus vouchers, restricted grants, and food pantry (14%) Emergency loans, campus vouchers, restricted grants, and unrestricted grants (13%) Emergency loans, campus vouchers, unrestricted grants, and food pantry (12%)The research found that regardless of the types of emergency aid an institution provides, 10components, when effectively addressed, should ensure that colleges are operating a robustemergency aid program. Administrators who intend to maximize institutional resources willneed to make decisions for the areas defined in Table 3, which are organizedinto the categories of administration, communication, and sustainability.Interviews with administrators revealed that emergency aid programsare serving a relatively low number of students each year. Most institutions (75% or more of respondents), provide emergency aid to fewer than500 students annually, and several colleges reported serving fewer than 50students. As shown in Table 4, 73% of colleges offer small grants or completion scholarships to fewer than 50 students per year. Very few institutionsserve more than 1,000 students annually with any type of emergency aid;for that small percentage of colleges, the leading type of aid provided wasfood pantries. These small numbers of students served could be the resultMore than a thirdof colleges provideunrestricted orrestricted grants of 1,000 or more.of multiple factors, including low levels of marketing and limited financialresources to sustain the aid.Colleges typically offer emergency aid programs via a concerted effort from multipledepartments, with student affairs and financial aid as the two most involved in managingthe delivery of aid. More than 40% of colleges reported that their financial aid departmentsare primarily responsible for managing financial types of support in the form of restrictedgrants, emergency loans, and completion scholarships. Table 4 shows that student affairsis leading the management of humanitarian types of support, as nearly 70% of institutions reported that student affairs is primarily responsible for food pantries and nearly 45%reported student affairs as responsible for administering vouchers. Although financial aidmay lead the delivery of certain types of aid and student affairs may lead for others, bothdepartments are highly involved in administering all types of emergency aid. In fact, professionals from both financial aid and student affairs shared that they frequently collaborate todetermine the best strategy for assisting students in emergency situations.More than a third of colleges provide unrestricted or restricted grants of 1,000 or more.Completion scholarships are the leading type of aid for which institutions provide resourcesgreater than 1,000, as 75% of colleges give scholarships in that amount or more. It is moredifficult to identify the average dollar amount of aid provided with food pantries, as thatsupport has greater open access and often does not require students to request an exactLANDSCAPE ANALYSIS OF EMERGENCY AID PROGRAMS 2016 NASPA21
UnrestrictedgrantsRestrictedgrantsFood larshipsTable 4 Details of Emergency Aid ProgramsDepartment primarily responsibleStudent affairs45%20%34%67%27%43%Financial aid26%47%43%2%47%34%Total (n)176127262172175211Number of students served annuallyLess than ��9992%2%4%11%1%2%1,000 or more4%0%3%10%0%1%Total (n)139104220117137161Average aid amount distributed annuallyLess than 10019%1%3%58%2%3% 100– 49947%6%38%28%30%32% 500– 99922%16%34%3%32%32% 1,000 or more12%77%25%12%37%32%Total (n)1298221269123154Less than 10,00064%18%39%79%34%47% 10,000– 99,99930%61%51%21%61%44% 100,000– 499,9995%15%7%0%5%7% 500,000– 999,9991%5%1%0%0%1% 1,000,000 or more0%1%3%0%0%1%Total (n)978016071115138Annual budgetNote. Identifying student affairs as the department primarily responsible does not in any way indicate that financial aid is not involvedin the process.22 2016 NASPA LANDSCAPE ANALYSIS OF EMERGENCY AID PROGRAMS
amount of aid. However, the landscape analysis identified the average amount that institutions budget for food pantries, and more than 75% of institutions have an annual budget ofless than 10,000. This is similar to the budget for other types of aid, and as shown in Table4, slightly more than one third of institutions also have a budget of less than 10,000 peryear for small grants and emergency loans. Perhaps colleges will increase their capacity toprovide emergency aid as these programs receive more attention in the future.Regarding the oversight of emergency aid programs, both public and private institutions described significant involvement from both the division of student affairs and thefinancial aid department. Student affairs professionals appear to have slightly more oversight for campus voucher programs, and financial aid departments have more oversightfor emergency loans, completion scholarships, and restricted grants. Additional details bysector are below. 54% of public 4-year institutions reported that student affairs is primarily responsible for campus voucher programs, compared with 46% of private nonprofit4-year institutions. 50% of
List of Figures 1 Delivery of Emergency Aid Across 2- and 4-Year Public and Private Institutions (n 439)11 2 Primary Communication Methods for Emergency Aid 12 3 Select Funding Sources for Emergency Aid Programs 12 4 Extent to Which Different Objectives Influenced the Development of Emergency Aid Programs (n 444)16 5 Percentage of Institutions With an Emergency Aid Program (N 706) 17