Transcription
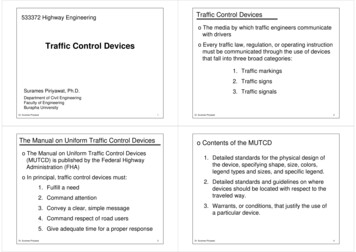
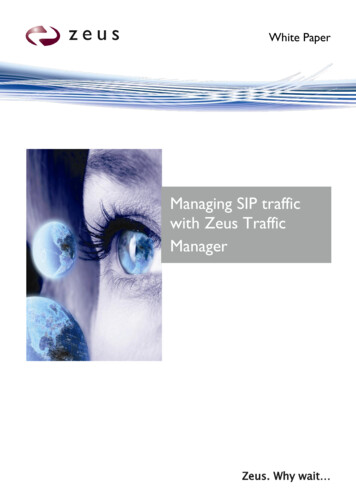
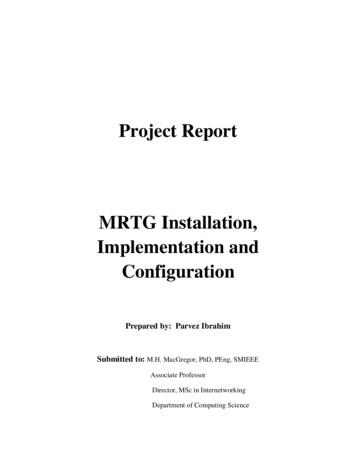
Computer Networks 176 (2020) 107290Contents lists available at ScienceDirectComputer Networksjournal homepage: www.elsevier.com/locate/comnetCampus traffic and e-Learning during COVID-19 pandemicThomas Favale a, Francesca Soro a, Martino Trevisan a, , Idilio Drago b, Marco Mellia aabPolitecnico di Torino, ItalyUniversity of Turin, Italya r t i c l eKeywords:Computer networksCOVID-19 epidemicInternet measurementse-Learningi n f oa b s t r a c tThe COVID-19 pandemic led to the adoption of severe measures to counteract the spread of the infection. Socialdistancing and lockdown measures modified people’s habits, while the Internet gained a major role in supportingremote working, e-teaching, online collaboration, gaming, video streaming, etc. All these sudden changes putunprecedented stress on the network.In this paper, we analyze the impact of the lockdown enforcement on the Politecnico di Torino campus network.Right after the school shutdown on the 25th of February, PoliTO deployed its own in-house solution for virtualteaching. Ever since, the university provides about 600 virtual classes daily, serving more than 16 000 studentsper day. Here, we report a picture of how the pandemic changed PoliTO’s network traffic. We first focus on theusage of remote working and collaboration platforms. Given the peculiarity of PoliTO online teaching solutionthat is hosted in-house, we drill down on the traffic, characterizing both the audience and the network footprint.Overall, we present a snapshot of the abrupt changes seen on campus traffic due to COVID-19, and testify howthe Internet has proved robust to successfully cope with challenges while maintaining the university operations.1. IntroductionSince its first outbreak between late 2019 and early 2020 in China,the COVID-19 pandemic has had a massive impact on people’s lives andhabits. The countries most affected by the virus spreading are facing anunprecedented health crisis, whose effects will impact their economicand social structures for a long time. The urge to respect social distancing and lockdown measures adopted to limit the spreading of theinfection led to a shift in the fruition and supply of a wide number ofservices. Some examples include the increased usage of home deliveryservices, the shift to online lessons and the adoption of remote workingsolutions.Italy has been among the first countries hit by COVID-19. The firstcase was identified in the north of Italy on February 21st , and on thesame date, the Government issued the fist law decree to impose quarantine in small selected towns. On February 25th , the Government extended the restrictions to impose remote working for all public offices,shutting down schools, and classes at Universities. Restrictions appliedto the largest four regions in the north of Italy. On March 1st , theserestrictions were extended to the whole Italy, with further lockdownactions entering in place on March 4th and 8th . On March 11th , the“#IoRestoACasa” Prime Ministerial Decree imposed a total lockdownto the whole Italy. Since then, and still at the time of writing, peopleare allowed to exit from home only for specific and urgent needs. Common retail businesses, catering and restaurant services are suspended.Gatherings in public places are prohibited. All activities not deemed essential for the Italian production chain are closed. Italy entered the mostrestrictive lockdown in its history.Fig. 1 clearly depicts the impact of these measures.1 It shows thevariation of the mobility patterns in Italy since the begin of the emergency and the impact of the restrictions and total lockdown. The verticalbars highlight the relevant events listed above. The leftmost violet baridentifies the date of the first COVID-19 case in Italy. The central brownbar identifies the school shutdown. The rightmost bar marks the dateof the “#IoRestoACasa” decree. The decrease in mobility is drastic aftereach of those events.Restrictions limited people’s mobility while remote working, elearning, online collaboration platforms started to grow along with online leisure solutions, like gaming and video streaming. These new habitshighlighted the fundamental role of the Internet. Correspondingly, Internet traffic volume has grown by about 40%, sometimes with a decreasein the download performance, questioning the resiliency of the Internetitself [1,2].1Source: https://www.apple.com/covid19/mobility. Corresponding author.E-mail addresses: thomas.favale@polito.it (T. Favale), francesca.soro@polito.it (F. Soro), martino.trevisan@polito.it (M. Trevisan), idilio.drago@unito.it (I. Drago),marco.mellia@polito.it (M. 90Received 22 April 2020; Received in revised form 29 April 2020; Accepted 30 April 2020Available online 7 May 20201389-1286/ 2020 Elsevier B.V. All rights reserved.
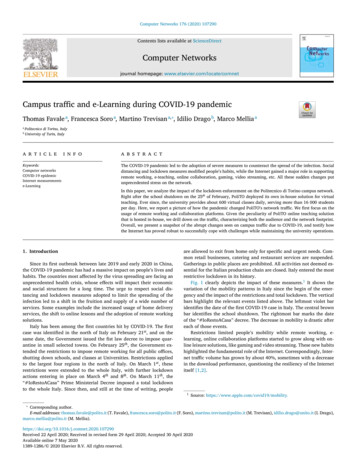
T. Favale, F. Soro and M. Trevisan et al.Fig. 1. Variations in the mobility patterns in Italy between February and April2020. Colors mark the days in which new Ministerial Decrees introduced mobility restrictions. Source: https://www.apple.com/covid19/mobility.Computer Networks 176 (2020) 107290is among the top Universities in Italy. PoliTO has about 35 000 students,of which 30% come from the Piedmont region where Torino is, 55%from other Italian regions, and 15% from the rest of the world. PoliTOemploys about 2 000 faculty and researchers, and around 1 000 administrative staff members.3 PoliTO main campus network hosts all its ITservices, and offers both Ethernet and WiFi connectivity to departments,offices, classrooms, student rooms, and laboratories. Two 10 Gbit/s access links connect the campus LAN to the Internet, through the GARR(Gruppo per l’Armonizzazione delle Reti della Ricerca) network, whichprovides Internet access to all Italian universities.In the following, we describe the data sources we use to gauge thechanges in the traffic and services hosted at the campus network. If notexplicitly said, the data cover the period from Saturday, February 1st toSunday, April 5th 2020.2.1. Passive tracesIn this paper, we analyze the changes in the traffic patterns that arevisible from our university campus, the Politecnico di Torino (PoliTOfor short) in Italy. We look at the campus traffic, focusing on collaboration and remote working platforms usage, remote teaching adoption,and look for changes in unsolicited/malicious traffic. PoliTO opted toimplement an in-house e-learning solution based on the BigBlueButtonframework to support all the classes of the second semester, which werescheduled to start on March 2nd .2 The platform has been designed, installed, and tested during the first week of March, going live for thestarting of the online semester one week later. Here we leverage thisunique point of view to observe changes in the campus traffic and services during such a singular event. Moreover, we dig into details on howstudents access online classes and teaching material. Since students enjoy classes from their homes at different places, connected by differentnetwork operators, we check whether and how these factors affect theperformance of the online teaching systems.Overall, we highlight a 10 times decrease in incoming traffic duringthe lockdown. Outgoing traffic grows instead of 2.5 times, driven bymore than 600 daily online classes, with around 16 000 students perday that follow classes. Online collaboration exploded, with faculty andstaff members exchanging more than 17 000 chat messages and participating to more than 1 000 calls per day. We observe a surge in remotelearning and working also during the weekends. Considering Internetconnectivity, we notice no major problems, with only a few cases ofpoor performance, possibly related to people connected via 3G/4G operators.In a nutshell, we believe this paper testifies how the Internet provedable to cope with the sudden need for connectivity. We attest how remote working, e-learning and online collaboration platforms are a viablesolution to cope with the social distancing policies during COVID-19pandemic. While we all hope the latter will soon be relieved, we believe the experience of online collaboration will continue also after theCOVID-19 disappears.The paper is organized as follows: Section 2 describes the datasetsand methodology; Section 3 reports a drill-down on the aggregate campus traffic patterns and online collaboration solutions; Section 4 focuseson online classes; Section 5 details network performance metrics, breaking down by operator and region; Section 6 looks into possible changesin unsolicited and malicious traffic, such as portscans and spam emails;Section 7 summarizes related work; finally Section 8 concludes thepaper.2. Datasets and methodologyPoliTO is a medium-sized university that offers bachelor, master andgraduate-level courses in the engineering and architecture fields only. ItWe leverage statistics collected by edge routers to observe and compare the load on different Italian University networks. This data is storedby GARR in a central database publicly accessible.4 The repository storesthe time series of the traffic volume on each edge link of the GARR network, with a granularity of five minutes. In our analysis, we considerPoliTO campus and compare it with two other large Italian universities for reference, namely Politecnico di Milano (the biggest technicaluniversity in Italy) and Università di Torino.5While GARR offers only high-level aggregated data, here we alsoleverage on fine-grained measurements exposed by the monitoring infrastructure deployed in the Campus network. Such infrastructure isbased on Tstat [3], a passive sniffer that analyzes the traffic entering andleaving the Campus. It computes flow-level logs similar to NetFlow, exposing information about TCP and UDP flows observed in the network.Beside classical flow-level fields, such as IP addresses and port numbers, Tstat exposes metrics such as Round-Trip time (RTT) and packetlosses. We store Tstat logs in a secured Hadoop-based cluster. Tstat limits as much as possible any information that can be used to identifyusers – e.g., client IP addresses are anonymized using the CryptoPan algorithm [4], and no payload is stored. All data collection is approvedand supervised by the responsible University officers.2.2. Application logsIn addition to passive measurements, we extract data about serversand network devices offering specific services and applications that staffmembers may use for smart working. We focus on three classes of services: (i) the tools to access the internal resources of the Campus whileworking from home, namely Virtual Private Network (VPN) and RemoteDesktop Protocol (RDP) services; (ii) the Microsoft Teams collaborativeplatform, which PoliTO adopted since 2019 to offer chat, file sharing,video calls and collaboration services to employees and students; (iii)email, antispam and security services. Logs available on the management consoles offer rich information about the usage of these servicesover time and let us study how the adoption of such services variedduring the epidemic.2.3. Virtual classroomsTo face the lockdown during the COVID-19 outbreak, PoliTO optedto set up an internally-hosted virtual classroom service for all classes.The system is based on the BigBlueButton framework for online learning, with customization to integrate it in the existing teaching portal.A total of 41 high-end servers running the BigBlueButton io/index.php?lang en.https://gins.garr.it/home statistics.php.5Università di Torino is a separate University which offers degrees on sciences, humanities, economics, etc.42https://bigbluebutton.org/.
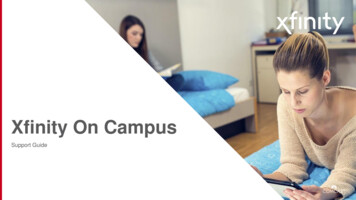
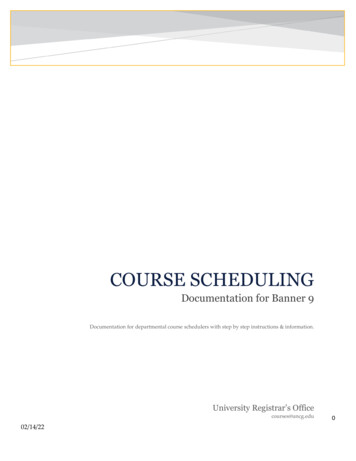
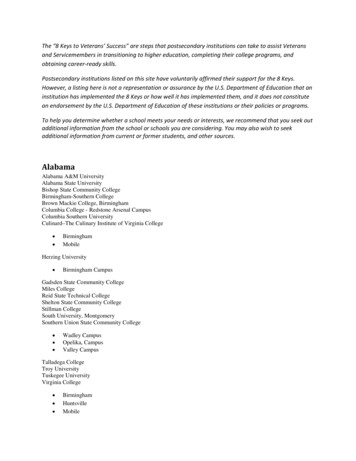
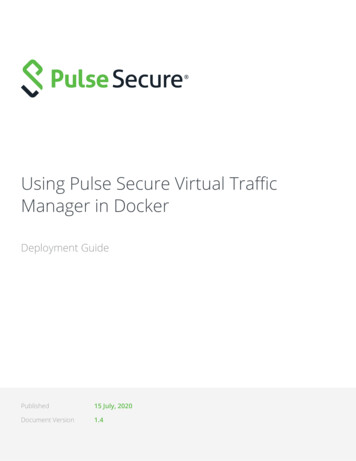
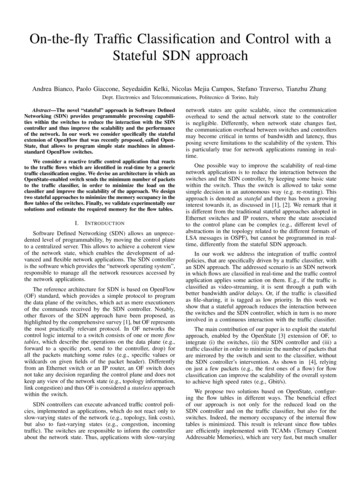
T. Favale, F. Soro and M. Trevisan et al.Computer Networks 176 (2020) 107290Fig. 2. Traffic from three Italian Universities before and after the lockdown.and hosted in the Campus data center were set up in the first week ofMarch. All classes started a week late. The BigBlueButton client-side application is based on HTML5. It provides high-quality audio, video andscreen sharing application using the browser’s built-in support for webreal-time communication (WebRTC) libraries. In a nutshell, once the virtual classroom has been set up, BigBlueButton servers act as WebRTCSelective Forwarding Unit (SFU) capable of receiving multiple mediastreams (video, audio, screen sharing, etc.) and deciding which of thesemedia streams should be sent to which participants. Video is encodedusing the high-quality open-source codec VP8. PoliTO’s setup lets thelecturer choose four video quality levels with a bitrate of 50, 100 (thedefault), 200, 300 kbit/s. Screen sharing may require the highest shareof bandwidth, and, if the presenter’s screen is updating frequently, theBigBlueButton client could transmit up to 1.0 Mbit/s. Audio is encodedusing the OPUS encoder at 40 kb/s.6 Finally, sharing slides takes littlebandwidth beyond the initial upload/download of the pdf file.In our analyses, we collect and process the application logs of thevideo servers to study the consumption and performance of virtual classrooms. We also make use of the logs of the legacy teaching web platforms to study access to the teaching material like lecture notes, prerecorded classrooms, etc.2.4. Security monitorsAt last, we analyze logs from the campus border firewall that limits the access towards authorized servers while blocking possibly malicious traffic and well-known attacks. Since we are interested in remoteworking solutions, we check the firewall for alarms related to SSH, RDP,SIP attacks. Intuitively, we want to check if the attack patterns changedduring the COVID-19 pandemic.The firewall is configured to let three /24 subnets to be completelyopen to the Internet, with no hosts connected to it. These sets of addresses act as “darknets”, i.e., sets of IP addresses regularly advertisedwhich do not host any client or server. Any traffic the darknets receiveis unsolicited by definition [5]. By passively analyzing incoming packets, we observe important security events, such as the appearance andspread of botnets, DDoS attacks using spoofed IP address, etc. We usethis information to further quantify if there is any change in attack patterns to our campus network during the pandemic.3. Impact on campus traffic and remote working solutionsIn this section, we analyze the impact of the COVID-19 outbreak oncampus networks. We first provide quantitative figures on the overalltraffic volume changes. Then, we focus on services supporting rt/faq.html#bandwidthrequirements.3.1. Aggregate traffic volumeWe first focus on the volume of traffic entering and leaving threeItalian university campuses. Fig. 2 shows the average hourly bitrate.For each hour, we compute the average bitrate seen over five workingdays. The positive y values represent incoming traffic (traffic directedto clients and servers hosted in the Campus LAN), while negative y values report the outgoing traffic (traffic directed to clients and servers onthe Internet). Lines mark the volumes before and after the lockdown: theblack lines depict the average per-hour bitrate observed during the weekbefore the lockdown (third week of February), the red ones refer to averages calculated on the second week after the lockdown (third week ofMarch). For comparison, the figure includes plots for the Politecnico diTorino (PoliTO) in Fig. 2a, the Politecnico di Milano (PoliMI) in Fig. 2band the Università di Torino (UniTO) in Fig. 2c.Focusing on the positive 𝑦 axes, observe how the incoming traffichas shrunk in the three cases, reflecting the lockdown effects. Since thesecond week of March, most students, researchers and staff memberscannot access the campuses. The traffic after the lockdown is about onetenth of the traffic before it in both PoliTO and UniTO, with PoliMIstill observing some sizeable incoming traffic. This difference reflectsthe different lockdown policies imposed by each university. PoliTO andUniTO completely blocked all teaching and research activities, whilePoliMI still allows the activity of some laboratories.The negative 𝑦 axes report the outgoing traffic. Again, the threecampuses present different behaviors: We see a major increase in outgoing traffic from PoliTO, which is not observed in other campuses. Thisbehavior is justified by the online teaching platform hosted in PoliTOwhich causes an increase of about 2.8 times the baseline outgoing trafficduring peak time. PoliMI and UniTO have resorted to cloud-based solutions, hence the outgoing traffic volume does not show relevant changesbefore and after the lockdown.Take away: Campus incoming traffic drastically reduced during lockdown. Outgoing traffic changed in PoliTO, where an in-house online teachingservice has been deployed. This system caused a massive inversion on traffic patterns, with significant growth in upload traffic due to online teachingservices.3.2. Smart working adoptionWe now focus on PoliTO only and drill down on the services used bythe personnel for working remotely.In Fig. 3 we show how the number of users relying on VPNs and remote desktop (RDP) solutions have changed over time. VPNs are usedto access in-campus services and servers, while RDP allows one to remotely access files or run applications on their office computers. Curvesin Fig. 3 depict the total number of unique users accessing the servicesat least once in a day.7 The effect of the lockdown started on March 11th7VPN accesses are directly extracted from the VPN terminator logs. We identify RDP connections from Tstat logs, considering TCP flows directed to port
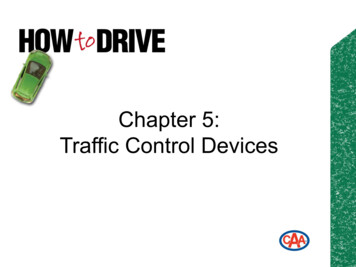
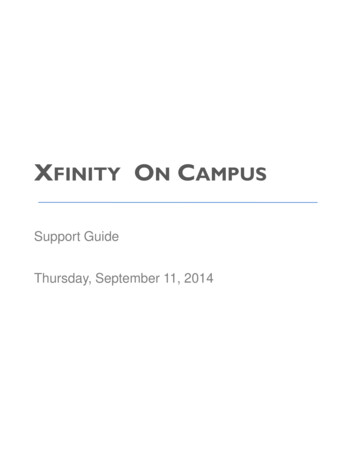
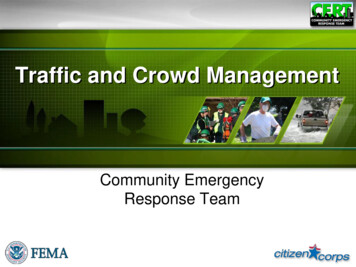
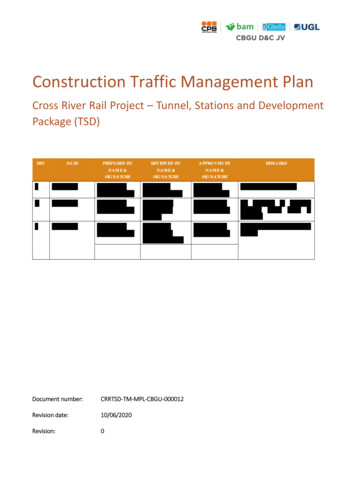
T. Favale, F. Soro and M. Trevisan et al.Fig. 3. Daily accesses to in-house PoliTO smart working systems.Fig. 4. Daily activity on PoliTO Microsoft Teams systems.2020 is astonishing. Since the lockdown started, these solutions simultaneously present a relevant increase in usage. PoliTO offers VPN servicesboth over IPSec and SSL. Interestingly, SSL-based VPN usage increasessignificantly more than the IPSec-based solution. This suggests that thelockdown forced non-expert users to resort to a VPN, and they haveopted for SSL-based VPN, which is easier to configure.Users working from home also heavily rely on RDP, with about 500users contacting such services at least once in a day after the lockdown.Sessions (not reported for the sake of brevity) last several hours, suggesting that this remote access method is mostly used for regular working sessions, and not only to access files on computers left in offices.Notice also the growth in the number of accesses over weekends, withmore than 200 RDP accesses per day. This suggests that people, forcedat home, keep working during the weekend, too.3.3. Remote collaborationWe now move to remote collaboration suites. PoliTO offers all employees and students free access to the Microsoft Teams platform forsmart working. Running on the cloud, it puts little loads on the campusnetwork. Yet, its usage provides insights on people’s habits during thelockdown.8 Fig. 4 summarizes the activity of Microsoft Teams users. Itshows the number of team chat messages (i.e., chat messages to groups),private chat messages, calls and meetings. In Teams’ jargon, both calls andmeetings are online video conferencing; calls have two participants.9Each point in Fig. 4 marks the number of people using each functionality at least once in a day. Teams was already available but onlymarginally used in the campus before the lockdown, with few tens ofusers per day. As for other services supporting smart working, its usage3389 that exchanged at least 10 MB of data. We count users by their client IPaddresses, which we assume to be unique on a daily basis.8PoliTO staff members are not compelled to use Microsoft Teams, we, therefore, expect other platforms to show similar significant eference - accessed April 2020.Computer Networks 176 (2020) 107290Fig. 5. Daily number of virtual classrooms and connected students (facultiesand students).explodes during March. Compared to smart working connectivity solutions – see Fig. 3 – the growth is slightly less abrupt, showing that thepeople resorted first to means to access their data and office computers,and then to online collaboration tools. People rely on Microsoft Teamsas a means to exchange direct messages – more than 700 daily userssent private chat messages over Teams in the last week of March. In total, they exchanged more than 17 000 messages per day. Interestingly,video calls and meetings keep growing as well, topping to 400 users perday, making more than 1 500 calls per day. Team chat messages insteadshow a drop in popularity after an initial surge.Take away: The lockdown has pushed smart working to widespreadadoption. Remote services access via VPN and RDP, VoIP communicationsand online conferencing suddenly become regular for PoliTO users.4. Online teachingIn this section, we study in detail the fruition and the performance ofthe online teaching system deployed at PoliTO. The compelled movingof all classes to an online solution allows us to evaluate (i) the impactof such a scenario on the campus networks, (ii) how students accessedthese new services, and (iii) if students suffered any impairment due tolimitation in the remote connectivity.4.1. AudienceFig. 5 provides a summary of the audience of PoliTO’s online teaching system. Only March is shown since the university has deployed thesystem from scratch to cope with the emergency.The number of virtual classrooms (black bars) follows the pattern ofthe university lecturing schedules, with around 700 virtual classroomsper day. The drop registered on Thursday of the first week was causedby an outage. More than 16 000 students connect to at least one virtualclassroom on a daily basis. Considering that around 35 000 studentsare registered at the university, and some join a few lectures a day,a large percentage of the community engages in online teaching eachday. The trend on active classrooms and students is stable over time,suggesting that students and faculty found the virtual teaching platformappropriate. This is confirmed by the feedback students leave at the endof each class which sees more than 70% of students giving a feedbackof 4 or 5 stars (5 being the highest rating) to the technical quality of thesession.Interestingly, 47% of classes have been followed by students outsidePiedmont, where PoliTO resides. Some students have indeed returned totheir home countries or regions before the start of the second semesterand could not return to Torino because of the lockdown. Other statisticsshow that most students follow classes using a Windows 10 PC (64.5%)or Mac OS X (14.1%), and Chrome (71%), Safari (10.1%) or Firefox(9.9%) browser. Yet, 6.2% and 2.4% of students follow the class froman Android or iOS device, respectively.
T. Favale, F. Soro and M. Trevisan et al.Take away: Engagement in online teaching is impressively high duringthe COVID-19 emergency, with a large part of the academic community participating on a daily basis. Virtual classrooms allowed students to followclasses, with almost 50% of them connecting from outside Piedmont.4.2. Network workloadHow much massive online teaching costs in terms of network traffic?Clearly, the answer to this question depends on the technical parametersof the online teaching environment. PoliTO’s infrastructure includes thedeployment of teaching tools for (i) virtual classroom; (ii) on-demandvideo of pre-recorded classes (stored as 720p video); (iii) other teaching material (e.g., slides, teachers’ notes, other useful files). The virtualclassroom service allows the students to watch a live video of the lecturer, an optional whiteboard as well as the direct sharing of the lecturer’s screen. The BBB platform uses dedicated servers and WebRTC toset up multiple RTP streams that carry the live video and audio. Ondemand video and teaching material are instead offered by additionalservers as standard HTTP downloads.Fig. 6a details the traffic volume for each service during the fourthweek of March. The figure reports the average bitrate of the traffic leaving the Campus – i.e., from the servers to the clients, for each hour.During weekdays, the total bitrate exceeds 1 Gbit/s, with live streamingof classes responsible for a bit more than one third of the traffic. Duringthe weekend, when no lecture is scheduled, we still observe large traffic (up to 750 Mbit/s) due to students downloading on-demand lecturesand teaching material. Virtual classroom traffic starts and ends withinthe schedule, while students keep accessing on-demand classroom andmaterial also at night.Fig. 6b shows how the accesses to teaching facilities are distributedover the day. We take the start time of each student connection to ateaching server and plot the number of new connections observed everyfive minutes. Accesses to live classrooms (red solid line) clearly followthe schedule of the campus lectures, which begin every 90 minutes, from8:30 AM until 7 PM. When lectures begin, thousands of students start anew session with the live classrooms servers, resulting in peaks of moreComputer Networks 176 (2020) 107290than 4 500 connections. Different is the case for on-demand classroomsand teaching material (blue and green dashed lines, respectively), whoseconsumption is spread over the day. As said above, students downloadsuch material also late in the evenings, including sizeable accesses evenafter midnight.We complement the above picture with Fig. 7, in which we showdifferent characteristics of the virtual classroom sessions. Using logs exported by Tstat, we analyze the RTP streams that serve multimedia content (audio and video) to the students and report the distribution of theper-flow average bitrate in Fig. 7a, separately per audio and video.10All classes carry an audio track, with 40 kbit/s average bitrate – theexpected VoIP bitrate according to the BBB configuration. Consideringvideo, we observe that lecturers usually select the medium quality at100 kbit/s, but we observe a considerable amount of streams at 50 kbit/s(low quality) and 200 kbit/s (high quality). Remind that PoliTO setupallows four quality levels, as explained in Section 2.3. In only 10% ofthe cases, streams reach 300 kbit/s or higher, meaning that ultra-highquality video and screen sharing are seldom used. In all cases, bandwidth is not a major problem for BBB, and students need no more than0.5-1.0 Mbit/s to enjoy a lecture.At last, we consider session duration in Fig. 7b. Half of the streamslast less than 30 minutes, but it is hard to link this short duration toabandonment by students, as the server could reset multimedia streamsfor other reasons (e.g., the lecturer temporarily mutes the microphone,or takes a break during a class). Interestingly, we still notice two bumpsat 1.5 and 3 hours, which are the typical duration of PoliTO classes.Take away: Live classrooms put a large workload on teaching serverswith significant peaks on scheduled lecture times. Yet, bandwidth is not amajor problem. Students need less than 1 Mbit/s downstream bandwidth tofully enjoy live lectures. Not-live teaching media are heavily consumed alsoduring evenings and weekends.5. Network performanceWe now evaluate network performance metrics to understandwhether people accessing teaching material experience problems to obtain the content. We first investigate the performance by breaking downdata according to the students’ Internet Service Providers (ISPs). Then,we break down figures according to the geographical region from wherestudents connect. In both cases, we map their ISPs and regions using theMaxMind datasets.11 Results in this section are computed by consideringthe downloads of on-demand video or teaching material with TCP connections. Both contents are provided through HTTP bulk transfers andthus constitute a valid download performance test. To reduce noise, weconsider only download of objects of at least 10 MB.5.1. Internet service providers breakdownFig. 8a shows the distribution of the number of connections according to the ISPs hosting the client IP addresses. As expected, the largest4 ISPs in Italy dominate the list, with TIM grabbing 31% of the connections, followed by Vodafone, Fastweb and Wind Tre getting 20%–15% ofthe share. Some ISPs rely on specific access technologies. For instance,EOLO, Linkem, and Free Mobile offer Internet over 3G/4G technologiesonly. Would students using them suffer eventual impairments?For this, we check the distribution of download throughput for eachISP. Violin plots in Fig. 8b depict results. Each violin plot represents theprobability density function of the average per-flow throughput; Whitedots mark the median values of distributions. We sort providers by thismedian. Most flows experience average throughput higher than 5 Mb/s.For example, the median on Fastweb customers (a provider offeringFig. 6. Access pattern to the teaching services.10RTP streams are defined by the combination of endpoint addresses and portnumbers, plus the SSRC stream identifier. We distinguish audio and video usingthe RTP Payload Type field.11https://www.maxmind.com/.
T. Favale, F. Soro and M. Trevisan et al.Computer Networks 176 (2020) 107290Fig. 7. Characteristics of virtual classroom sessions.Fig. 8. Access to teaching servers per ISP. Onlyflows larger than 10 MB are considered.mostly fiber access solution) is as high as 10 Mbit/s. Figures for 3G/4Gonly providers are, instead, below 5 Mbit/s, thus pointing to possibleclient-side impairment (e.g., congestion).Fig. 8c provides more insights. The violin plots depict the distributions of the minimum RTT which Tstat computes by measuring the timebetween a data segment and its corresponding acknowledgment. RTTis impacted (i) by the physical distance from clients to servers, (ii) byaccess technology delays and network congestion, and (iii) Internet routing. Notice how the RTT distribution is very condensed for Fastweb (median at around 20 ms). On the
To face the lockdown during the COVID-19 outbreak, PoliTO opted to set up an internally-hosted virtual classroom service for all classes. The system is based on the BigBlueButton framework for online learn- ing, with customization to integrate it in the existing teaching portal. A total of 41 high-end servers running the BigBlueButton components. 3