Transcription
Yi et al. Journal of Hematology & (2020) 13:72RESEARCHOpen AccessThe global burden and attributable riskfactor analysis of acute myeloid leukemia in195 countries and territories from 1990 to2017: estimates based on the globalburden of disease study 2017Ming Yi1, Anping Li2, Linghui Zhou3, Qian Chu1, Yongping Song2 and Kongming Wu1,2*AbstractBackground: Acute myeloid leukemia (AML) is a common leukemia subtype and has a poor prognosis. The risk ofAML is highly related to age. In the context of population aging, a comprehensive report presenting epidemiologicaltrends of AML is evaluable for policy-marker to allocate healthy resources.Methods: This study was based on the Global Burden of Disease 2017 database. We analyzed the change trends ofincidence rate, death rate, and disability-adjusted life year (DALY) rate by calculating the corresponding estimatedannual percentage change (EAPC) values. Besides, we investigated the influence of social development degree onAML’s epidemiological trends and potential risk factors for AML-related mortality.Results: From 1990 to 2017, the incidence of AML gradually increased in the globe. Males and elder people had ahigher possibility to develop AML. Developed countries tended to have higher age-standardized incidence rate anddeath rate than developing regions. Smoking, high body mass index, occupational exposure to benzene, andformaldehyde were the main risk factors for AML-related mortality. Notably, the contribution ratio of exposure tocarcinogens was significantly increased in the low social-demographic index (SDI) region than in the high SDI region.Conclusion: Generally, the burden of AML became heavier during the past 28 years which might need more healthresources to resolve this population aging-associated problem. In the present stage, developed countries with high SDIhad the most AML incidences and deaths. At the same time, developing countries with middle- or low-middle SDI alsoneed to take actions to relieve rapidly increased AML burden.Keywords: Acute myeloid leukemia, Global burden disease, Cancer epidemiology, Cancer statistics, Population agingBackgroundAcute myeloid leukemia (AML) is a malignant disease ofhemopoietic stem cells or progenitors which is* Correspondence: wukm lab@163.com1Department of Oncology, Tongji Hospital of Tongji Medical College,Huazhong University of Science and Technology, Wuhan 430030, China2The Affiliated Cancer Hospital of Zhengzhou University & Henan CancerHospital, Zhengzhou 450008, ChinaFull list of author information is available at the end of the articlecharacterized as the differentiation arrest and aberrantproliferation of myeloid lineages [1]. In 2017, AML isthe most commonly diagnosed acute leukemia subtypein the USA [2]. AML could occur in any age group especially in elder individuals. It was reported that nearly75% of AML patients were aged 65 years or older in theUSA [3]. The mechanisms by which AML develops havenot been completely understood. It is generally believed The Author(s). 2020 Open Access This article is licensed under a Creative Commons Attribution 4.0 International License,which permits use, sharing, adaptation, distribution and reproduction in any medium or format, as long as you giveappropriate credit to the original author(s) and the source, provide a link to the Creative Commons licence, and indicate ifchanges were made. The images or other third party material in this article are included in the article's Creative Commonslicence, unless indicated otherwise in a credit line to the material. If material is not included in the article's Creative Commonslicence and your intended use is not permitted by statutory regulation or exceeds the permitted use, you will need to obtainpermission directly from the copyright holder. To view a copy of this licence, visit http://creativecommons.org/licenses/by/4.0/.The Creative Commons Public Domain Dedication waiver ) applies to thedata made available in this article, unless otherwise stated in a credit line to the data.
Yi et al. Journal of Hematology & Oncology(2020) 13:72that the oncogenic transformation of hemopoietic stemcells or progenitors initiates leukemogenesis [4]. Thesespecific mutations in the early stage of leukemogenesisbring a selective advantage for hemopoietic stem cells orprogenitors during clonal expansion, which might impairnormal hemopoiesis and eventually develop into AML[5]. The alterations of genes such as FLT3, IDH1, IDH2,TET2, ASXL1, and DNMT3A could be found in the bonemarrow or peripheral blood of patients without overtAML [6–12]. This status is termed clonal hematopoiesisof indeterminate potential (Chip) [13]. For patients withChip, the rate of transformation to overt hematologicmalignancy is about 0.5–1% per year [14]. It is notablethat approximately 10% AML patients underwent cytotoxic chemotherapy or radiotherapy previously, usuallyas the treatment for primary tumor [15]. For patientsharboring Chip, the risk of having AML is increasedafter cytotoxic treatment [5]. Some somatic mutationssuch as TP53 mutation endow preleukemic hemopoieticstem cells with enhanced resistance to chemotherapywhich further elevates the competitive advantage overnormal hemopoietic stem cells [16, 17].According to SEER database, over ten thousand peopledied from AML which accounted for 62% of allleukemia-related deaths in the USA [3]. In the presentstage, the median survival time of AML is nearly 8.5months [3]. The 2-year and 5-year overall survival (OS)rates are 32% and 24% [3]. With several recent drug approvals for precision therapy of AML, significant progress has been made in improving the outcomes of AML[18–25]. In addition, this improvement in AML’s outcomes is also partly attributed to better supportive caresuch as more effective antimicrobials [26]. Age at diagnosis is an important factor determining the long-termsurvival of AML patients. It was reported that the 2-yearand 5-year OS rates of individuals diagnosed before theage of 40 were five-fold higher than patients diagnosedat 65 years or older [27]. Besides, patients’ lifestyle suchas smoking and sociodemographic factor also have impacts on AML patients’ survival [28–30]. Epidemiological investigations of AML are valuable references forpolicy-makers to allocate healthy resources. In thisstudy, we presented in detail the statistical data of AMLin the globe, different regions, and 195 countries or territories from 1999 to 2017. Moreover, we tried toanalyze the influence of multiple risk factors on AMLrelated mortality.Page 2 of 16(DALYs), and corresponding age-standardized rates weredownloaded from the Global Health Data Exchange(GHDx) website (http://ghdx.healthdata.org/gbd-resultstool). The background information such as socialdemographic index (SDI) was also downloaded for thefollowing correlation analysis. SDI values range between0 and 1 which reflect the degree of social development.Statistical analysisAnnual incidence cases, deaths, DALYs, and corresponding age-standardized rates (ASRs) were used to describethe burden to AML. ASRs could exclude the interference from changes in age distribution and populationquantity. DALY was the summation of the years livedwith disability and the years of life lost. Moreover, EAPCbased on ASRs including age-standardized incidence/death rate (ASIR/ASDR) and age-standardized DALYrate per 100,000 persons were employed to reflect thechange trends of AML’s burden. In the formula y α βx, y means log10 (ASR) value while x refers to the calendar year. EAPC values were calculated based on theformula EAPC 100* (10 β -1). For EAPC value and its95% confidence interval (CI) above zero, the corresponding ASR was in an upward trend and vice versa. To investigate the correlation between ASR change trendsand social development degrees, we calculated Pearson’scorrelation coefficient between EAPCs and SDI values.Lastly, we searched the GBD database for potential riskfactors contributing to AML-related mortality and visualized corresponding results.Data visualizationAll data analysis was based on the open-source softwareR (version 3.6.0). The data visualization was performedwith packages including maps, ggplot2, and RcolorBrewer. Data cleaning was conducted with packagedplyr. Histograms were used to demonstrate the quantities and change trends of AML’s incidence cases,deaths, and DALYs from 1990 to 2017. Maps wereadopted for the visual presentation of AML’s burdenand corresponding ASRs in the 195 countries and territories. Scatter diagrams and regression curves wereemployed to analyze the correlation between ASRs andSDI values. Area under the curve was used to presentthe dynamic distribution of the age composition of AMLpatients.ResultsMethodsThe incidence and its change trend of AMLData acquisition and downloadIn the globe, the incidence case of AML was increasedgradually in the past 28 years (from 63.84 103 in 1990to 119.57 103 cases in 2017, increasing by 87.3%,EAPC 0.56, 95% CI 0.49 0.62) (Table 1) (Fig. 1a).Males were more likely to suffer from AML than femalesThe Global Burden of Disease (GBD) database containsthe statistical data of 354 diseases in 195 countries orterritories [31, 32]. The data of AML including incidences, death cases, disability-adjusted life years
Yi et al. Journal of Hematology & Oncology(2020) 13:72Page 3 of 16(male to female ratio in ASIR 1.23:1 in 1990, and 1.38:1 in 2017). In the region level, the high SDI region hadthe highest AML burden until 2017 (incidence case:23.86 103 in 1990 and 43.42 103 cases in 2017). Inthe meanwhile, middle SDI had the most rapid increaseduring the 28 years (ASIR: 0.86 in 1990 and 1.14 in2017, EAPC 1.03, 95% CI 1.00 1.07). Subgroup analysis by geographical zone showed Western Europe andSouth Asia had the most incidence cases (WesternEurope: 11.94 103 in 1990 and 20.02 103 in 2017;South Asia: 10.06 103 in 1990 and 21.46 103 in2017). Andean Latin America and East Asia had themost mushrooming rise (EAPC of Andean Latin America: 1.68, 95% CI 1.55 1.82; EAPC of East Asia: 1.55,95% CI 1.40 1.69). In the country or territory level,India, China, and the USA had the most incidence cases(7.4 103, 6.9 103, and 5.4 103 cases in 1990, respectively; 15.8 103, 13.2 103, 10.6 103 cases in2017, respectively) (Fig. 2a) (Additional file 1:Table S1and Table S7). The UK had the highest ASIR both inTable 1 The incidence of AML in 1990/2017 and temporal trends199020171990–2017Incident casesNo *103 (95% CI)ASIR/100,000No. (95% CI)Incident casesNo *103 (95% CI)ASIR/100,000No. (95% CI)EAPCNo. (95% CI)63.84 (54.95 83.84)1.35 (1.20 1.71)119.57 (108.37 125.93)1.54 (1.40 1.63)0.56 (0.49 0.62)Male33.60 (29.51 40.47)1.51 (1.36 1.74)66.79 (57.83 71.62)1.81 (1.57 1.94)0.72 (0.67 0.77)Female30.24 (24.37 45.16)1.23 (1.02 1.77)52.79 (46.07 57.78)1.31 (1.14 1.44)0.35 (0.27 0.44)High SDI23.86 (23.01 24.9)2.05 (1.97 2.15)43.42 (41.11 45.61)2.29 (2.18 2.41)0.60 (0.45 0.74)High-middle SDI12.86 (11.22 15.81)1.21 (1.06 1.47)19.63 (17.05 21.18)1.30 (1.12 1.41)0.36 (0.29 0.43)Middle SDI11.58 (9.55 15.89)0.86 (0.73 1.13)24.05 (20.77 26.25)1.14 (0.98 1.24)1.03 (1.00 1.07)Low-middle SDI8.81 (6.43 13.60)1.01 (0.79 1.42)18.82 (16.53 21.75)1.27 (1.12 1.47)0.82 (0.77 0.88)Low SDI6.55 (3.83 13.98)1.16 (0.80 1.99)13.34 (10.84 15.41)1.31 (1.07 1.48)0.34 (0.29 0.38)0.32 (0.24 0.44)0.97 (0.78 1.27)0.82 (0.59 0.97)1.40 (1.02 1.65)1.68 (1.55 1.82)OverallSexSocio-demographic factorRegionAndean Latin AmericaAustralasia0.66 (0.59 0.76)2.92 (2.59 3.29)1.10 (0.90 1.31)2.63 (2.17 3.13) 0.74 ( 0.99 0.48)Caribbean0.42 (0.34 0.62)1.30 (1.07 1.82)0.61 (0.53 0.74)1.28 (1.10 1.56)0.02 ( 0.13 0.17)Central Asia0.78 (0.67 0.95)1.17 (1.03 1.39)1.13 (1.00 1.26)1.28 (1.15 1.43)0.63 (0.50 0.76)Central Europe2.07 (1.90 2.27)1.52 (1.38 1.67)2.56 (2.29 2.73)1.56 (1.39 1.71)0.48 (0.36 0.60)Central Latin America1.64 (1.55 1.89)1.16 (1.11 1.29)3.41 (3.20 3.65)1.38 (1.29 1.47)0.63 (0.54 0.72)Central Sub-Saharan Africa0.52 (0.31 1.05)1.25 (0.86 1.73)1.14 (0.80 1.61)1.29 (0.89 1.59) 0.05 ( 0.16 0.07)East Asia7.61 (5.56 11.79)0.64 (0.48 0.97)14.79 (11.96 16.70)0.95 (0.77 1.08)1.55 (1.40 1.69)Eastern Europe3.76 (3.06 4.28)1.59 (1.30 1.87)3.59 (3.20 4.06)1.39 (1.21 1.62) 0.59 ( 0.75 0.43)Eastern sub-Saharan Africa1.64 (1.06 2.77)1.13 (0.85 1.63)4.01 (2.95 4.95)1.38 (1.06 1.67)0.62 (0.53 0.71)High-income Asia Pacific3.51 (3.29 3.82)1.87 (1.74 2.06)7.38 (6.45 8.38)2.09 (1.83 2.37)0.74 (0.48 1.01)High-income North America5.95 (5.75 6.23)1.78 (1.72 1.87)11.70 (11.16 12.30)2.22 (2.11 2.35)1.04 (0.78 1.29)North Africa and Middle East4.17 (2.83 6.68)1.48 (1.03 2.15)6.99 (5.80 8.41)1.30 (1.08 1.55) 0.32 ( 0.43 0.22)Oceania0.09 (0.06 0.14)1.75 (1.31 2.47)0.19 (0.14 0.29)1.81 (1.38 2.52)0.23 (0.16 0.30)South Asia10.06 (6.84 17.32)1.14 (0.86 1.70)21.46 (18.64 24.64)1.40 (1.22 1.60)0.66 (0.59 0.74)Southeast Asia3.76 (2.68 6.34)1.01 (0.77 1.59)8.97 (7.48 10.39)1.43 (1.19 1.64)1.38 (1.29 1.48)Southern Latin America0.69 (0.63 0.78)1.43 (1.29 1.60)1.09 (0.98 1.22)1.49 (1.33 1.69)0.18 (0.08 0.27)0.55 (0.41 0.64)1.37 (1.01 1.64)0.92 (0.68 1.08)1.37 (1.02 1.60) 0.26 ( 0.56 0.05)Tropical Latin America2.04 (1.90 2.18)1.56 (1.47 1.64)3.59 (3.38 3.77)1.60 (1.49 1.68)0.11 (0.02 0.21)Western Europe11.94 (11.36 12.75)2.32 (2.20 2.46)20.02 (18.46 21.51)2.50 (2.30 2.70)0.40 (0.32 0.48)Western sub-Saharan Africa1.63 (1.06 2.37)0.92 (0.67 1.17)4.12 (2.93 5.05)1.07 (0.78 1.32)0.44 (0.34 0.54)Southern sub-SaharanAfricaNote: ASIR age-standardized incidence rate
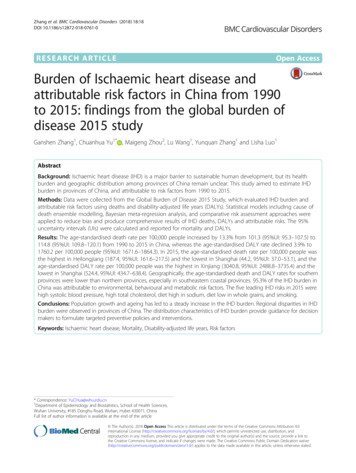
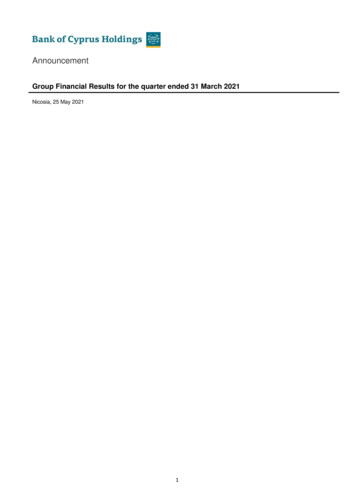
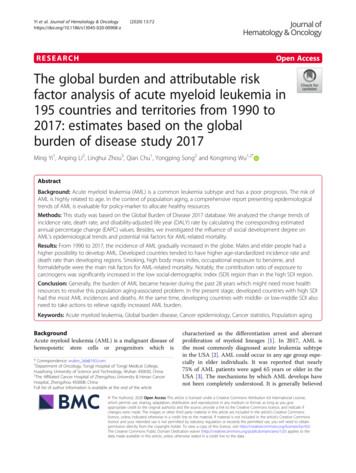
Yi et al. Journal of Hematology & Oncology(2020) 13:72Page 4 of 16Fig. 1 The change trends of AML’s incidence cases, deaths, and DALYs from 1990 to 2017. a The change trends of incidences, b the changetrends of deaths, and c the change trends of DALYs. Blue bars represent males and red bars represent females. Note: AML, acute myeloidleukemia; DALY, disability-adjusted life year1990 and 2017 (ASIR 4.19 in 1990 and 4.05 in 2017)(Fig. 3a) (Additional file 1: Table S4 and Table S10).Ecuador had the most prompt increase in ASIR (EAPC 3.31, 95% CI 2.94 3.69) (Additional file 1: Table S13).The death and its change trend of AMLGenerally, AML-related death was remarkably increasedfrom 51.77 103 cases in 1990 to 99.90 103 cases in2017 (increasing by 93.0%, EAPC 0.45, 95% CI
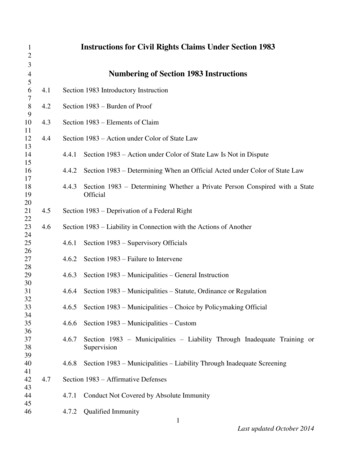
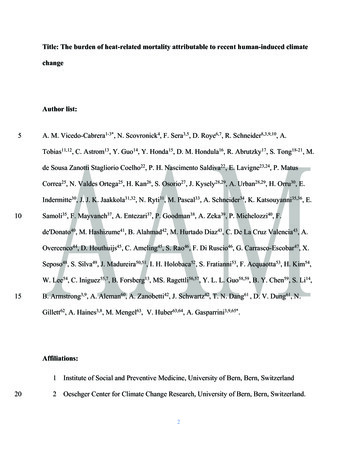
Yi et al. Journal of Hematology & Oncology(2020) 13:72Page 5 of 16Fig. 2 The global disease burden of AML in 195 countries or territories. a The incidence cases of 195 countries or territories in 2017, b the deathsof 195 countries or territories in 2017, and c the DALYs of 195 countries or territories in 2017. Note: AML, acute myeloid leukemia; DALY,disability-adjusted life year
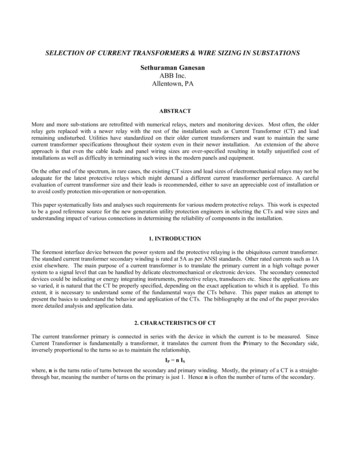
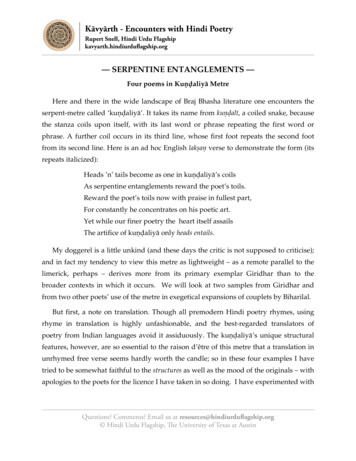
Yi et al. Journal of Hematology & Oncology(2020) 13:720.36 0.53) (Table 2) (Fig. 1b). The number of AMLrelated death in males was higher than in females (1990:27.33 103 cases in male and 24.43 103 cases in females; 2017: 57.40 103 cases in males and 42.50 103cases in females). Subgroup analysis by a socio-Page 6 of 16demographic factor indicated that the high SDI regionhad the most death cases (21.87 103 death cases in1990 and 40.91 103 death cases in 2017). At the sametime, the middle SDI and low-middle SDI regions had arelatively huge rise in ASDR (EAPC of middle SDI: 0.85,Fig. 3 The age-standardized rates of AML in 195 countries or territories. a The ASIR of 195 countries or territories in 2017, b the ASDR of 195countries or territories in 2017, and c the age-standardized DALY rate of 195 countries or territories in 2017. Note: AML, acute myeloid leukemia;ASIR, age-standardized incidence rate; ASDR, age-standardized death rate; DALY, disability-adjusted life year
Yi et al. Journal of Hematology & Oncology(2020) 13:72Page 7 of 16Table 2 The death of AML in 1990/2017 and temporal trends199020171990–2017Death casesNo *103 (95% CI)ASDR/100,000No. (95% CI)Death casesNo *103 (95% CI)ASDR/100,000No. (95% CI)EAPCNo. (95% CI)51.77 (46.26 64.34)1.16 (1.06 1.39)99.90 (91.28 104.58)1.28 (1.17 1.34)0.45 (0.36 0.53)Male27.33 (24.67 31.31)1.33 (1.21 1.48)57.40 (50.85 60.98)1.58 (1.40 1.67)0.74 (0.66 0.83)Female24.43 (20.60 34.16)1.04 (0.89 1.40)42.50 (37.88 46.22)1.03 (0.92 1.13)0.06 ( 0.04 0.15)High SDI21.87 (21.39 22.78)1.80 (1.76 1.86)40.91 (39.11 42.19)1.96 (1.88 2.03)0.48 (0.32 0.65)High-middle SDI9.98 (9.03 11.69)0.96 (0.88 1.12)15.11 (13.55 15.94)0.93 (0.83 0.98) 0.08 ( 0.13 0.02)Middle SDI8.54 (7.29 11.17)0.69 (0.61 0.88)18.64 (16.05 20.01)0.87 (0.75 0.93)0.85 (0.83 0.87)Low-middle SDI6.51 (4.96 9.58)0.84 (0.68 1.11)14.77 (13.06 17.11)1.08 (0.96 1.24)0.93 (0.89 0.98)Low SDI4.75 (3.00 9.30)0.98 (0.72 1.51)10.28 (8.34 11.64)1.14 (0.94 1.28)0.49 (0.46 0.53)Andean Latin America0.23 (0.18 0.31)0.79 (0.65 0.99)0.67 (0.50 0.77)1.19 (0.88 1.35)1.87 (1.73 2.01)Australasia0.64 (0.60 0.67)2.72 (2.58 2.83)1.10 (0.98 1.21)2.39 (2.16 2.62) 0.87 ( 1.1 0.65)OverallSexSocio-demographic factorRegionCaribbean0.34 (0.29 0.46)1.11 (0.96 1.44)0.54 (0.48 0.64)1.11 (0.97 1.32)0.11 ( 0.06 0.28)Central Asia0.58 (0.52 0.68)0.93 (0.84 1.08)0.89 (0.82 0.96)1.05 (0.97 1.14)0.79 (0.64 0.95)Central Europe2.03 (1.91 2.20)1.42 (1.33 1.55)3.32 (3.02 3.48)1.73 (1.58 1.81)1.12 (0.98 1.26)Central Latin America1.21 (1.17 1.34)0.95 (0.93 1.02)2.78 (2.59 2.91)1.14 (1.06 1.19)0.69 (0.61 0.77)Central sub-Saharan Africa0.38 (0.25 0.67)1.10 (0.76 1.39)0.86 (0.60 1.07)1.14 (0.78 1.45)0.01 ( 0.13 0.15)East Asia4.92 (3.73 7.32)0.44 (0.34 0.63)7.91 (6.53 8.75)0.46 (0.38 0.51)0.09 ( 0.04 0.22)Eastern Europe3.13 (2.59 3.39)1.23 (1.01 1.31)3.23 (2.99 3.40)1.09 (1.02 1.16) 0.49 ( 0.60 0.38)Eastern sub-Saharan Africa1.17 (0.80 1.85)0.99 (0.77 1.36)2.92 (2.19 3.53)1.22 (0.95 1.45)0.70 (0.63 0.77)High-income Asia Pacific2.98 (2.90 3.07)1.53 (1.49 1.58)5.74 (5.44 6.02)1.44 (1.35 1.53)0.05 ( 0.17 0.27)High-income North America6.98 (6.84 7.25)2.00 (1.96 2.08)13.21 (12.76 13.62)2.26 (2.19 2.34)0.50 (0.31 0.68)North Africa and Middle East3.07 (2.04 4.75)1.22 (0.82 1.70)5.53 (4.56 6.57)1.11 (0.92 1.31) 0.14 ( 0.25 0.04)Oceania0.06 (0.05 0.10)1.43 (1.06 1.86)0.14 (0.10 0.19)1.47 (1.12 1.93)0.25 (0.15 0.35)South Asia7.60 (5.45 12.07)0.98 (0.76 1.36)18.07 (15.70 20.54)1.25 (1.08 1.42)0.84 (0.77 0.91)Southeast Asia2.83 (2.13 4.58)0.84 (0.67 1.27)6.83 (5.60 8.01)1.12 (0.91 1.30)1.22 (1.11 1.34)Southern Latin America0.60 (0.55 0.65)1.24 (1.15 1.34)1.02 (0.93 1.11)1.32 (1.21 1.45)0.29 (0.17 0.41)Southern sub-Saharan Africa0.44 (0.33 0.53)1.21 (0.87 1.48)0.77 (0.57 0.89)1.21 (0.91 1.40) 0.22 ( 0.48 0.04)Tropical Latin America1.60 (1.53 1.67)1.33 (1.28 1.38)3.27 (3.06 3.39)1.44 (1.35 1.49)0.32 (0.21 0.43)Western Europe9.81 (9.47 10.55)1.79 (1.73 1.90)18.22 (17.16 19.16)2.13 (2.00 2.25)0.84 (0.65 1.04)Western sub-Saharan Africa1.14 (0.79 1.56)0.74 (0.56 0.91)2.88 (2.02 3.52)0.87 (0.62 1.09)0.57 (0.48 0.66)Note: ASDR age-standardized death rate95% CI 0.83 0.87; EAPC of low-middle SDI: 0.93, 95%CI 0.89 0.98). As for a specific geographical zone, Western Europe, South Asia, and high-income North America zones were the top 3 regions with the most AMLrelated deaths (Western Europe: 9.81 103 death casesin 1990 and 18.22 103 death cases in 2017; South Asia:7.60 103 death cases in 1990 and 18.07 103 deathcases in 2017; high-income North America: 6.98 103death cases in 1990 and 13.21 103 death cases in2017). Andean Latin America had the fastest rise inASDR (EAPC 1.87, 95% CI 1.73 2.01). Subgroup analysis by country or territory showed that the USA, India,and China were the top 3 countries with the most deathcases (1990: 6.4 103, 5.7 103, and 4.5 103, respectively; 2017: 12.0 103, 13.8 103, and 7.1 103, respectively) (Fig. 2b) (Additional file 1: Table S2 andTable S8). The UK had almost the highest ASDR in1990 and 2017 (ASDR 2.9 in 1990, ranking second;ASDR 2.8 in 2017, ranking second) (Fig. 3b) (Additional file 1: Table S5 and Table S11). El Salvador and
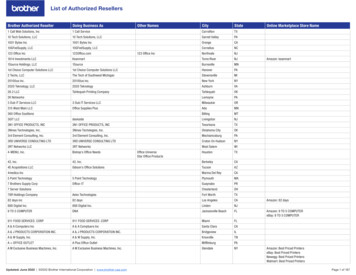
Yi et al. Journal of Hematology & Oncology(2020) 13:72Ecuador had the most rapid increase in ASDR (El Salvador: EAPC 3.62, 95% CI 2.93 4.31; Ecuador: EAPC 3.53, 95% CI 3.13 3.93) (Additional file 1: Table S14).The DALY and its change trend of AMLIn the globe, the DALY was increased from 2063.15 103 in 1990 to 3221.47 103 in 2017 (Table 3) (Fig. 1c).Compared with female, male population was the maincontributor to the rapidly elevated DALY (male: 1088.68in 1990 and 1868.89 in 2017, EAPC 0.46, 95% CI0.41 0.51; female: 974.48 in 1990 and 1352.58 in 2017,EAPC 0.31, 95% CI 0.37 0.24). Subgroup analysis by socio-demographic factor demonstrated that although the high SDI region had the highest DALY from1990 to 2017 (610.21 103 in 1990 and 861.46 103 in2017), the age-standardized DALY rate in the high SDIregion was modestly decreased in the past 28 years. Inthe contrast, the age-standardized DALY rate in themiddle SDI and low-middle SDI regions were graduallyincreased (middle SDI: EAPC 0.61, 95% CI 0.58 0.65;low-middle SDI: EAPC 0.74, 95% CI 0.69 0.79). Insubgroup analysis by geographical zone, we found thatSouth Asia had the highest DALY until 2017 (369.72 103 in 1990 and 705.85 103 in 2017). Andean LatinAmerica had the most sharply increase in agestandardized DALY rate (EAPC 1.59, 95% CI1.46 1.73). In the level of country or territory, India,China, and the USA had the most DALY (272 103, 235 103, and 167 103 in 1990, respectively; 501 103,262 103, and 258 103 in 2017, respectively) (Fig. 2c)(Additional file 1: Table S3 and Table S9). Brunei hadnearly the highest age-standardized DALY rate from1990 to 2017 (81 in 1990, ranking sixth; 105 in 2017,ranking first) (Fig. 3c) (Additional file 1: Tables S6 andS12). Ecuador had the fastest increase in age standardDALY rate during the past 28 years (EAPC 3.19, 95%CI 2.81 3.57) (Additional file 1: Table S15).The correlation between SDI and AML’s incidence andmortalityFirstly, we calculated the correlation coefficient betweenASIR in 1990 and the corresponding EAPC value. Wefound that the EAPC of ASIR was negatively correlated with ASIR in 1990 (correlation coefficient 0.36,P 0.0001) which indicated that the incidence might beunderestimated in regions with a low incidence rate(Fig. 4a). By calculating Pearson’s correlation coefficient,we assessed the correlation between SDI in 2017 andEAPC values of ASIR, ASDR, and age-standardized DALYrate in 195 countries. The results showed that the correlations between SDI and EAPCs of ASIR/ASDR were notstatistically significant (Fig. 4b, c). However, the EAPC ofage-standardized DALY rate was remarkably negativelycorrelated with SDI (Fig. 4d). Then, we investigate thePage 8 of 16correlation between SDI and ASIR, ASDR, and agestandardized DALY rate in 21 regions around the globe.The results showed that all ASRs values were markedlypositively correlated with SDI (correlation coefficient ofASIR 0.623, of ASDR 0.605, of age-standardizedDALY rate 0.512, all P values 0.0001) (Fig. 5a–c).The AML’s incidence and age structureWe analyzed the incidence and its rate in five differentage groups: under 5 years, 5 14 years, 15 49 years,50 69 years, and above 70 years in the globe and different regions. The results demonstrated that most incidences were aged 50 years or older in the globe. Besides,in the high SDI region, patients aged 50 years or olderaccounted for approximately 80% AML’s incidence casesin 2017. In the low SDI regions, this ratio of patientsaged 50 years or older in total incidences was about 35%(Fig. 6a). In all age groups, the incidence rate of patientsaged 70 years or older was highest especially in the highSDI region (Fig. 6b).The AML-related mortality attributable risk factorsWe searched the GBD database for the potential AMLrelated mortality attributable risk factors. Eventually, wefound four risk factors contributing to AML-relateddeath and DALY: high body mass index, occupationalexposure to benzene, occupational exposure to formaldehyde, and smoking. Among all risk factors, smokingwas the greatest contributor to AML-related death andDALY from 1990 to 2017 in the globe (Fig. 7a, b). Smoking was the second leading risk factor, and its contribution ratio was rapidly increased during the 28 years(Additional file 1: Figs. S1 and S2). For regions with different SDI values, it was observed that the influence ofoccupation exposure to carcinogens in the low SDI region was significantly higher than in the high SDIregion.DiscussionIn this study, we reported the incidence, death, andDALY data of AML based on GBD database. Besides, weanalyzed the epidemiological trends of AML by calculating the EAPC values during the past 28 years. Generally,the AML’s incidence and related death were graduallyincreased in the globe. We found the incidence rate ofAML was significantly higher in high SDI countries suchas the UK which could be attributed to better cancerdiagnosis and registry system, as well as populationaging in these countries. Actually, aging is an importantfactor contributing to leukemogenesis. Accompanied byaging, multiple cancer-associated events occur includinggenomic alterations, protein homeostasis dysregulation,and mitochondrial dysfunction [33]. As an essential stepof myeloid leukemogenesis, pre-leukemic clone acquires
974.48 (746.51 1580.45)329.85 (230.63 545.05)250.16 (133.49 575.40)Low-middle SDILow SDI62.39 (37.66 110.88)102.63 (98.18 106.74)183.11 (79.19 188.19)158.77 (103.98 269.53)3.52 (2.50 5.64)369.72 (235.28 688.01)133.06 (89.81 238.42)23.26 (21.47 25.14)20.25 (14.92 23.42)Eastern sub-Saharan AfricaHigh-income Asia PacificHigh-income North AmericaNorth Africa and Middle EastOceaniaSouth AsiaSoutheast AsiaSouthern Latin AmericaSouthern sub-Saharan Africa20.44 (14.74 31.95)255.31 (182.27 403.90)20.60 (11.43 45.70)Central sub-Saharan Africa125.38 (103.21 134.11)63.33 (60.51 72.47)Central Latin AmericaEast Asia68.30 (63.12 74.47)Central EuropeEastern Europe39.92 (25.87 64.43)30.95 (26.26 37.11)Central Asia78.76 (74.99 82.18)32.29 (23.32 38.31)31.77 (28.93 34.56)261.12 (222.66 306.94)705.85 (611.78 813.39)7.00 (5.11 10.58)240.16 (200.29 292.56)284.65 (273.72 296.64)116.96 (109.06 124.24)151.95 (110.81 187.83)100.72 (93.99 107.63)287.95 (237.67 325.95)44.34 (31.22 66.31)112.92 (106.23 118.37)83.31 (76.99 87.51)40.44 (36.85 44.28)20.14 (17.34 24.90)23.80 (21.54 26.17)26.54 (19.08 31.12)482.40 (384.94 561.43)650.74 (568.11 755.33)704.89 (616.44 764.59)515.17 (458.32 545.11)861.46 (826.28 888.95)1352.58 (1179.10 1523.70)1868.89 (1585.26 2016.44)3221.47 (2890.15 3438.43)44.59 (32.55 52.50)45.14 (41.04 49.30)40.17 (34.35 47.00)42.6 (37.00 48.84)58.37 (43.45 84.18)42.22 (35.14 51.02)57.13 (54.81 59.92)41.07 (37.61 44.39)43.83 (33.07 52.92)40.05 (36.99 43.33)19.47 (16.08 22.07)41.07 (28.80 50.97)44.64 (41.90 46.78)52.34 (48.18 55.40)44.91 (40.95 49.13)42.78 (36.63 53.61)62.73 (56.85 69.03)44.19 (31.90 51.59)41.21 (33.14 46.98)40.40 (35.56 47.05)33.32 (29.19 36.24)34.99 (31.06 37.15)51.97 (49.74 53.94)34.54 (30.02 39.09)49.20 (41.72 53.11)41.67 (37.33 44.54)Age-standardized DALY rate/100,000No. (95% CI) 0.21 ( 0.55 0.14) 0.13 ( 0.24 0.01)1.05 (0.93 1.16)0.59 (0.51 0.66)0.15 (0.07 0.23) 0.38 ( 0.49 0.26) 0.1 ( 0.29 0.08) 0.96 ( 1.13 0.80)0.72 (0.62 0.82) 1.3 ( 1.44 1.16) 0.39 ( 0.55 0.24) 0.01 ( 0.14 0.12)0.41 (0.32 0.50)0.39 (0.27 0.51)0.38 (0.25 0.51) 0.12 ( 0.28 0.04) 1.18 ( 1.37 0.98)1.59 (1.46 1.73)0.30 (0.26 0.33)0.74 (0.69 0.79)0.61 (0.58 0.65) 0.55 ( 0.62 0.49) 0.20 ( 0.34 0.06) 0.31 ( 0.37 0.24)0.46 (0.41 0.51)0.13 (0.07 0.18)EAPCNo. (95% CI)1990–2017(2020) 13:7244.10 (32.64 51.71)47.14 (43.50 50.96)31.44 (22.75 52.67)35.87 (25.05 59.11)57.85 (42.37 85.48)49.15 (32.55 77.32)58.14 (56.87 59.63)56.08 (53.16 58.77)35.26 (24.60 54.37)54.04 (44.37 58.01)39.86 (38.41 44.41)51.31 (46.80 56.44)44.07 (38.45 52.24)45.23 (36.60 68.30)17.46 (16.64 18.20)15.52 (12.25 24.46)Australasia31.52 (24.54 42.87)37.25 (23.51 72.49)32.91 (24.57 50.01)28.15 (23.30 38.17)40.80 (35.79 51.00)56.05 (54.22 57.91)37.59 (29.52 59.04)43.73 (38.41 53.39)40.44 (34.40 54.66)Caribbean11.75 (8.62 16.79)Andean Latin AmericaRegion447.39 (390.99 561.34)419.96 (338.90 589.84)High-middle SDIMiddle SDI610.21 (593.61 628.16)High SDISocio-demographic factor1088.68 (933.08 1391.83)Female2063.15 (1709.81 2905.02)MaleSexOverall2017DALYNo *103 (95% CI)DALYNo *103 (95% CI)Age-standardized DALY rate/100,000No. (95% CI)1990Table 3 The DALY of AML in 1990/2017 and temporal trendsYi et al. Journal of Hematology & OncologyPage 9 of 16
DALY disability-adjusted life years54.79 (52.76 57.05)254.91 (246.17 265.24)66.12 (41.01 101.06)Western EuropeWestern sub-Saharan Africa32.44 (22.56 43.65)52.92 (49.84 55.71)76.82 (71.52 81.77)Tropical Latin America170.78 (117.14 208.56)365.39 (343.08 386.36)113.41 (106.70 118.33)2017DALYNo *103 (95% CI)DALYNo *103 (95% CI)Age-standardized DALY rate/100,000No. (95% CI)1990Table 3 The DALY of AML in 1990/2017 and temporal trends (Continued)37.83 (26.76 46.50)54.91 (51.16 58.51)50.65 (47.54 53.23)Age-standardized DALY rate/100,000No. (95% CI)0.47 (0.34 0.60)0.13 ( 0.06 0.32) 0.12 ( 0.22 0.02)EAPCNo. (95% CI)1990–2017Yi et al. Journal of Hematology & Oncology(2020) 13:72Page 10 of 16
Yi et al. Journal of Hematology & Oncology(2020) 13:72Page 11 of 16Fig. 4 The correlation analyses of EAPCs-ASIR (1990) and EAPCs-SDI (2017). a The correlation between EAPC of ASIR and ASIR of 1990 in 195countries or territories, b the correlation between EAPC of ASIR and SDI of 2017 in 195 countries or territories, c the correlation between EAPC ofASDR and SDI of 2017 in 195 countries or territories, and d the correlation between EAPC of age-standardized DALY rate and SDI of 2017 in 195countries or territories. The size of circle represents the quantity of AML patients in one country or t
demographic index (SDI) was also downloaded for the following correlation analysis. SDI values range between 0 and 1 which reflect the degree of social development. Statistical analysis Annual incidence cases, deaths, DALYs, and correspond-ing age-standardized rates (ASRs) were used to describe the burden to AML. ASRs could exclude the interfer-