Transcription
Zhang et al. BMC Cardiovascular Disorders (2018) 18:18DOI 10.1186/s12872-018-0761-0RESEARCH ARTICLEOpen AccessBurden of Ischaemic heart disease andattributable risk factors in China from 1990to 2015: findings from the global burden ofdisease 2015 studyGanshen Zhang1, Chuanhua Yu1* , Maigeng Zhou2, Lu Wang1, Yunquan Zhang1 and Lisha Luo1AbstractBackground: Ischaemic heart disease (IHD) is a major barrier to sustainable human development, but its healthburden and geographic distribution among provinces of China remain unclear. This study aimed to estimate IHDburden in provinces of China, and attributable to risk factors from 1990 to 2015.Methods: Data were collected from the Global Burden of Disease 2015 Study, which evaluated IHD burden andattributable risk factors using deaths and disability-adjusted life years (DALYs). Statistical models including cause ofdeath ensemble modelling, Bayesian meta-regression analysis, and comparative risk assessment approaches wereapplied to reduce bias and produce comprehensive results of IHD deaths, DALYs and attributable risks. The 95%uncertainty intervals (UIs) were calculated and reported for mortality and DALYs.Results: The age-standardised death rate per 100,000 people increased by 13.3% from 101.3 (95%UI: 95.3–107.5) to114.8 (95%UI: 109.8–120.1) from 1990 to 2015 in China, whereas the age-standardised DALY rate declined 3.9% to1760.2 per 100,000 people (95%UI: 1671.6–1864.3). In 2015, the age-standardised death rate per 100,000 people wasthe highest in Heilongjiang (187.4, 95%UI: 161.6–217.5) and the lowest in Shanghai (44.2, 95%UI: 37.0–53.1), and theage-standardised DALY rate per 100,000 people was the highest in Xinjiang (3040.8, 95%UI: 2488.8–3735.4) and thelowest in Shanghai (524.4, 95%UI: 434.7–638.4). Geographically, the age-standardised death and DALY rates for southernprovinces were lower than northern provinces, especially in southeastern coastal provinces. 95.3% of the IHD burden inChina was attributable to environmental, behavioural and metabolic risk factors. The five leading IHD risks in 2015 werehigh systolic blood pressure, high total cholesterol, diet high in sodium, diet low in whole grains, and smoking.Conclusions: Population growth and ageing has led to a steady increase in the IHD burden. Regional disparities in IHDburden were observed in provinces of China. The distribution characteristics of IHD burden provide guidance for decisionmakers to formulate targeted preventive policies and interventions.Keywords: Ischaemic heart disease, Mortality, Disability-adjusted life years, Risk factors* Correspondence: YuCHua@whu.edu.cn1Department of Epidemiology and Biostatistics, School of Health Sciences,Wuhan University, #185 Donghu Road, Wuhan, Hubei 430071, ChinaFull list of author information is available at the end of the article The Author(s). 2018 Open Access This article is distributed under the terms of the Creative Commons Attribution 4.0International License (http://creativecommons.org/licenses/by/4.0/), which permits unrestricted use, distribution, andreproduction in any medium, provided you give appropriate credit to the original author(s) and the source, provide a link tothe Creative Commons license, and indicate if changes were made. The Creative Commons Public Domain Dedication o/1.0/) applies to the data made available in this article, unless otherwise stated.
Zhang et al. BMC Cardiovascular Disorders (2018) 18:18BackgroundCardiovascular diseases (CVDs), which accounted forone-third of global deaths in 2015, are recognised as amajor barrier to sustainable human development [1, 2].Of all CVDs, ischaemic heart disease (IHD) is one of theleading causes of mortality and disease burden worldwide [3], resulting in approximately 8.9 million deathsand 164.0 million disability-adjusted life years (DALYs)globally in 2015 [4–6]. A number of risk factors havebeen found to be associated with IHD such as hypertension, high total cholesterol, diet high in sodium, andsmoking [7–9]. Additionally, mortality from IHD hasdecreased in developed countries in the past threedecades [10] but has increased continuously in manylow- and middle- income countries [11–14].China, one of the largest developing countries in theworld, has undergone rapid health transition in the pastdecades under the background of economic growth andsocial change. The prevalence and mortality of noncommunicable diseases (NCDs), including IHD, has beenrising rapidly in China [15]. Therefore, the ChineseGovernment has implemented the Plan of Healthy China2030 in response to the Sustainable Development Goals(target 3.4.1) by the United Nations to reduce prematuremortality from major NCDs [16, 17]. Furthermore, IHD isone of the major health threats to Chinese people and wasthe second leading causes of mortality next to stroke in2013 [18]. However, IHD burden and its geographic distribution among provinces of China remain unclear due tothe lack of comparable data. The Global Burden ofDiseases, Injuries, and Risk Factors 2015 Study (GBD2015) estimated health lost from fatal and non-fatal outcomes by integrating all available data on incidence,prevalence, and mortality to produce accurate, consistent,transparent, and up-to-date estimates for global, regions,nations, and subnational regions for some countries[2, 19]. In this study, we aimed to estimate thedisease burden of IHD on mortality and DALYs invarious provinces of China, as well as DALYs attributed to IHD risk factors, by using the data from theGBD 2015 study.MethodsData sourcesData for this study were obtained from the GBD 2015study, which estimated the burden of 315 diseases andinjuries, 2619 unique sequelae, and 79 risk factors in 195countries worldwide from 1990 to 2015 [4–7]. Originaldata from three main data sources including the DiseaseSurveillance Points (DSPs), the Maternal and ChildSurveillance System, and the Chinese Center for DiseaseControl and Prevention (CDC) Cause of Death ReportingSystem were adapted by the GBD 2015 collaborators toestimate outcomes of IHD in China. IHD cases werePage 2 of 13identified using the World Health Organization clinicalcriteria and the 10th revision of the InternationalClassification of Diseases and Injuries (ICD-10) dischargediagnosis codes (codes I20-I25).Mortality, disability-adjusted life years and risk factorsThe general methodological approaches of GBD 2015and the specific methodology used to study IHD inChina have been described elsewhere [4–7]. We usedmortality and DALYs to measure the burden caused byIHD. DALYs from IHD consisted of two parts, years oflife lost (YLLs) that quantifies life loss caused by premature mortality from fatal IHD and years lived with disability (YLDs) that evaluates health loss from living withnon-fatal IHD sequelae such as non-fatal myocardialinfarction, angina, and ischaemic heart failure [6, 20].Cause of Death Ensemble modelling (CODEm) was theprincipal method adapted to estimate fatal IHD mortality and YLLs [4]. Prevalence for non-fatal IHD sequelaewas estimated using Bayesian meta-regression analysisusing the DisMod-MR 2.1 software, and its disabilityweight was evaluated by population-based health surveysand an open web-based survey [5, 21]. We computedDALYs via the summation of YLLs and YLDs [5].Comparative risk assessment (CRA) approaches wereused to evaluate the number of excess DALYs from IHDobserved in a given year that can be attributed to pastexposure to a risk factor [7]. We used the revised GBD2015 global population age standard to determine all theage-standardised death and DALY rates.Uncertainty intervalFor each estimated rate and number of deaths and DALYs,we reported its 95% uncertainty interval (UI), which wasestimated by taking 1000 samples from the posterior distribution of each quantity and using the 25th and 975thordered draws of the uncertainty distribution [4–7].ResultsMortalityThe IHD death rate per 100,000 people in China increased significantly from 52.2 (95%UI: 49.2–55.6) in1990 to 105.6 (95%UI: 101.0–110.8) in 2015. A total of1461.2 thousand IHD deaths (95%UI: 1396.8–1532.9)occurred in 2015 in China compared to 6,03.1 thousandin 1990. IHD deaths accounted for 15.5% of all deaths in2015, ranking only next to stroke (20.1%), with a sharpincrease from 6.8% in 1990. Nevertheless, the agestandardised death rate only increased slightly in bothmales (19.5%) and females (4.5%) from 1990 to 2015. Ofall IHD deaths in 2015, 58.0% were in males and 66.4%were in those aged 70 years.Table 1 provides the number of deaths and agestandardised death rates from IHD in various provinces
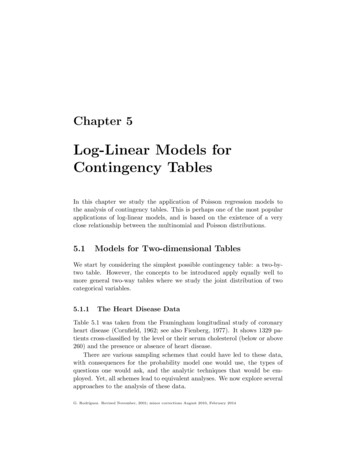
Zhang et al. BMC Cardiovascular Disorders (2018) 18:18Page 3 of 13Table 1 Number of deaths and age-standardised death rates from ischaemic heart disease with percent change, 1990–2015, in provincesof ChinaLocationsNumber of deaths (thousand)Age-standardized death rate per 100,000 people19902015% change19902015% 6.5(74.7–100.6) 0.7(57.7–84.1) 5.4)91.5(72.7–113.2) 58.3–242.3)187.4(161.6–217.5) 119.8(96.2–144.7)152.4(127.7–181.4)27.2Hong Kong Special AdministrativeRegion of 03.6)58.3(52.1–67.7) 7)139.2(118.1–163.3)40.0Inner 03.3201.9(165.0–248.9)182.0(148.4–223.1) 129.6(104.3–156.8)135.7(117.6–157.1)4.7Macao Special AdministrativeRegion of 3.2–194.4)83.1(64.7–103.2) .6
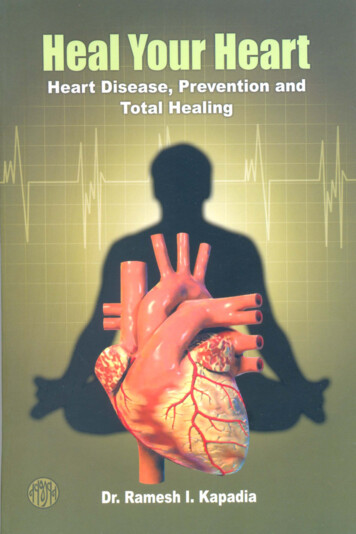
Zhang et al. BMC Cardiovascular Disorders (2018) 18:18Page 4 of 13Table 1 Number of deaths and age-standardised death rates from ischaemic heart disease with percent change, 1990–2015, in provincesof China (Continued)LocationsNumber of deaths (thousand)Age-standardized death rate per 100,000 people19902015% change19902015% 57.6(46.3–69.2)44.2(37.0–53.1) 08.4)75.4(60.3–92.4) .6(110.3–168.7) –53.8) 21.2of China from 1990 to 2015. In 2015, Shandong had thegreatest number of IHD deaths at 146.4 thousand(95%UI: 123.6–171.5), and Heilongjiang had the highestage-standardised death rate at 187.4 per 100,000 people(95%UI: 161.6–217.5) followed by Jilin and Xinjiang. Thelowest age-standardised death rate occurred in Shanghaiwith 44.2 per 100,000 people (95%UI: 37.0–53.1)followed by Zhejiang and Hong Kong. Age-standardiseddeath rates for southern provinces were lower thannorthern provinces, especially in southeastern coastalprovinces such as Shanghai, Zhejiang, Hong Kong,Jiangsu, and Fujian (Fig. 1a). Age-standardised deathrates for 22 provinces increased while the remaining 11provinces decreased between 1990 and 2015; the highestincreases occurred in Qinghai (54.0%), Shandong, andHunan, and the largest declines were observed in Macao( 52.3%), Hong Kong, and Beijing.YLLs and YLDsIn 2015, YLLs from IHD was 24,407.2 thousand personyears (95%UI: 23,041.1–25,809.1), which increased by84.6% from 13,221.8 thousand (95%UI: 12,382.0–14,098.7)in 1990. However, the age-standardised YLL rate per100,000 people decreased 4.3% from 1761.1 (95%UI:1656.4–1877.2) in 1990 to 1671.9 (95%UI: 1585.1–1763.4)in 2015 (Table 2). Among all provinces, Xinjiang had thehighest age-standardised YLL rate at 2956.7 (95%UI:2403.7–3659.6) in 2015, and the lowest occurred inShanghai at 427.6 (95%UI: 346.8–536.0). Age-standardisedYLL rates for 20 provinces decreased whereas theremaining 13 provinces increased from 1990 to 2015;Macao showed the most rapid decline while Qinghaiexperienced the most rapid increase.IHD caused an estimated 1358.0 thousand YLDs(95%UI: 915.7–1870.3) in China in 2015, which was 2.5times higher than the YLDs in 1990 at 524.6 thousand(95%UI: 352.5–720.2). The age-standardised YLD rateper 100,000 people rose 23.8% from 71.3 (95%UI: 47.9–97.7)to 88.3 (95%UI: 59.4–120.9) (Table 2). All provincesexperienced increases in age-standardised YLD rates between 1990 and 2015. In 2015, the highest age-standardisedYLD rate appeared in Tianjin, followed by Beijing andMacao, whereas the lowest YLD rate occurred in Tibet.For IHD, YLLs was much higher than YLDs, as theYLLs/YLDs ratio for IHD was 25.2 in 1990 and reducedto 18.0 in 2015. Although the ratios decreased for allprovinces during 1990 to 2015, they remained greaterthan 10 for most provinces.DALYsIHD caused a total of 2576.5 thousand DALYs (95%UI:2439.1–2737.4) in China in 2015, accounting for 7.5% oftotal DALYs from all causes, ranking only second tostroke (10.1%). The IHD DALY rate per 100,000 peopleincreased from 1190.7 (95%UI: 1120.9–1268.9) in 1990to 1862.4 (95%UI: 1763.1–1978.6) in 2015. However, theage-standardised DALY rate showed a 3.9% reduction to1760.2 (95%UI: 1671.6–1864.3) in 2015.Table 3 shows the number of DALYs and agestandardised IHD DALY rates for various provinces ofChina in 1990 and 2015. IHD DALYs for all provincesincreased except in Macao. Xinjiang had the highestage-standardised DALY rate at 3040.8 per 100,000people (95%UI: 2488.8–3735.4) in 2015, followed byQinghai and Heilongjiang, while Shanghai, Zhejiang andHong Kong had the lowest rates. Age-standardised
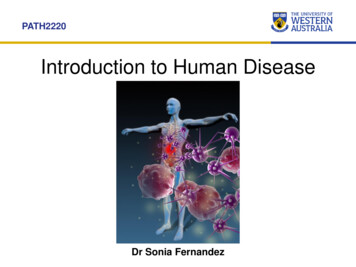
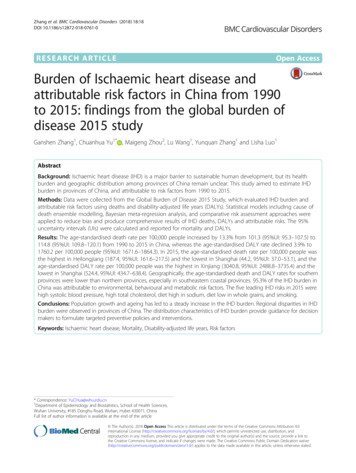
Zhang et al. BMC Cardiovascular Disorders (2018) 18:18Page 5 of 13Fig. 1 Age-standardised death rate (a) and age-standardised DALY rate (b) from ischaemic heart disease for both sexes combined in 2015 inChina. DALYs disability-adjusted life yearsDALY rates for southern provinces were lower thannorthern provinces, especially in southeastern coastalprovinces (Fig. 1b). Nineteen provinces showed a downward trend for age-standardised DALY rates with themost rapid decline observed in Macao, Hong Kong, andBeijing. The remaining 14 provinces showed an upwardtrend, where Qinghai, Guangxi and Yunnan had thefastest growth rate. Before 2005, the age-standardisedDALY rates for most provinces increased except in tenprovinces including Macao, Hong Kong, Hainan, Shanghai,Sichuan, Zhejiang, Beijing, Hubei, Jilin and Heilongjiang.However, after 2005, the age-standardised DALY rates forthe majority of provinces declined except in Guangxi,Qinghai, and Guizhou (Fig. 2and Additional file 1).Risk factorsIn China, 95.3% of IHD DALYs (24,561.9 thousand,95%UI: 23,193.9–26,122.8) were attributable to metabolic, environmental, and behavioural risks and theiroverlaps in 2015 compared to 91.4% of IHD DALYs(12,560.7 thousand, 95%UI: 11,813.6–13,405.6) in 1990.From 1990 to 2015, the proportion of the threemetabolic-related risks and overlaps increased whileother clusters decreased, including metabolic risks alone,interaction of behavioural and metabolic risks, and interaction of metabolic and environmental risks (Fig. 3).A substantial portion of IHD DALYs was attributableto behavioural-related risks, including behaviouralrisks alone (7.8%), interaction of behavioural andmetabolic risks (51.1%), and interaction of behaviouraland metabolic and environmental risks (25.3%).Figure 4 shows the changes to the 22 leading riskfactors for IHD DALYs between 1990 and 2015 in China.In 2015, the five leading IHD risk factors and theirDALY rates per 100,000 people were high systolic bloodpressure (1080.1, 95%UI: 922.5–1226.9), high totalcholesterol (839.4, 95%UI: 685.0–1004.8), diet high insodium (825.2, 95%UI: 586.6–1081.7), diet low in wholegrain (487.3, 95%UI: 302.0–682.2), and smoking (487.0,95%UI: 395.6–581.0). DALY rates for all risk factorsincreased between 1990 and 2015 except for householdair pollution from solid fuels. The largest increase in theDALY rate occurred for diet low in polyunsaturated fattyacids (283.5%), followed by high body mass index(160.6%) and high systolic blood pressure (128.4%).However, only seven risk factors increased in agestandardised IHD DALY rates, while the remaining 15risk factors declined. The age-standardised IHD DALYrate for household air pollution from solid fuels showedthe greatest decline (50.3%). Six risk factors, includinghigh systolic blood pressure (2nd to 1st), diet low inwhole grains (5th to 4th), ambient particulate matter
Zhang et al. BMC Cardiovascular Disorders (2018) 18:18Page 6 of 13Table 2 Age-standardised YLL and YLD rates and YLLs/YLDs ratios for ischaemic heart disease in 1990 and 2015 in provinces of ChinaProvinceAge-standardized YLLrate per 100,000 peopleAge-standardized YLDrate per 100,000 people19902015China1761.1(1656.4–1877.2)1671.9 40.6(873.1–1251.1) 43.790.4111.323.0(61.4–124.2) 6)1215.7(925.1–1533.8) Fujian1307.5(1054.8–1636.3)925.6(738.6–1128.8) 0.3Guangdong1611.021272.8 21.0(1259.93–2005.35) (1087.1–1502.2)74.291.323.2(50.4–102.4) ��2444.0)1315.4 .29.2(1846.2–2780.1)73.290.022.9(49.8–100.8) 4496.9)2761.8 23.4(2291.2–3302.4)80.298.222.4(54.6–109.3) 0) (63.6–127.8)30.224.0 Hubei1840.911577.4 14.3(1471.74–2290.86) ��112.1)26.623.8Inner Mongolia2829.3(2252.6–3587.8)2371.5 16.2(1935.4–2863.1)78.796.322.2(53.5–108.4) 787.0(653.1–944.7) Jiangxi1703.8(1351.9–2135.7)1482.1 .5 26.0(2088.9–3408.8)80.497.921.8(54.4–110.8) .4)1875.8 16.1(1578.9–2236.1)84.9103.822.2(57.9–115.7) (70.2–142.9)27.616.7Macao Special AdministrativeRegion of China2589.3(2267.0–2883.6)988.1(763.2–1240.8) 61.890.3110.121.9(61.2–124.2) 8.3) (52.2–106.2) (64.8–130.1)24.120.3Hong Kong Special Administrative 1298.6Region of China(1228.1–1434.1)699.7(624.8–794.3)% change 19902015YLL/YLDYLL/YLDratio 1990 ratio 2015% change
Zhang et al. BMC Cardiovascular Disorders (2018) 18:18Page 7 of 13Table 2 Age-standardised YLL and YLD rates and YLLs/YLDs ratios for ischaemic heart disease in 1990 and 2015 in provinces of China(Continued)ProvinceAge-standardized YLLrate per 100,000 peopleAge-standardized YLDrate per 100,000 people19902015% change 0) 5YLL/YLDYLL/YLDratio 1990 ratio 2015% change78.596.823.3(53.2–108.0) (65.7–133.2)9.74.175.392.823.2(51.1–104.3) .9–103.5)23.413.71780.0 18.4(1492.3–2154.6)90.8112.223.6(62.2–125.1) 6 56.7 ��114.3)12.16.2 25.6 36.1YLLs years of life lost, YLDs years lived with disabilitypollution (8th to 7th), high fasting plasma glucose (11thto 8th), high body-mass index (14th to 11th), and dietlow in polyunsaturated fatty acids (20th to 19th),increased in rank between 1990 and 2015.DiscussionMain findingsIn this study, we found that the number of deaths andDALYs from IHD have increased significantly in Chinasince 1990, but age-adjusted DALY rate has declined.The IHD burden increased in most provinces before2005 but declined after 2005. Geographically, the IHDburden in southern provinces were lower than northernprovinces, especially in southeastern coastal provinces.Furthermore, 95.3% of the IHD burden in China wasattributable to environmental, behavioural and metabolicrisk factors. The top five IHD risks were high systolicblood pressure, high total cholesterol, diet high insodium, diet low in whole grains, and smoking.Mortality and disability-adjusted life yearsIHD was the second leading cause of disease burden inChina only after stroke. IHD deaths and DALYs havegreatly increased for both sexes since 1990. Moreover,China made the second greatest contribution to globalIHD burden after India, accounting for 15.7% of totalglobal IHD DALYs in 2015 [5]. These findings call forcomprehensive approaches to prevent and reduce theIHD burden in China.The IHD death rate and the DALY rate increasedgreatly, but the age-adjusted death rate and DALY rateshowed no obvious increases between 1990 and 2015.These findings were mainly caused by population growthand ageing during this period. YLLs were the main component of IHD burden in China with over 90% of DALYsattributed to YLLs. A global level assessment has shownthat YLL rates for CVDs increased with the Sociodemographic Index for countries and regions in themiddle of the socio-demographic rankings [4]. Mostprovinces in China remain in the middle of the sociodemographic rankings despite experiencing an increasein the Socio-demographic Index since 1990 [4]. Evidencehas also shown that IHD patients in low- and middleincome countries have less access to affordable and highquality CVD medications [22]. All of these findingsimply that, in most provinces of China, economicgrowth and social development have led to an increasein the life expectancy to allow individuals to survive longenough to develop IHD; however, many of them are notable to access to optimal medical or surgical treatmentsfor IHD. Therefore, both the YLL rate and YLD ratefrom IHD in China have increased significantly since1990. However, age-standardised YLL and DALY rateshave declined, implying improvements in medical careand social security in China that provided more availableand affordable treatments for IHD patients.Differences in the burden of IHD existed betweensexes, time periods, and provinces in China. Withrespect to gender, the IHD burden was higher andincreased more rapidly among males than females.Because females are more sensitive to heath information,females are more likely to seek healthcare and havebetter access to primary prevention compared to males[23]. Regarding time period, the IHD burden in most
Zhang et al. BMC Cardiovascular Disorders (2018) 18:18Page 8 of 13Table 3 Number of DALYs and age-standardised DALY rates from ischaemic heart disease with percent change, 1990–2015, in provincesof ChinaProvinceNumber of DALY (thousand)Age-standardized DALY rate per 100,000 people19902015% change19902015% 1864.3) )67.31939.7(1566.7–2398.3)1151.9(982.1–1369.1) 1) 600.6) .2) .7–3390.3) 43.1)7.5Hong Kong Special AdministrativeRegion of (1290.2–1505.6)786.0(705.7–881.4) ) .0)15.9Inner .12908.1(2332.2–3658.3)2467.7(2026.8–2961.2) )72.21000.0(791.4–1250.3)875.3(739.5–1028.2) ) 58.53666.7(2915.4–4577.5)2752.4(2188.9–3502.6) 5.0) 14.7Macao Special AdministrativeRegion of China6.7(5.9–7.5)6.6(5.3–8.3) 1.12679.6(2355.6–2979.1)1098.2(870.6–1364.4) ��2548.1)13.4
Zhang et al. BMC Cardiovascular Disorders (2018) 18:18Page 9 of 13Table 3 Number of DALYs and age-standardised DALY rates from ischaemic heart disease with percent change, 1990–2015, in provincesof China (Continued)ProvinceNumber of DALY (thousand)Age-standardized DALY rate per 100,000 people19902015% change19902015% .5)49.0881.2(715.2–1062.1)524.4(434.7–638.4) 4.6) ) 9.3(2113.4–3645.6)2328.8(1890.5–2913.8) .4) .4)46.2932.8(753.9–1133.3)635.9(524.2–763.4) 31.8DALYs disability-adjusted life yearsprovinces increased before 2005 but declined afterwards.This transition occurred for multiple reasons. Theincrease before 2005 was mainly caused by the increase inprevalence of IHD risk factors such as hypertension, dyslipidaemia, and ambient particulate matter pollution [15].The IHD burden declined after 2005 partly due to theimplementation of many important strategies related totobacco use, diet, physical activities, and harmful use ofalcohol to prevent and control NCDs [24–26]. In addition,improvement in IHD treatments and the application ofFig. 2 Annual average percent change of age-standardised DALY rates from ischaemic heart disease for both sexes combined in China befor
Sep 12, 2016 · China was attributable to environmental, behavioural and metabolic risk factors. The five leading IHD risks in 2015 were high systolic blood pressure, high total cholesterol, diet high in sodium, diet low in whole grains, and smoking. Conclusions: Population growth and ageing has led to a st