Transcription
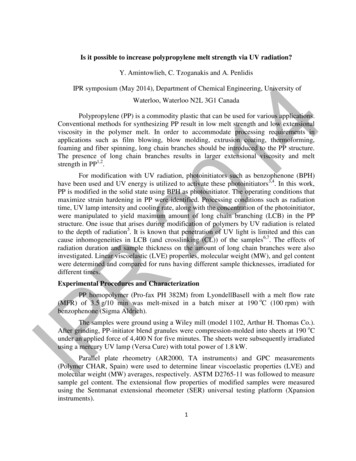
Is it possible to increase polypropylene melt strength via UV radiation?Y. Amintowlieh, C. Tzoganakis and A. PenlidisIPR symposium (May 2014), Department of Chemical Engineering, University ofWaterloo, Waterloo N2L 3G1 Canada14Polypropylene (PP) is a commodity plastic that can be used for various applications.Conventional methods for synthesizing PP result in low melt strength and low extensionalviscosity in the polymer melt. In order to accommodate processing requirements inapplications such as film blowing, blow molding, extrusion coating, thermoforming,foaming and fiber spinning, long chain branches should be introduced to the PP structure.The presence of long chain branches results in larger extensional viscosity and meltstrength in PP1,2.R20For modification with UV radiation, photoinitiators such as benzophenone (BPH)have been used and UV energy is utilized to activate these photoinitiators3,4. In this work,PP is modified in the solid state using BPH as photoinitiator. The operating conditions thatmaximize strain hardening in PP were identified. Processing conditions such as radiationtime, UV lamp intensity and cooling rate, along with the concentration of the photoinitiator,were manipulated to yield maximum amount of long chain branching (LCB) in the PPstructure. One issue that arises during modification of polymers by UV radiation is relatedto the depth of radiation5. It is known that penetration of UV light is limited and this cancause inhomogeneities in LCB (and crosslinking (CL)) of the samples6,7. The effects ofradiation duration and sample thickness on the amount of long chain branches were alsoinvestigated. Linear viscoelastic (LVE) properties, molecular weight (MW), and gel contentwere determined and compared for runs having different sample thicknesses, irradiated fordifferent times.Experimental Procedures and CharacterizationPP homopolymer (Pro-fax PH 382M) from LyondellBasell with a melt flow rate(MFR) of 3.5 g/10 min was melt-mixed in a batch mixer at 190 oC (100 rpm) withbenzophenone (Sigma Aldrich).IPThe samples were ground using a Wiley mill (model 1102, Arthur H. Thomas Co.).After grinding, PP-initiator blend granules were compression-molded into sheets at 190 oCunder an applied force of 4,400 N for five minutes. The sheets were subsequently irradiatedusing a mercury UV lamp (Versa Cure) with total power of 1.8 kW.Parallel plate rheometry (AR2000, TA instruments) and GPC measurements(Polymer CHAR, Spain) were used to determine linear viscoelastic properties (LVE) andmolecular weight (MW) averages, respectively. ASTM D2765-11 was followed to measuresample gel content. The extensional flow properties of modified samples were measuredusing the Sentmanat extensional rheometer (SER) universal testing platform (Xpansioninstruments).1
A constant stress parallel plate rheometer was used to obtain storage modulus (G'),loss modulus (G"), complex modulus (G*), loss tangent (tan δ), and complex viscosity (η*)at different angular frequencies (ω). Having η* vs. ω, the power-law shear thinning index(n), zero shear viscosity (η 0 ) and relaxation time (λ) of the polymer melt were acquired byfitting the Cross model (Equation 1) to the data8.η01 (ωλ)nEquation 114η It has been observed that long chain branched PP has higher η 0 , λ and lower n thanthe linear parent PP. On the other hand, smaller η 0 , longer Newtonian plateau (smaller λ)and larger shear power-law index compared to the parent PP can be evidenced in degradedlinear PP.Rheological polydispersity indices were determined using Equation 2 and 38.20105Gc (Pa)ER C1 G′at G" 500 PaPI Equation 2Equation 3G c in Equation 2 is the crossover modulus. In Equation 3, C 1 is the slope of thelog (G') versus log (G") curve. It should be noted that ER is only sensitive to thedistribution of high MW chains. Runs with larger ER values indicate a broader distributionof the higher molecular weight chains. Increasing values of PI indicate broadening of themolecular weight distribution (MWD) in general.RResults and DiscussionIPIn order to identify the processing conditions that maximize the LCB level in PP,the process operating conditions (photoinitiator concentration, duration of radiation, UVlamp intensity, cooling air pressure, and combinations thereof) were manipulated within therange summarized in Table 1.Table 1: Selected factors and ranges to find processing conditions for LCBFactorABCDProcess variable (units)Photoinitiator concentration (wt %)Duration of radiation (s)UV lamp intensity (%)Cooling air pressure (%)Ranges0.1-0.5 (with respect to polymer mixture)120-60047-100 (with respect to total lamp intensity)0-100 (with respect to total air flow pressure)D-optimal design of experiments and statistical analysis were utilized to find thecombinations of these variables (within the ranges mentioned in Table 1) that result in thegreatest amount of LCB. Shear thinning index (n), zero shear viscosity(η 0 ), relaxationtime (λ), and ER were calculated using η*, G' and G" vs. ω measurements (Equations 1 to2
3). A criterion can be set for each of these responses (n, η 0 , λ and ER) to identify theprocessing window that results in long chain branching rather than degradation. Table 2shows the chosen criteria to find the optimized processing conditions.Contour plots corresponding to these criteria (Table 2) are shown in Figure 1; theoptimal processing window, which satisfies these limits for the response variables (Table 2)is the yellow area. Figure 1 shows that samples with a high concentration of BPH (above0.2 wt-%) which are radiated for times larger than 4 minutes at low lamp intensity attemperatures below 60 C yield larger amounts of LCB.Criteria 0.57 90,000 0.67 s 2.0R20Responsenη 0 (Pa.s)λ (s)ER14Table 2: Criteria chosen for each response variable to find optimized processing conditionsFigure 1: Conditions that yield high degree of LCBIPTwo runs in the processing range indicated in Figure 1 were chosen along with theparent PP for extensional rheometry measurements. The processing conditions for thesetwo runs are cited in Table 3.Table 3: Experimental conditions of the runs chosen within the optimized regionRun IDPP12Photoinitiator concentration(wt%)0.50.3Duration of radiation(s)600360UV lamp intensity (%)4774Figure 2 shows the uniaxial tensile stress growth coefficient (η E ) of the parent PPand runs 1, 2 at four different Hencky strain rates (0.01, 0.1, 1 and 10 s-1). The dashed linesin Figure 2 represent three times the shear stress growth coefficient (i.e., 3η 0 (t)). Theparent PP shows a slight increase in uniaxial tensile stress growth, which might be due to3
the presence of high MW linear chains and the broad MWD of the parent PP. η E clearlyincreased at all strain rates for runs 1 and 2 (compared to the parent PP). This provides clearand convincing evidence of a larger melt strength in runs 1 and 2, which have beenmodified under the conditions of Figure 1.Uniaxial tensile stress growthcoefficient, η E (Pa.s)1.00E 111.00E 10ἐ 10ἐ 1ἐ 0.1ἐ 0.011.00E 091.00E 071 1011.00E 061.00E 05PP1.00E 041.00E 031.00E-02142 1041.00E 083η 0(t)1.00E-011.00E 001.00E 011.00E 021.00E 0320Time, t (s)Figure 2: Uniaxial tensile stress growth coefficient (η E ) at Hencky strain rates of 0.01, 0.1, 1 and 10 s-1The next goal of this work was to study the effects of UV penetration depth alongwith UV radiation duration on the amount of LCB in the modified samples. For thispurpose, solid discs (PP mixed with 0.5 wt-% BPH) with different thicknesses wereradiated for different lengths of time at the same processing window of Figure 1 (47 %lamp intensity). Three-level factorial design experiments were conducted (Table 4). InTable 4, run 10 is PP after melt mixing with BPH and run 11 is the parent PP.RTable 4: Design of experiments for 3-level factorial designIPRun ID1234567891011BPH (wt-%)0.50.50.50.50.50.50.50.50.50.50Thickness-A (mm)11122233311Time-B (min)51015510155101500Values for η 0 , λ, n and polydispersity indices (PI and ER) of the runs aresummarized in Table 5. It can be seen that all radiated runs (1 to 9) have larger η 0 , λ, PIand ER, and lower n values compared to run 10, which is PP after melt mixing with BPH.Comparison between runs 1, 2 and 3 shows that longer exposure time to UV results inlarger η 0 , λ, PI and lower n values (Table 5). This trend is also observed for the 2 mm (runs4
4, 5 and 6) and 3 mm (runs 7, 8, and 9) samples. On the other hand, an increase in thethickness of the samples limits UV light penetration and subsequently results in lower η 0 , λand higher n at the same exposure times (compare runs 1, 4 and 7, or 2, 5 and 8, or 3, 6 and9). This is because all these LVE constants are indicators of an average property within thesample. Therefore, due to the limited UV penetration in the samples, formation of LCB orCL is not uniform in thicker samples.14In order to investigate the presence of gel (due to crosslinking) in each run, resultsfrom extraction experiments are also summarized in Table 5. Increases in radiation timecause larger percentage of CL (gel) in the samples with the same thickness. Moreover, adecrease in thickness increases the percentage of gel in the runs. An increase in gel contentupon increasing radiation time is more significant at low thicknesses. This is the same trendobserved in rheological properties earlier.Table 5: Viscoelastic properties, molecular weight and gel content of the runsη 0 (kPa.s)λ 1.031.281.390.821.27Gel(%) 02.210.60.20.81.8 00.61.6 0 0 n 8.4 w 77.9317.9361.420RunID1234567891011 z 4.6RThese results have recently been extended to include the effect of acrylic co-agenton PP modification, and these more recent results will be discussed during the IPR postersession (in a related poster).ReferencesIP1. A. Gotsis, B. Zeevenhoven and A. Hogt, Polym. Eng. & Science 44, 973-982 (2004).2. D. Graebling, Macromolecules, 35, 4602-4610 (2002).3. N. Kukaleva; K. Stoll and M. Santi, U.S. Patent No. 2011,0136,931. (9 June, 2011).4. Y. Amintowlieh, C. Tzoganakis, S. G. Hatzikiriakos and A. Penlidis, Polymer Degrad.Stab. (2014).5. P. Zamotaev, E. Shibirin and Z. Nogellova, Polymer Degrad. Stab. 47, 93-107 (1995)6. Y. L. Chen and B. Rånby, J. Polym. Sci. Part A: Polym. Chem. 27, 4077-4086 (1989).7. Y. Amintowlieh, C. Tzoganakis, and A. Penlidis, J. Appl. Polym. Sci., under review(2014).8. R. Shroff and H. Mavridis, J. Appl. Polym. Sci. 57, 1605-1626 (1995).5
OverviewIs It Possible to Increase PolypropyleneMelt Strength via UV Radiation?Why? Why is melt strength important? Why UV radiation?How? How to increase PP melt strength? How to optimize the procedure?Yasaman Amintowlieh, Costas Tzoganakis, and Alexander Penlidis14Institute for Polymer Research, Department of Chemical Engineering,University of Waterloo, Waterloo, Ontario, N2L 3G1, CanadaWhat?Why is melt strength important for PP? What are the limitations? What are the solutions?220Why UV radiation? Melt strength: polymer resistance to extensional deformationHow to increase PP meltstrength?FoamingFiberspinning eroxides Chain interactionsBlowmoulding Toxic Controllingthe processRIPHow UV irradiation can be used for PPmodification (mechanism)OHν3OO Requiresnew plantsUV radiation Safe Available Easy tocontrol Affordable4 β-scission1SynthesisHow UV irradiation can be used for PPmodification (mechanism)UV irradiationPhotoinitiator Cost Availability SafetyWhy UV?Long chain branching(LCB)3[1,2]e-beam andgamma*ODisproportionationDegradation* Linear polymer Short chains & narrowmolecular weightdistribution Chain combination PP chainLong chain branchingHydrogen abstraction[7]56
How to modify PP via UV irradiation(process steps)What are the processing factors/variables? Processing variables and rangesIrradiation with UV lampFactorProcess variable (units)RangeAPhotoinitiator (PI) concentration (wt %)0.1-0.5BDuration of radiation (s)120-600CUV lamp intensity (%)47-100DCooling air pressure (%)0-100EType of photoinitiator (N/A)BPH and DEBPHMixing PP withphotoinitiator (PI)IrradiationPP Design of experiments D-optimal; Design Expert was used; 32 experimental runs Responses Viscoelastic properties (η0, λ and n) Rheological polydispersity indices (PI and ER)HotpressGrind14PI[8]7820Extensional viscosity 2 runs were chosen from the regionthat shows indications of LCB The viscosity of a polymer melt under extensional stress 1 run from the region that showsevidence of degradation Evaluation of extensional (elongational) viscosityExtensional rheometers: Sentmanat extensional rheometerLong chain branched PP showsRun PI conc.ID(wt-%)600360120477447strain hardening100501003 0(t)9[9,10]10R0.50.30.1UV Coolinglamp rate (%)int.(%)Clear increase in the E of runs 1 and 2Uniaxial tensile stress growthcoefficient, E (Pa.s)IP123Rad.time(s)1.00E 12ἐ 10ἐ 1ἐ 0.1ἐ 0.011.00E 113Possible limitations? 107 Radiation depth (UV penetration limit?)1.00E 101.00E 092 Radiation time 1041.00E 081.00E 0711.00E 061.00E 051.00E 031.00E-02Study the effect of radiation time and depth 101PP3 0(t)1.00E 041.00E-011.00E 001.00E 01Time, t (s)1.00E 02Thickness1.00E 0311[11]Variable (units)Sample thickness (mm)Duration of radiation (min)BPH Concentration (wt-%)UV lamp intensity (%)Cooling air pressure (%)/TemperatureRange1-35-150.547100/( 50 oC)12
The effect of radiation time on complexviscosityThe effect of thickness on complex viscosity1 mm-15 min2 mm-15 min3 mm-15 minParent PP1000.050.555013OO What is the mechanism? What are the challenges?OOOOOOOO14Min gel; Max branching contentOOOOOOOOOOOOOOR500 ObjectiveOOO50 Central composite design of experimentsTMPTAGel ContentOOO5Angular frequency, ω (rad/s)20O0.5Study of the effect of co-agent onlong chain branching and gel contentFurther reduction of radiation duration: Co-agent What are co-agents?1 mm-5 min1 mm-10 min1 mm-15 minParent PP1000.05500Angular frequency, ω (rad/s)1000141000 *(Pa) *(Pa.s)Increase in radiation timeLarger amount of long chain branching1000010000OOOROOOOOOOOOOOOOOVariable (units)Co-agent conc. (wt-%)Range0.25-0.75BPH conc. (wt-%)Radiation duration (s)UV lamp intensity (%)Temperature (oC)0.1-0.54-6547 50Responsen 0 (kPa.s) (s)ERGel content (%)Specs 0.49 50 50 1.3 5OO16R15IPExample of operating mapConcluding RemarksFormation of LCB under these conditions is confirmed via GPCat 35 s radiation High BPH concentrationOROO Low co-agent concentrationOROOOOOOOOOO17 UV radiation is a safe, nontoxic method for PP modification UV radiation can be used to produce long chain branched PP(larger melt strength for packaging, thermoforming, blowmolding, extrusion coating and foaming applications) Variables such as photoinitiator type and concentration, lampintensity, radiation time and temperature affect the process UV penetration depth and radiation time are possible limitationsof the UV modification process Addition of co-agent decreases the radiation time needed forformation of long chain branching significantly US patent application for this work18
Back-up Slides1914Thank you for your attention2020How to characterize long chain branching (LCB) vs. degradationReferences1.Reference for comparisons: Linear PP with broadmolecular weight distribution (MWD)Gotsis A, Zeevenhoven B, Hogt A. The effect of long chain branching on the processability of polypropylene inthermoforming. Polymer Engineering & Science. 2004; 44:973-982Figure copied from : /c2sm27233dGraebling D. Synthesis of branched polypropylene by a reactive extrusion process. Macromolecules. 2002; 35:460246104. Lugao A, Otaguro H, Parra D, Yoshiga A, Lima L, Artel B, Liberman S. Review on the production process and usesof controlled rheology polypropylene--Gamma radiation versus electron beam processing. Radiat Phys Chem. 2007;76:1688-16905. Rätzsch M, Arnold M, Borsig E, Bucka H, Reichelt N. Radical reactions on polypropylene in the solid state. Progressin Polymer Science. 2002; 27:1195-12826. Parent JS, Bodsworth A, Sengupta SS, Kontopoulou M, Chaudhary BI, Poche D, Cousteaux S. Structure-rheologyrelationships of long-chain branched polypropylene: Comparative analysis of acrylic and allylic coagent chemistry.Polymer. 2009; 50:85-947. He G, Tzoganakis C. A UV‐initiated reactive extrusion process for production of controlled‐rheology polypropylene.Polymer Engineering and Science, 2011; 51:151-1578. Amintowlieh Y., Tzoganakis C., Hatzikiriakos S. and Penlidis A. Degradation and Stability 2014; 104:1-10.9. Figure copied from: g-nonlinear-rheological-methods.html10. Figure copied from : http://www.xpansioninstruments.com/products principle.htm11. Amintowlieh Y., Tzoganakis C., and Penlidis A. Accepted in J Appl Polym. Sci. (May 13, 2014)21Rheological propertiesG’ at low frequenciesG’-ω slope at low frequencyDegradationLCB-tan δ-G* (at low G* ranges)Deviations show the effect ofmolecular weight distributionη* at low frequenciesη0Shear thinning index (n)Relaxation time (λ)Rheological polydispersity indicesPI and ER[7,9]CommentsHigher G’more elasticIndication of LCBη 0 molecular weightLower nmore shear thinningShorter plateau region for LCBPI and ERbroader molecularweight distributionG’: Storage modulus G”: Loss modulus tanδ : Loss angle η*: Complex viscosity22PI: Rheological polydispersity index ER: Dispersity of high molecular weight tail of MWD 22R2.3.IPHow to characterize long chain branching (LCB) vs. degradationThe effect of modification on η*-ωReference for comparisons: Linear PP with broadmolecular weight distribution (MWD)η* at low frequenciesη0Shear thinning index (n)Relaxation time (λ)Rheological polydispersity indicesPI and ERDegradation-LCBη 0 molecular weightLower nmore shear thinningShorter plateau region for LCBPI and ERbroader molecularweight distribution2310001000.04G’: Storage modulus G”: Loss modulus tanδ : Loss angle η*: Complex viscosityPI: Rheological polydispersity index ER: Dispersity of high molecular weight tail of MWD[7,9]Runs 1 and 2 have larger η0 ,λ and more shear thinningbehavior (n) compared to theparent PP10000CommentsHigher G’more elasticIndication of LCB (Pa.s)Rheological propertiesG’ at low frequenciesG’-ω slope at low frequency23PP1230.4440Angular frequency (rad/s)40024
The effect of modification on tan δ vs. G* (relatedto molecular weight distribution)The effect of modification on G’-ω100000PPDegraded run100001G'(Pa)52tan ( )Higher energy storage in longerchains at low frequencies31000PP123100In runs 1 and 2, slope is smaller14Long chain ular frequency (rad/s)252020026Examples of operating mapsDEBPH does not show conclusiveevidence for LCBLow temperatureHigh BPH ConcentrationLong radiation timeLow lamp intensity28R27Determining molecular weight distributionsTwo-potIn situsynthesisSingle step:T-reagentsReactiveextrusion teSolidstateRadiationlow molecular weightsIDe-BeamRadiationinextruderRun 3 is shifted 7Runs 1 and 2 have a tail athigh molecular weightsMelt stateMethods toproduceLCB PP[3-8] PP123MnMwMzkg/mol kg/mol kg/molPP0.6W (log M)IPHow to introduce long chain branching (LCB)to 4.55.56.57.5Log(M)30
The effect of modification on intrinsicviscosity [η]1.15Increase in thickness300000.951 mm-15 minG'(Pa)0.75Log [η] Long chainbranched PPhas lower Rgcompared tolinear PPThe effect of thickness on storage modulusPP0.55130002 mm-15 min3 mm-15 min3000.350.15142355.56Log M6.5200.40.350.11 mm-5 min1 mm-10 min3 mm-15 min0.250.2590.20.2580.150.170.261 mm-15 min7Parent PP0.2570.25655.25.45.65.860.050.0501E-050.001 0.110100033R01E-05IPThe effect of radiation time on storagemodulus10000010000G'(Pa)320.2610.3Parent PP0.20.154000.2622 mm-15 min *H( )/ 0 *H( )/ 00.30.25400.451 mm-15 min0.351000100Increase in radiation time0.54Relaxation spectrum H(λ) is the relaxation function0.4100.050.4Angular frequency, ω (rad/s)31The effect of sample thickness on therelaxation spectrum0.45Parent PP300.04-0.0551 mm-5 min1 mm-10 min1 mm-15 minParent PP50Angular frequency, ω (rad/s)500350.001 0.110100034
Parallel plate rheometry (AR2000, TA instruments) and GPC measurements (Polymer CHAR, Spain) were used to determine linear viscoelastic properties (LVE) and molecular weight (MW) averages, respectively. ASTM D276511 was followed to measure - . A constant stress parallel plate rheometer was used to obtain storage modulus (G'),