Transcription
Co-funded by theEuropean UnionSupport to Sustainable Development inLake Turkana and its River BasinsResults of Modelling of Future Scenarios of LakeTurkana and its River BasinsTechnical reportUNEP-DHI Centre Agern Allé 5 DK-2970 Hørsholm DenmarkTelephone: 45 4516 9200 Contact sls@dhigroup.com www.unepdhi.org
EXECUTIVE SUMMARYIntroductionAs part of the tripartite project, including the Federal Democratic Republic of Ethiopia, theRepublic of Kenya and the United Nations Environment Programme (UNEP), on ‘Supportto Sustainable Development in Lake Turkana and its River Basins’ which is being carriedout by the UNEP-DHI Centre on Water and Environment.The project is co-funded by the European Union Emergency Trust Fund for Africa,through its project on "Support for Effective Cooperation and Coordination of Crossborder Initiatives in Southwest Ethiopia-Northwest Kenya, Marsabit-Borana & Dawa, andKenya-Somalia-Ethiopia (SECCCI)”. The overall SECCCI objective is to ensure theeffective cooperation and coordination of cross border initiatives. The specific objectivesof the project ‘Support to Sustainable Development in Lake Turkana and its River Basins’are the following:-Establishing a common scientific understanding of the Lake and its RiverBasins-Set up a monitoring system for Lake Turkana and its River Basins-Capacity building in Transboundary Water Management (TWM) andtransboundary dialogue activities to build trust, confidence, cooperation and ashared vision-Implementing pilot demonstrations for ecosystems rehabilitation.ConclusionsSimulations for the next 20 years predict that climate change may result in a markedincrease in inflow to Lake Turkana, primarily from the Omo River, but also increasedinflow from Kerio and Turkwel rivers. Such a possible increase in inflow will result in anincreasing water level in Lake Turkana. Thus, the flooding which occurred in year 2020,which was considered a rare event, is likely to be become more regular in the futurewithout any adaptation measures. The new evidence of continuing rising lake water levelsis partially based on climate change scenarios and a predicted change in rainfall patternsdue to climate change. These climate change projections, however, are associated with adegree of uncertainty.Mutual gains for both basin countries can be achieved if the basin countries develop anarrangement for water cooperation. Possible transboundary mutual gains betweenClimate Change (CC), Water Resources Developments (WRD) and Rehabilitation andAdaption Measures (RAM) have been identified:-Increased irrigation and other abstractions within the basin may help tocounterbalance increasing water levels in Lake Turkana due to climatechange. Impacts of irrigation on water quality have not been factored in themodel. Irrigation will need to be properly managed to avoid negative effectson water quality, such as agricultural nonpoint source pollution.-Likewise, reforestation and soil and water conservation measures may alsohelp to counterbalance the impact of climate change. However, the effect ofi
increasing water use will be relatively stronger, due to increased evaporationand less runoff from steep headwater catchments.-It will be possible to partly reproduce the seasonality in inflow to LakeTurkana to maintain fish production and at the same time maintain the sameTotal Hydropower Production in the Ethiopian part of the basin.-A cooperation framework should be established to guide planning anddevelopment efforts at the basin scale. The project deliverable “DraftFramework on Transboundary Water Management” addresses this.-Soil and water conservation and reforestation measures will significantly helpreducing the risk of landslides and mudflows as experienced in West PokotCounty, Kenya. It is considered that both countries will benefit from whenimplementing these measures. The benefits will mainly be onsite benefits andwill particularly ensure a more efficient and, not least, more sustainable cropproduction and conversion from other land uses to cultivation.-From a global perspective reforestation and agroforestry may also helpfighting global warming and help restoring habitat loss.-Agroforestry will have two additional advantages: Intercropping crops withleguminous N2-fixing agroforestry species e.g. Acacia and Caleandra, canhelp replenish nitrogen harvested with crops and thereby maintain the Nbalance and reduce the need for artificial fertilizers. Fodder trees can also bean important feed source for livestock and reduce livestock pressure ongrassland.Indicator FrameworkAn attempt was made to establish a framework that covered all relevant sectors namely:Agriculture, Economy, Energy, Environment, Fishery, Social Welfare, Water Resourcesand Water Supply & Sanitation. Efforts to collect field data were carried out in the Kenyanpart of the basin, to enable the conceptualization and calculation of indicators specific tothe project scope and area. These efforts resulted in the calculation of the followingindicators:-Annual lake water level fluctuationsFish production indicatorsHouseholds with farm holdingsLabour division indicatorNet Present Value for hydropowerNet Present Value for irrigationPercent of years where water levels result in severe inundationSalinity indicatorSettlements affected by inundationThis framework was used in the Planning application to facilitate the evaluation of eachscenario as well as comparison of impacts across scenarios and the prioritizationexercise using the MCDA method.ii
Scenario ModellingThe impacts of each scenario are presented and discussed in detail. The indicatorframework is used for this purpose primarily. Additional model results are used as well tocomplement the discussion. For each scenario, the discussion of impacts is organizedper relevant sector. A summary of the key results is presented next.Scenario WRD 1 – Baseline by 2025WRD 1 is the baseline scenario including hydropower and irrigation developments thatare expected to be developed by the year 2025.Ethiopia has the largest energy production from hydropower accounting for 98 percent ofthe total hydropower production in the basin. The effect of the reservoirs on low flows intolake Turkana will be less pronounced than immediately downstream of Gibe III due tocatchment flow entering the Omo river from tributaries further downstream, but they willnevertheless have an impact on the seasonal variation of the lake water level.Water use from irrigation has a significant impact on average and minimum stream flowsdownstream of the irrigated areas. The sugar cane plantation at Kuraz accounts for mostof the water use due to its size. Here annual average water use is estimated to be 21.9m3/s corresponding to 3.9 percent of the stream flow upstream of Kuraz. During dryperiods this increases to around 12 percent for minimum flows (Q98). For comparison:annual average water use at the second largest irrigation scheme Gibe Valley is 0.02m3/s.Scenario WRD 2 – Full Development by 2040WRD 2 contains planned investments in hydropower, irrigation and domestic watersupply before 2040, according to the current national strategies consulted during thisproject.The planned investments in the two new hydropower plants will lead to an increase intotal annual average hydropower production of 2442 GWh corresponding to a percentageincrease of 16.6 compared to the baseline. Most of the increase is from the Gibe Vhydropower plant in Ethiopia, which accounts for 94 percent of the total increase.The reservoir and hydropower plant operation will affect the stream flow hydrologydownstream of the dams. In general, the total flow volumes are not affected or onlyaffected to a small degree. However, reservoir operation has an impact on the flowregime by increasing low flows and reducing peak flows. Minimum flow defined as the98th flow percentile increases from 236 m3/s to 272 m3/s downstream of Gibe V, anincrease of 14 percent. Average flows are reduced slightly both downstream of Gibe V,and downstream of Arror in the Kerio river, not due to the hydropower plants, but due toan increase in domestic water use in WRD 2.Water use due to increased irrigation results in a significant impact on average andminimum stream flows, particularly downstream of Kuraz reservoir. Average stream flowwill reduce by 5.3 percent from 509 to 482 m3/s. The irrigation scheme at Arror in Kenyawill only have a minimal impact on flows with a reduction in average flows downstream inthe upper Kerio catchment of 0.4 percent. This reduction also includes the effect of urbansupply upstream in the Kerio catchment.Lake water inflows and water levels will be impacted by the planned investments, mainlyby the increased irrigation at Kuraz and by Gibe V. The increases in domestic watersupply and the hydropower plant scheme at Arror, which includes irrigation, will only havea minimal impact on inflows to the Lake. Water levels in the lake are reduced by around 1meter at the end of the model period compared to the baseline.iii
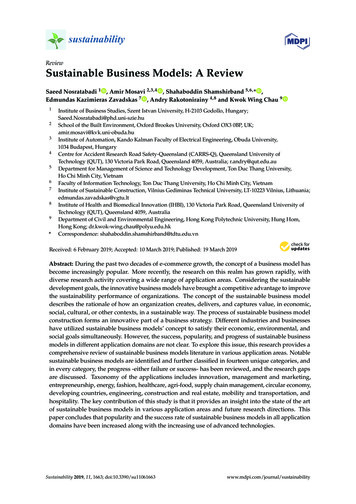
Based on water level alone fish catch per boat will be reduced from 10 tonnes in WRD 1to 7 tonnes. However, higher annual water level fluctuations result in longer periods ofoptimal conditions for fishing which could be beneficial for fish production.The scenario results of RAM2 are associated with a substantial margin of error.Scenario RAM 1 – Natural Flow ConditionsThe purpose of this scenario is to regenerate some of the mechanisms of natural inflow toLake Turkana while still maintaining sufficient hydropower production upstream. Thenatural flow data available and the flow in WRD 1 were analysed to create an inflowrequirement which partly mimics the natural flow variations.The mean annual water levels of Lake Turkana for WRD 1, RAM 2 and natural flowconditions are shown in Figure 0.1. The water level of 362 m.a.s.l is a critical water levelfor the lake as Ferguson’s Gulf dries out below this level. This is one of the majorbreeding grounds for fish and thus has a great importance for fish production in the lake.The average annual water level is below this value only in 3 instances for the natural flow,while this number is 10 for both WRD 1 and RAM 1.368NaturalWRD1RAM1367Water level [masl]3663653643633623613602001Figure 0.1200320052007200920112013201520172019Mean annual water level in Lake Turkana. The black line indicates the water level362 m.a.s.l. which is a critical water level for fish production in the lake.RAM1 generally causes larger water level fluctuations than WRD 1 although they are notas high in the natural flow. There are several years where the natural water levelfluctuations are within the 1-1.5 m range that is optimal for fish production, but RAM1 israrely in this range. However, there is a clear improvement over WRD 1. The fish catchper boat, calculated based on water levels, has increased by 1 tonne on average.Total hydropower production from Gibe III and Koysha increases by 2% from WRD1 toRAM1. However, while WRD1 has a continuous production over the year and higherproduction in the wet months, RAM 1 has a more gradual variation over the year. Eventhough the total production for RAM1 is slightly higher than in WRD1, there would berequirements for alternative power sources in Ethiopia during the dry months while itshould be ensured that power is not wasted in the wet season.iv
To improve these results, stronger measures would be necessary. Increasing the waterlevel would be challenging as this requires less water to be taken out of the system. Thiscould primarily be accomplished by reducing the area of the Kuraz Sugar Plantation. It ispossible that more optimal fluctuations could be achieved with the current system, butthat would come at the cost of a further reduction of hydropower in the dry season andthus of firm power production. Depending on the size of the flows in the wet season, it ispossible that these would exceed capacity, leading to spilling without production.Scenario RAM 2 – Reforestation, Soil and Water ConservationThe purpose of this scenario is to assess how reforestation, agroforestry, and soil andwater conservation measures may reduce flooding, soil erosion, and landslides.The likely effect of the simulated soil conservation measures is a considerable reductionin overland flow. This along with reforestation will increase evaporation which is whygroundwater recharge is not proportionally higher in the middle plot in Figure 4.26, onlyslightly. In turn, total runoff is reduced due to increased evaporation.This scenario aims at alleviating landslide issues, with reforestation and soil and waterconservation. Absolute values for indicators, will depend on the given conditions in thecatchment such as: slopes, rainfall regime, soil types, etc. A better land cover and betterroot network will reduce soil erosion and stabilize the slopes to reduce the risks oflandslides.Scenario RAM 3 – Enforcing Land and Riparian LegislationThe purpose of this scenario is to reduce the risk of damage due to Lake Turkana waterlevel rise by enforcing riparian land legislation which prohibits building of permanentstructures and waste disposal within 30m horizontal distance or 2m vertical height of thehighest recorded water level.The maximum water level in Lake Turkana from the model output (in WRD1) is 364m.a.s.l which is well below the demarcation of riparian land defined as below 368.8m.a.s.l. In RAM 3, construction of buildings is prohibited below 368.8 m.a.s.l. Thereforein RAM 3 no settlements are inundated by the rising water levels of Lake Turkanacompared to eight settlements inundated in WRD1 on the west side of the lake aroundthe Gulf of Ferguson and on the shoreline near Kerio and Eliye springs.The maximum water level in Lake Turkana across all scenarios is in scenario CC 2(extreme radiation forcing scenario RCP 8.5) where the water level reaches 367 m.a.s.l.This maximum water level is still below the riparian land demarcation level of 368.8m.a.s.l. Therefore, if the riparian land enforcement rehabilitation measure from RAM3 isapplied, there would be no inundated settlements across all future scenarios.Scenario RAM 4 – Transfer to Lake LogipiThis scenario is based on WRD1 and includes construction of an outlet from LakeTurkana to nearby Lake Logipi to make it possible to discharge water from Lake Turkanato Lake Logipi in years with high water levels. Water is discharged from Lake Turkanawhen the water level is 364 m.a.s.l. or above and transferred to Lake Logipi.The purpose of this scenario is to control flooding due to rising lake water levels byconstructing an outlet from Lake Turkana to nearby Lake Logipi when the water level is364 m.a.s.l. In the indicators and results we have only looked at the impact of thisrehabilitation measure on Lake Turkana and the surrounding settlements. We have notassessed the impact on Lake Logipi which could be significant given the ecologicalimportance of the lake, for example to Flamingoes that frequently inhabit the salinewaters feeding on cyanobacteria and other plankton (Mathea, 2009). An assessment ofthe construction, operation and maintenance costs of building the infrastructure to deliverwater from Lake Turkana to Lake Logipi has not been included.v
In RAM 4 only 4 settlements are inundated on the west side of the lake in the Gulf ofFerguson and on the lake shoreline near Kerio. In contrast, in WRD1 8 settlements areinundated with lake water levels reaching over 364 m.a.s.l. These settlements are on thewest side of the lake around the Ferguson’s Gulf and on the shoreline near Kerio andEliye Springs. In CC2 28 settlements are inundated (with lake water levels reaching over367 m.a.s.l) mostly on the west side of the Lake. In WRD1 water levels exceed 364m.a.s.l. only in the last two years of simulation, therefore the percentage of years withwater levels above 364 m.a.s.l. resulting in severe inundation is 10% in WRD1 but 0% inRAM4. In contrast, in CC2 the percentage of years with severe inundation is 40% but thiswould be reduced to 0% if the rehabilitation measures from RAM4 were applied.Scenarios CC 1 & CC 2 – Climate Change RCPs 4.5 and 8.5The two climate change scenarios are based on RAM1, but with all evaporation andrainfall time series replaced with ones that are adjusted to fit the climate changeprojections RCP 4.5 (CC1) and RCP 8.5 (CC2).The inflow from the Omo River to Lake Turkana increases with climate change, by 7% inCC 1 and 11% in CC 2. Climate change clearly has a significant impact on the waterlevels, which rise in both scenarios. At the end of the modelling period, the water level inCC 1 is 2.1 m higher than in RAM 1, and the difference is 2.7 m for CC2. The change ininundated settlements is dramatic, rising from 8 inundated settlements in RAM 1 to 20 inCC 1 and 28 in CC 2. This clearly shows that significant negative impacts due to floodingcan be expected in the future and that the events seen in 2020 may become morecommon.Fish production as a function of water level increases from an average of 11tonnes/boat/year to 14 tonnes in CC 1 and 15 tonnes in CC 2. The percentage of theperiod where the fluctuations are too low with respect to fish production decreases from80% in RAM1 to 70% in CC 1 and further to 65% in CC 2. The percentage of years withoptimal fluctuations increases accordingly. The largest fluctuation in the modelling periodis just below 2.5 m, which is still much lower than fluctuations of 4 m which are assessedto be detrimental.Power production falls in all the Ethiopian hydropower plants, while it increases forTurkwel in Kenya. The largest relative reduction happens for Gibe II, where productiondecreases by 13.1% and 18.1% in CC1 and CC2, respectively. The smallest decreasehappens for Koysha, where it is only around 1%. In all cases, the effects of climatechange (increase/decrease) are largest in CC2, with the exception of Koysha where thedifference between the two is very small. The total power production in the basin drops by5.1% and 7.2% in CC1 and CC2, respectively.It seems counterintuitive that the lake inflow from the Omo River increases while powerproduction in Ethiopia decreases. The explanation can be found in the distribution of theclimate change factors for rainfall. While rainfall is set to increase in most of the basin,there are decreases in the northern parts which is where most of the water in theupstream part of the Omo River is generated. Major increases in rainfall happendownstream of Gibe III and especially Koysha, thus explaining the increased inflow to thelake.Modelling of Key Basin IssuesThe impact of the different scenarios on selected key issues are compared and discussedwith focus on rehabilitation measures and climate change. To this end the Key Result andTrade-off plots from the Planning App were used.vi
Impact on Lake Turkana Water LevelFor RAM 2, RAM 3 and RAM 4 the mean annual water level is almost identical to WRD1.Although the main focus for RAM1 is to increase the annual fluctuations in the lake, italso results in a slight accumulated increase in the water level of 0.58 m as compared toWRD1. WRD 2 scenario, results in a substantial decrease in the lake water level as theaccumulated difference over the simulation period is about 1.16 m compared to WRD1.As a result, the mean annual water level is below the critical 362 m.a.s.l. for all simulationyears except three. On the other hand, the water level does not exceed 364 m.a.s.l.during the simulation period.24Figure 0.268101214161820Variation in mean annual water level (m.a.s.l.) in Lake Turkana for all scenariosduring the whole modelling period. Note that results for WRD1, RAM2, RAM3 andRAM4 overlap.Both climate change scenarios result in a marked increase in the water levels in LakeTurkana. The accumulated water level difference over the simulation period is 1.98 and2.48 m higher for CC 1 and CC 2, respectively, than for RAM 1 used as baseline. Thus,the mean annual water level is above 362 m.a.s.l. for most of the years. On the otherhand, there is a substantial number of years where the water level is above 364 m.a.s.l.,where severe flooding of settlements will start to occur.Impact on Annual Water Level Fluctuations of Lake TurkanaIt has been shown in scenario RAM 1 that it is possible to increase the annual water levelfluctuations from 0.72 to 0.89 m as illustrated in the figure below. Though not optimal (11.5 m) it is a considerable improvement. It has also been shown that at the same time ithas been possible to maintain and even slightly increase the total hydropower production.The firm power1 production logically has decreased due to the introduced seasonality, soa larger part of the total hydropower production is secondary power 2.1Mean annual firm energy production from hydropower plants, corresponding to energy production, which can bedelivered 90% of the time.2Mean annual firm energy production from hydropower plants, corresponding to energy production, which can bedelivered 90% of the time.vii
Figure 0.3Impact of RAM1 on Mean Annual water level Fluctuations in Lake Turkana, Total andFirm Hydropower Production in the basin. It has been possible to increasefluctuations and maintain the total hydropower production.Hydropower ProductionThe impact of the different scenarios on the hydropower production is summarized inTable 0.1. RAM2, RAM3, and RAM4 are all unchanged from WRD1 as no changes havebeen made to affect the reservoirs in these scenarios. A significant increase inhydropower production happens from WRD1 to WRD2 due to the introduction of two newreservoirs / hydropower plants, namely Gibe V in Ethiopia and Arror in Kenya.Table 0.1Total, firm, and secondary hydropower production (GWh/year) in the basin for alleight scenarios.WRD1 WRD2 RAM1 RAM2 RAM3 RAM4CC1CC2Total Hydropower14,702 17,144 14,925 14,702 14,702 14,702 14,165 13,844ProductionFirm Hydropower12,076 13,848 7,353 12,076 12,076 12,076 7,011 6,914ProductionSecondary Hydropower2,626 3,296 7,573 2,626 2,626 2,626 7,154 6,930ProductionFor RAM1, the total hydropower production is nearly unchanged and in fact slightlyincreased compared to WRD1. The introduced seasonality in the hydropower productioninevitably has resulted in a decrease in firm power, so a larger portion of the total powerproduction is secondary power. However, if connected to an energy grid with otherenergy sources, the hydropower production may be supplemented by the other sourcesduring the dry season when less hydropower is produced. In this case the decrease infirm power may not be critical and this provides an opportunity for restoring somefluctuations in the lake while still meeting Ethiopia’s energy needs.For the climate change scenarios, the total hydropower production in the basin decreasesby 3.7% for CC1 and 5.8% for CC2 when comparing to WRD1. There is an increase inproduction in Kenya, and reduction solely happens in Ethiopia, due to reduced runofffrom the northern parts of the basin. Although climate change projections are uncertain, itviii
is a potential issue of concern for Ethiopia that their hydropower schemes may generateless output in the future.FisheryThe values of the fishery indicators are summarized in Table 0.2. RAM2, RAM3, andRAM4 are all unchanged from WRD1. WRD2 has a small positive impact on the waterlevel fluctuations, with one year (5% of the simulation period) moving from too small tooptimal. However, the falling water levels have a negative impact on fishery and the waterlevel-based indicator decreases from WRD1 to WRD2.The climate change scenarios both have an apparent positive impact on the two types offish production indicators. A conflict exists because as the increasing water levels andfluctuations present better conditions for fishery, flood risk also increases. It is likely thatthe people dependent on a high fish production are the same people who have settledclose to the lake and are therefore affected by flooding.Table 0.2Fishery indicators for all scenarios. Small fluctuations are below 1 m, optimal are 11.5 m, neutral are above 1.5 m and below 4 m, and too large are 4 m and above.Years with too small fluctuations [%]WRD1 (RAM2,RAM3, RAM4)85WRD2RAM1CC1CC280807065Years with optimal fluctuations [%]1015102025Years with neutral fluctuations [%]55101010Years with too large fluctuations [%]00000Fish catch from water level [tons/boat]107111415Crop ProductionThe yearly production of maize and sugar cane production per country is shown in Table0.3 for all scenarios. WRD2 shows the largest change due to a new irrigation scheme,Arror in Kenya, growing maize and an expansion of the Kuraz Sugar Cane Plantation.RAM1 result in a marginal decrease of maize in Ethiopia but is otherwise unchanged.RAM2 show a small reduction of maize in Kenya. Maize in both countries decreasesslightly for the climate change scenarios. None of these changes, with the exception ofWRD2, are significant.Table 0.3Production of maize and sugar cane (tonnes) in Kenya and Ethiopia in all scenarios.Maize - EthiopiaMaize - KenyaSugar cane - Kuraz(Ethiopia)WRD1 23,953,1915,847,9163,953,191 3,953,191 3,953,191 3,953,191Lake Turkana Flooding and Possible Adaptation MeasuresWRD 1, RAM 1, RAM 2 and RAM 3 all experience severe water levels (i.e., larger than364 m.a.s.l.) 10% of years, the number of settlements which may be inundated at leastonce during the entire simulation period is 8, expect for RAM 3 which is 0. For both WRD2 and RAM 4 the percentage of years with severe water levels is zero, yet for differentreasons. In WRD 2 the increased abstraction results in a considerable reduction of thewater level in the lake. In RAM 4 water is discharge to Lake Logipi when reaching 364m.a.s.l., therefore, the water level does not exceed 364 m.a.s.l.ix
Climate change will likely have a negative impact on the same population due to thesignificant increase in ‘Percentage of years with Severe Water Levels’ indicator. As aresult, there will be a considerably increased risk of flooding with more settlementsaround the lake being inundated if no adaptation measures are implemented. Severeabrupt flooding like the one in 2020, has been relatively rare, yet climate changeprojections foresee that this may become a more regular, if no adaptation measures areput in place.Figure 0.4Riparian land demarcation (red) and Lake Turkana water level 364 m.a.s.l. (blue)with existing location of settlements.An alternative solution to the flood adaptation measures of RAM 3 and RAM 4 to addressthe projected increased inflow to the lake, could be to abstract more water in thex
upstream catchments, both the Kenyan as well as the Ethiopian parts of the basin. Thissituation has potential mutual gains whereby Ethiopia could abstract more water toincrease their agricultural production and at the same time help avoid flooding in Kenyaaround Lake Turkana.Limitations and uncertaintiesIt is important to note that the models used for this study, while checked and calibrated tothe best extent possible, have some limitations and uncertainties. Most importantly, therehas been a lack of data for e.g. river discharge, reservoir management, properties ofcurrent and planned investments, fish production, etc. The climate change scenarios arealso based on assumptions about future global greenhouse gas emissions and theirimpact on regional climatic patterns, known as the cascade of uncertainty in climatechange projections.For this reason, as comprehensive as the study has been at the basin and transboundarylevel, the conclusions presented should be taken as an indication of the impact ofdifferent measures. In future studies, exact values of hydropower production or lake waterlevel should be used to illustrate the order of magnitude of values and trends. Moreaccurate data on irrigation and livestock water use can also reduce uncertainty. Futurework on climate change projections work should focus on clustering a large number ofclimate change scenarios with statistical analysis of likelihood of and confidence in thedifferent scenarios.xi
CONTENTSEXECUTIVE SUMMARY.iIntroduction . iConclusions . iIndicator Framework . iiScenario Modelling . iiiModelling of Key Basin Issues. viLimitations and uncertainties . xi1Introduction .181.11.2Project Background . 18Purpose of this Report . 182Methodology .202.12.2Calculation and Upload of Indicators . 21Comparison of Scenarios in the Planning Application . 213Indicator Framework .264Scenario Mo
The planned investments in the two new hydropower plants will lead to an increase in total annual average hydropower production of 2442 GWh corresponding to a percentage increase of 16.6 compared to the baseline. Most of the increase is from the Gibe V hydropower plant in Ethiopia, which accounts for 94 percent of the total increase.