Transcription
Rheology BulletinThe News and Information Publication of The Society of RheologyVolume 76 Number 2 July 2007Inside:John Brady is 2007 Bingham MedalistSOR2007: Salt Lake City, Utah USAPhase Angle in Oscillatory TestingICR2008 Monterey USA Technical Program1
How do I know if my phase anglesare correct ?δ?1.Sachin S. Velankar, University of Pittsburgh andDavid Giles, University of MinnesotaIntroductionA large fraction of rheological testing involves smallamplitude oscillatory shear, sometimes referred to as“dynamic” experiments, which yield the complex modulusG* of the sample. The results of such tests are oftenrepresented in terms of the storage and loss moduli G′ andG′′, but it is conceptually useful to instead think of G* interms of its magnitude G* and its phase angle δ. Howcan these quantities be validated? If a rheometer reports,say, G* 12,755 Pa, and δ 88.78 degrees, how closelycan the user trust these values?The magnitude G* can be validated easily withNewtonian calibration standards of known viscosity.There have also been excellent studies of thereproducibility G* of molten polymers, which isimportant for quality control applications of rheometry1-5.Even in the absence of any rigorous validation, thespecifications on the torque, angular displacement, andfrequency range of the rheometer provide guidance onwhen the range or sensitivity of the instrument isexceeded, and hence large errors in G* can be expected.In contrast, it is much more difficult to judge the accuracyof the phase angle, δ. We are not aware of studies thatevaluate the accuracy of phase angle measurements.Furthermore, rheometer manufacturers do not providespecifications for phase angle, and hence there is no clearguidance on when the range or resolution of the rheometeris exceeded. It is not difficult to understand why phaseangle specifications are generally missing: phase angleresolution and accuracy will surely depend on the qualityof the torque and angular displacement signals.Approaching the low end of the torque or displacementrange, it might still be possible to measure the averagemagnitudes of these signals (allowing determination of G* within some well-defined, reasonable certainty), whilethe signal quality becomes too poor to accurately resolvethe phase shift between them. How can a rheologistestablish conditions under which his or her rheometer canmeasure phase angles within some well-defined certainty?A broad validation of phase angle measurements is beyondthe scope of this short article. We will concentrate onδ?validating phase angle measurements close to 90 degrees.This is important for practical purposes, not least becauseδ approaching 90 degrees corresponds to the terminalregion of most viscoelastic materials, where significantconnections between the rheology and structure can bemade. For example, fluids such as entangled polymermelts and polymer solutions generally show “standard”liquid-like terminal behavior (G′ ω2 and G′′ ω), whichcan be often be related quantitatively to specificmicroscale dynamic processes. In other cases, e.g. blockcopolymers, gels, or particle-filled systems, we are ofteninterested in deviations from standard liquid-like terminalbehavior to help identify, for example, an order-disordertransition or a liquid-to-gel transition. A recent article6 inthe Rheology Bulletin has also discussed the challenge ofmeasuring terminal viscoelastic properties in the contextof calculating the relaxation function G(t).When attempting to validate phase angle measurements, asignificant problem is the choice of a viscoelastic standardfor calibration: while viscosity standards are readilyavailable, materials with standard viscoelastic propertiesare less easy to come by. In the absence of standards,some laboratories validate a δ 90 degrees using aNewtonian fluid, δ 0 degrees using a steel test specimen,and presume that phase angles between 0 and 90 degreesare accurate. Some rheology labs have a standard PDMSputty with a broad spectrum of relaxation times whosephase angle at a particular temperature and frequency hasbeen specified by the supplier. The National Institute forStandards and Technology (NIST) has developed standardreference materials for viscoelastic measurements, mostrecently the SRM 2490 and SRM 2491 polymer solutionand melt7,8. However most laboratories do not have thesefluids, and some questions have also been raised about thevalidity of the viscoelastic specifications given for SRM24909. It would be very useful for experimentalrheologists to have a testing protocol, along with differentviscoelastic calibration standards, to validate oscillatorymeasurements on their own rheometers.Here we show that a linear, monodisperse, and wellentangled polymer melt can serve as an excellentviscoelastic calibration standard when δ is close to 90degrees. Such a material has a sharp transition to its8Rheology Bulletin, 76(2) July 2007
terminal region as frequency is reduced (see detailsg), andthus is in the terminal region even when δ is still far from90 degrees, and hence still easy to measure. Phase anglesclose to 90 degrees can then be validated by verifying thatthe rheometer reproduces the expected terminal behavior(tanδ proportional to 1/ω) at lower frequencies.In essence, this phase angle validation is a test of selfconsistency of the rheometer: (1) use the rheometer tocharacterize the terminal behavior of the fluid when δ isnot very close to 90 degrees, and (2) use the nowcharacterized terminal behavior to test the rheometerperformance under adverse conditions (e.g. δ approaching90 degrees closely, lower displacements, lower torques,etc.)2.A brief primer on dynamic oscillatorymeasurementsTheoryMost dynamic oscillatory tests are performed in controlledstrain mode. A sinusoidally-varying strain:γ γ 0 sin (ωt )(1)is imposed on the sample. Here ω is the frequency and γ0is the strain amplitude. The stress in the sample follows:σ σ 0 sin (ωt δ ) G * γ 0 sin (ωt δ )In Eqs. 6 and 7 above, the left hand side is the fractionalerror in G′ and G″, the first term on the right hand side isthe fractional error in the magnitude of the complexmodulus, and the last term reflects the error in measuringphase angle. It is clear that as δ approaches 90 degrees,the fractional error in G′ grows without bound even whenthe error in phase angle dδ remains finite. This is just aquantitative way of stating that it is difficult tocharacterize the elasticity of weakly-viscoelastic materials.The situation is reversed when δ approaches 0 degrees:then the error in G″ becomes large, whereas the error onG′ remains finite. In short, when one modulus is muchsmaller than the other, little of the total signal comes fromthe response associated with the smaller modulus, andmore error is likely in its measurement. Here, we willfocus on the case of δ approaching 90 degrees, where theelasticity is becoming very weak.The above equations suggest that rather than δ itself, it isbetter to work in terms of tanδ (or 1/tanδ) since thesedirectly relate to the accuracy and precision of the dynamicmoduli. We will reiterate this point at the end of thefollowing section.Practical measurementswhere σ0 is the stress amplitude and G is the magnitudeof the complex modulus. Most commonly, analysis isperformed in terms of the storage and loss moduli:σ γ 0 [G ′ sin (ωt ) G ′′ cos (ωt )]where G ′ G * cos(δ ) and G ′′ G * sin (δ )(3)(4)Even if the tests are performed in controlled stress mode,the same equations can be used to calculate the moduli.We can take the first step in error analysis as:(5)Assuming a parallel plate geometry with plates of diameter2R and gap of h, oscillatory measurements generallydepend on applying a displacement:θ θ 0 sin (ωt )(6)g Any linear viscoelastic fluid can be represented as a sum of Maxwellmodes. In a linear, monodisperse, well-entangled polymer, higher orderrelaxation modes are much faster and much weaker than the longestmode. Therefore the terminal region, i.e. the region in which the longestmode dominates, ranges from from tanδ (δ 90 degrees) down toabout tanδ 10 (δ 84 degrees). In contrast, in most other fluids,higher order modes become important when tanδ is still large (δ is stillclose to 90 degrees).(8)and measuring a torque:T T0 sin (ωt δ)(9)Here θ0 and T0 are the displacement and torque amplitudesrespectively. For the parallel plate geometry, one canobtain10:γ0 *dG ′ d G tan (δ)dδG′G*(7)(2)*dG ′ cos (δ )d G * G * sin (δ )dδd G*dδSimilarly, dG ′′ *(δ )G ′′tanGRθ 0 ;2Tσ2T0 hσ 0 03 , and hence G * 0 hγ 0 πR 4 θ0πR(10)Slightly different equations can be derived for othermeasurement geometries10. Thus, dynamic oscillatorymeasurements on rotational rheometers depend onmeasuring three quantities: θ0, T0 and δ. Conceptually,these three quantities can be measured by plotting thedisplacement and torque signals, as illustrated in Fig. 1.The factors limiting the accuracy of tanδ are clear fromthis diagram: As with any experimentally-determinedquantities, there are some errors associated with measuringdisplacement and torque. For example, if θ0 or T0 are10Rheology Bulletin, 76(2) July 2007
11GZ 46tim e8100246tim e810Fig. 1: a. The zero crossing of the sinusoidal displacement and torque signals give the phase lag, from which the phaseangle δ can be calculated. b. If the one or both of the signals are noisy, it will cause some uncertainty in the zerocrossing (illustrated by the shaded line), and hence error in measuring δ.small, the displacement and torque signals can showsubstantial noise, as illustrated in Fig. 1; such noise wasindeed evident in our experiments (discussed below) atsmall displacements or torques. There may also be minordrifts in the instrument baseline (e.g. the residual torque inan air bearing) over the timescale of a single oscillation.Regardless of cause, these errors in displacement andtorque cause errors in the phase angle.Once again we note that it is tanδ, and not δ, that is themore natural quantity for analysis. Actual implementationof Eqs. 11 and 12 change from one instrument to another,the raw signals are often digitized before any analysis, andinertial corrections and baseline subtraction may be anintegral part of the analysis.Early rheologists measured θ0, T0 and δ quite literally asillustrated in Fig. 1 by plotting the torque anddisplacement signals output from the rheometer on chartpaper (see Appendix 2 in Walters11 for a detailed graphicalprocedure). Modern rheometers on the other hand usesignal processing techniques, often in the digital domain,to obtain phase angles from the raw signals. One approachis to use a cross-correlation method of beating the torqueagainst two reference signals, one in phase with thedisplacement and the other 90 degrees out of phase withthe displacement10:The fluid used was Liquid Isoprene Rubber (LIR50), alinear monodisperse 1,4-polyisoprene (high cis content)supplied by Kuraray Corp. This polymer was made byanionic polymerization and had a molecular weight of 45000 kg/mol and polydispersity of less than 1.1. Alltests were performed using the AR2000 rheometer with a40 mm or 25 mm parallel plate geometry with gapsranging from 0.5 to 2 mm, at a temperature of 25 Cmaintained with a Peltier plate. The rheometer wasmounted on a vibration-isolated platform and leveled.Samples were loaded without air bubbles and excesssample was “trimmed” from the edges when the gap was10% larger than the desired gap. All tests were performedusing the default settings for oscillatory testing(“Continuous oscillation”, conditioning time and samplingtime both being 3 s or 1 cycle, whichever is longer).2 πNω ωS1 T sin (ωt )dt T0 cos δ ;πN 02 πNω ωS2 T cos(ωt )dt T0 sin δπN 0Experiments and results(11)where N is the number of cycles. Thus, the T0 and thephase angle can be obtained independently:T0 S12 S22 and tan δ S 2S13.(12)3.1. Validation of phase angles : Constant-strainfrequency sweep experimentsA common oscillatory test sequence involves conducting asingle oscillatory measurement at each frequency in aspecified frequency range, with the strain amplitude beingkept constant throughout the frequency range. This test11Rheology Bulletin, 76(2) July 2007
Z10410510310389.91.90.0189.7102tan G101fit region0.1110Z (rad/s)10289G degreesG', G" (Pa)log (Z*tan G)89.9910%1%0.1%fitstrain sweeps1042.1861001018010-160a10-20.010.11frequency Z (rad/s)101001000.0110%1%0.1%fitstrain sweeps0.1fit regionb1frequency Z (rad/s)10100ZGFig. 2: Black symbols are a. oscillatory moduli from frequency sweep experiments at three different strain amplitudes.b. tanδ from the same experiment. Red symbols are data from strain sweep experiments of Fig. 3. Thin blue lines areterminal behavior (Eqs. 13) fitted to the 0% strain data within the shaded yellow rectangles. Inset to b. shows the tanδresults in a form more suitable to identifying deviation from terminal behavior. In the inset, solid blue line shows theterminal behavior (Eqs. 13), and dotted blue lines show 5% deviation from the terminal behavior.GGsequence is often called a “frequency sweep” test in theZsoftware associated with many rheometers.The blackdiamonds in Figs. 2 a&b show the results of a frequencysweep test performed at a strain amplitude of 10%, whichis within the linear viscoelastic limit. As expected, thislinear, monodisperse, entangled polymer shows terminalbehavior down to fairly small tanδ values of about 10.There is therefore a range of frequencies (illustrated by theyellow region in Figs. 2 a&b) in which two conditions aresatisfied: the material is in the terminal regime, and theinstrument can be expected to measure tanδ reliably. Wecan therefore establish the terminalbehavior of thisZmaterial:G ′ 13.13ω2 ; G ′′ 1401ω ;tanδ 106.7ωthe correct terminal behavior can be captured from phaseangle data far from δ 90 degrees.Upon repeating the frequency sweep tests at lower strains,the rheometer makes significant errors at large tanδ, e.g. at0.1% strain, it is not possible to measure a tanδ of even100 (δ 89.4 degrees) accurately. However, small valuesof tanδ can still be measured accurately. In other words,as tanδ increases (δ approaches 90 degrees), anincreasingly larger strain amplitude is necessary foraccurate measurements. This immediately suggests thatthe accuracy of frequency sweep tests can be improved byincreasing the strain amplitude as tanδ increases. This willbe discussed in more detail below.(13)The accuracy of oscillatory measurements as δ approaches90 degrees can now be tested by examining deviationsfrom this behavior at lower frequencies. Indeed the datado deviate from the expected terminal behavior. Suchdeviations are more clearly evident when the product oftanδ and frequency – which is expected to be constant inthe terminal region – is plotted vs. frequency (see inset toFig. 2b). If we regard a 5% error on tanδ as acceptable, at10% strain it appears that oscillatory measurements areaccurate up to tanδ on the order of 1000 (δ 89.94degrees). This simple test to validate phase anglemeasurements can be performed only because the fluid ismonodisperse and well-entangled, i.e. the phase anglevalidation is crucially dependent on the assumption that3.2. Instrumental limits for phase angle accuracy:A strain-sweep protocolA key finding of Fig. 2 is that at small strain, there can besignificant errors in measuring tanδ. It is therefore ofimmediate interest to find the minimum strain, γmin,required for measuring tanδ within a specified error, say5%. To characterize this γmin as a function of tanδ, weconducted strain sweep tests at several differentfrequencies. Fig. 3 shows a typical sample of the results.At each frequency, the measured values of tanδ show aplateau at sufficiently high strain amplitude, and adeviation from the plateau at low strain amplitude. Wewill discuss these features in succession.(continues page 18)12Rheology Bulletin, 76(2) July 2007
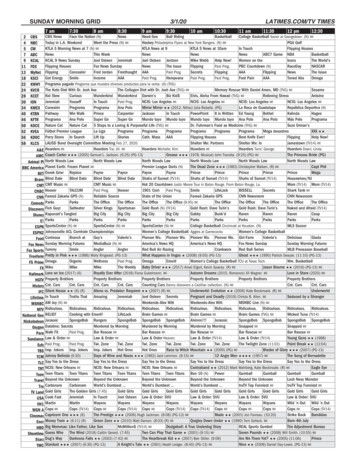
(Phase Angle, continued from page 12)10minimum strain Jmin %2.6log (tanG)2.4high-strainplateau /- rementsinaccurate0.010.56 rad/s0.32 rad/s1.80.010.0010.1110strain J %100Fig. 3: Typical strain sweep measurements at threedifferent frequencies. The horizontal lines show /5% error limits for tanδ at 0.56 rad/s. The vertical lineidentifies γmin, the minimum strain required forreliable phase angle measurement.10000.1110frequency Z (rad/s)100Fig. 4: Minimum strain amplitude, γmin, as a function of frequency. Red circlesare the γmin values obtained from Fig. 3, and the line is a guide to the eye. For ω 20 rad/s, the γmin was smaller than the smallest strain that could be applied by therheometer for the geometry used. Data at ω 0.1 have been excluded because thestandard deviation on tanδ exceeded 5% (see inset to Fig. 2b).The mean values of the high-strain plateau at eachfrequency have been added to Figs. 2a and b (red points).These mean values agree well with the previous frequencysweep data, and are all within 5% error of the expectedterminal value. Thus, on an average, the AR2000 canmeasure large tanδ values – exceeding 1000 – accurately.However, the error bars in Fig. 2b show the standarddeviation of the various points constituting the plateau.From these error bars it is clear that as tanδ approachesand exceeds about 1000 (ω 0.1 rad/s), the standarddeviation on tanδ increases sharply and can exceed 5% ofthe mean value (this is more clearly visible in the inset toFig. 2b), i.e. a single measurement of tanδ is not likely tobe within 5% error.Fig. 3 also shows that with decreasing strain, the measuredvalues of tanδ deviate, and reduce systematically from theplateau value. We can immediately identify the strain,γmin, below which most tanδ values are more than 5% inerror; the procedure for doing so is illustrated at thefrequency of 0.56 rad/s in Fig. 3. The values of γmin thusobtained are plotted as a function of frequency in Fig. 4.This diagram is a map of instrumental limitations whenmeasuring phase angles: the region below the solid line,labeled “measurements inaccurate” is to be avoided whenconducting measurements.This map quantifies the observation already made inSection 3.1, viz. accurate phase angle measurementsrequire increasingly larger strain amplitudes at lowfrequencies. Thus, a simple strategy to improving theaccuracy of oscillatory measurements is: don’t conduct afrequency sweep test at fixed strain amplitude, instead,increase the strain amplitude at low-frequency. The samestrategy was proposed previously for improving thereproducibility of G* 2. One convenient way of doing sois to perform a frequency sweep at fixed stress amplitude,so that the strain increases as frequency reduces (γ ω-1for a material in its terminal region). Another convenientmethod is to use a “Minimum Torque” option available insome rheometers for strain-controlled frequency sweeptests. This option increases the strain amplitude beyondthe specified value if the torque is less than a userspecified minimum value. It would be useful if thesoftware also had provision to specify a maximum strainthat should not be exceeded. In all such cases, whenincreasing the strain to improve the quality of oscillatorydata, the rheologist must take care to remain in the linearviscoelastic region.The form of Fig. 4, viz. the minimum strain vs. frequency,is not very practical because a different material may showa significantly different γmin vs. ω behavior. For example,consider what would happen if the same test were repeatedwith a less elastic fluid for which tanδ at 1 rad/s is muchhigher, say 10,000. We certainly do not expect therheometer to be able to measure accurately a tanδ of10,000 – no matter how high the strain.Therefore, we redraw Fig. 4 in a form that directlyaddresses the question: “What conditions should be met tomeasure any particular value of tanδ accurately?” Indrawing such a map, we must avoid “derived” quantitiessuch as strain, and instead use more basic parameters viz.the torque and the displacement. Accordingly, a betterrepresentation of the instrumental limits may be obtained18Rheology Bulletin, 76(2) July 2007
1E 41E-2Dataset of Fig. 4Dataset of Fig. 4measurementsaccurate1E 3additionalrunstorque (microN-m)displacement (rad)1E-31E-4additionalrunsmeasurementsaccurate1E 21E-51E 11E-60.1110tan G10010001E 00.1110tan G1001000Fig. 5: Maps of instrument limits. Red circles are the torque and displacement corresponding to the samedataset as Fig. 4. Remaining symbols are various runs with different gaps and plate diameters.by plotting the minimum torque Tmin and minimumdisplacement θmin corresponding to each γmin, as a functionof the tanδ corresponding to each frequency. Such arepresentation is shown in Fig. 5, where the red pointscorrespond to the same dataset in Fig. 4.We repeated the analysis of Fig. 3 several times over aperiod of a few months using parallel plate geometry withgaps ranging from 2 mm to 0.5 mm, and plate diameters of40 mm or 25 mm. These data are also shown in Fig. 5.The broad yellow lines through the scattered points showthe general trend: measuring higher tanδ requiresincreasingly higher amplitudes of the basic torque anddisplacement signals for the same (5%) error limits. Thereis substantial scatter in the minimum torque anddisplacement, i.e. in some runs, the specified level ofperformance (5% error on tanδ) can be achieved undermore adverse conditions, whereas in other runs, the sameperformance required much larger displacement andtorque values. We are not certain why the instrumentlimits are so inconsistent; it may be due to uncontrollablefactors such as minor changes in air bearing pressure,incidental vibrations, possible electrical noise, etc. It isimportant to emphasize that it is only the minimum torqueand displacement limits of the rheometer that are notreproducible from one run to another; the tanδ values awayfrom the limits (i.e. the plateaus in Fig. 3) were highlyconsistent. For accurate measurements, one must conductexperiments substantially above the minimum limitsestimated in Fig. 5 so that irreproducibility of the limitsdoes not affect the results.In this article we have only been concerned with largevalues of tanδ. As mentioned in Section 2, at large tanδ,oscillatory measurements are limited by the error in G′which grows proportionately to tanδ. In the other extremeof tanδ approaching zero, oscillatory measurements arelimited by the errors in G", which grow proportionately to(tanδ)-1. Thus we anticipate that with decreasing tanδ, θminand Tmin will rise again; this is the reason why the broadyellow curves in Fig. 5 have been shown to have minima.Experiments with other fluids for which G′ exceeds G"would be necessary to verify the upturn in the minimumtorque or displacement for tanδ 1.Of these two parameters, θmin or Tmin, which one is themore fundamental limiting factor? Our results of Figure 5show a great deal of scatter, both for small changes ingeometry and even for repeat tests using the samegeometry. Therefore we are unable to answer thisquestion here except to note that the range of scatter islarger for the torque than for the displacement. Thisargues for a displacement limit that is fundamental.Repeating these experiments with fluids with substantiallydifferent viscosity would help determine whether torque ordisplacement is the fundamental limiting factor.4.Closing commentsIn summary, we have presented procedures to validate theaccuracy of phase angle measurements as the phase angleapproaches 90 degrees. They are easy to conduct and usereadily available materials, viz. linear, monodisperse, wellentangled polymers, as calibration standards. Therefore19Rheology Bulletin, 76(2) July 2007
the test can be applied easily by any rheologist to test anyspecific rheometer.In plotting the instrumental limits in the form of Fig. 5, wehave presumed that the most important parameters thataffect phase angle accuracy are the torque and thedisplacement. While this is eminently plausible, otherfactors may also play a role. For example, at highfrequency, the accuracy of any inertial corrections, ratherthan limitations of torque or displacement, may dominatethe performance limits. In the experiments in this paper,inertial effects were negligible over most of the frequencyrange.We have used the polyisoprene LIR50, for phase anglevalidation because this is a linear, monodisperse, roomtemperature melt which was already available in a largequantity in our laboratory. Other rheologists may find itmore convenient to select other model fluids, eitherpolymer melts or solutions, that are more similar to theirfluids of interest. As long as the fluid is monodisperse andwell-entangled, the terminal region will extend over awide range of tanδ and the procedure outlined here can beapplied. In fact, the strain sweep procedure of Fig. 3 doesnot even need a model fluid: it will yield the limits ofresolution of tanδ (Fig. 5) for any material and at anyphase angle. However, without a model fluid, there willbe no guarantee that the high-strain plateau values of Fig.3 are correct; whereas with a linear monodisperse fluidsuch as LIR50, the same experiment will also validate theaccuracy of tanδ as δ approaches 90 degrees.It is worth noting that in our strain-controlled experiments,while the AR2000 could measure phase angles quite closeto 90 degrees, it never reported δ values exceeding 90degrees (i.e. negative values of tanδ). This is somewhatsurprising; the simple-minded expectation would be thatthe rheometer makes random errors in measuring phaseangle, and hence as δ approaches close to 90 degrees,measured values of δ will fall on both sides of 90 degrees.We are not sure why the measured values of δ remainbelow 90 degrees, but this may also be the reason whythere are systematically-negative deviations of tanδ at lowstrain in Fig. 3.The minimum torques and displacements required foraccurate phase angle measurements (Fig. 5) aresubstantially larger than the minimum torque anddisplacement specifications quoted by the manufacturer.We suspect that specifications given for the AR2000, andperhaps for other rheometers, are only intended for G* orη*, and not for phase angle measurements. If so, the givenspecifications are of only limited use since oscillatorymeasurements must include the phase angle to give anyinformation about viscoelasticity.provided signals are maintained above limits such as thoseof Fig. 5. This is remarkable performance, and better thanwe had expected prior to performing these tests. Thislevel of performance was realized using the default testsettings of the rheometer, and without taking any specialprecautions in sample loading, except to avoid bubbles:bubbles could give a large error in G' in the terminalregion due to their surface tension elasticity.AcknowledgementWe are grateful to Kuraray America Co. for donating theLIR 50 polyisoprene sample for this research. We are alsograteful to experts from TA Instruments (notably Dr.Bernard Costello and Dr. Ron Garritano) and Paar-Physica(Dr. Joerg Lauger) for discussions and clarifications, andto Prof. John Dealy (McGill University) and Dr. PeterSaucier (Dow Chemicals) for providing references 1-5.Bibliography1.Saucier, P. C. & Obermiller, D. J. Precision in linearviscoelastic property measurement: Establishing a protocolfor statistical quality control. Annual Technical Conference- Society of Plastics Engineers 53rd, 1085-90 (1995).2. Tchir, W. J. & Saucier, P. C. A statistical approach to curvefitting rheological data inclusive of experimental errors.Annual Technical Conference - Society of PlasticsEngineers 49th, 2321-5 (1991).3. Saucier, P. C. & Tchir, W. J. Measurement and modeling ofviscoelastic properties: estimation of parameters unbiasedby property evolution. Annual Technical Conference Society of Plastics Engineers 50th, 2452-6 (1992).4. Bafna, S. S. Precision of dynamic oscillatory measurements.Polym. Eng. Sci. 36, 90-97 (1996).5. Dealy, J. M. & Saucier, P. Rheology in Plastics QualityControl (Hanser Publishers, Munich, 2000).6. Dealy, J. M. Questions about relaxation spectra submittedby a reader. Rheology Bulletin 76, 14 (2006).7. Fanconi, B. & Flynn, K. Non-newtonian polymer solutionfor rheology now available - Standard Reference Materials.Journal of Research of the National Institute of Standardsand Technology 108, 97-98 (2003).8. Schultheisz, C. R. & Leigh, S. F. in NIST SpecialPublication 260-143 (U.S. Department of Commerce,National Institute of Standards and Technology, 2002).9. Laeuger, J., Heyer, P. & Snyder, C. R. in 77th AnnualMeeting of the Society of Rheology (Vancouver, 2005).10. Macosko, C. W. Rheology: Principles, Measurements, andApplications (ed. Macosko, C. W.) (Wiley-VCH, NewYork, 1994).11. Walters, K. Rheometry (Chapman and Hall, London, 1975).Despite this criticism, we want to comment that theAR2000 rheometer, and perhaps other comparableinstruments, can measure very high values of tanδ –roughly on the order of 1000 – within 5% accuracy,20Rheology Bulletin, 76(2) July 2007
the rheometer reproduces the expected terminal behavior (tanδ proportional to 1/ω) at lower frequencies. In essence, this phase angle validation is a test of self-consistency of the rheometer: (1) use the rheometer to characterize the terminal behavior of the fluid when δ is not very close to 90 degrees, and (2) use the now-